Sauk Rapids, MN Map & Demographics
Sauk Rapids Map
Sauk Rapids Overview
$35,029
PER CAPITA INCOME
$91,129
AVG FAMILY INCOME
$66,442
AVG HOUSEHOLD INCOME
28.0%
WAGE / INCOME GAP [ % ]
72.0¢/ $1
WAGE / INCOME GAP [ $ ]
0.39
INEQUALITY / GINI INDEX
13,830
TOTAL POPULATION
6,750
MALE POPULATION
7,080
FEMALE POPULATION
95.34
MALES / 100 FEMALES
104.89
FEMALES / 100 MALES
34.5
MEDIAN AGE
3.1
AVG FAMILY SIZE
2.5
AVG HOUSEHOLD SIZE
7,659
LABOR FORCE [ PEOPLE ]
73.5%
PERCENT IN LABOR FORCE
2.9%
UNEMPLOYMENT RATE
Sauk Rapids Zip Codes
Income in Sauk Rapids
Income Overview in Sauk Rapids
Per Capita Income in Sauk Rapids is $35,029, while median incomes of families and households are $91,129 and $66,442 respectively.
| Characteristic | Number | Measure |
| Per Capita Income | 13,830 | $35,029 |
| Median Family Income | 3,226 | $91,129 |
| Mean Family Income | 3,226 | $105,306 |
| Median Household Income | 5,386 | $66,442 |
| Mean Household Income | 5,386 | $87,165 |
| Income Deficit | 3,226 | $0 |
| Wage / Income Gap (%) | 13,830 | 28.03% |
| Wage / Income Gap ($) | 13,830 | 71.97¢ per $1 |
| Gini / Inequality Index | 13,830 | 0.39 |
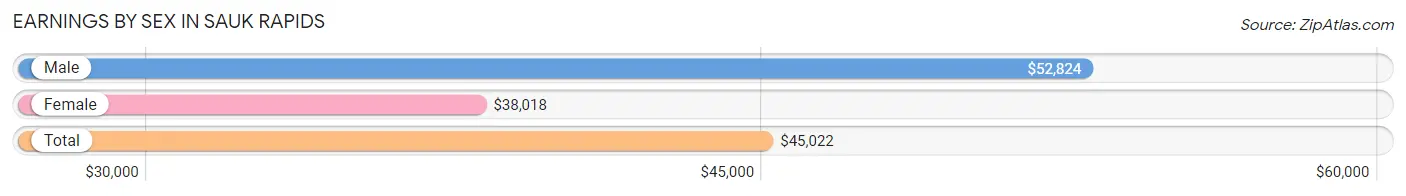
Earnings by Sex in Sauk Rapids
Average Earnings in Sauk Rapids are $45,022, $52,824 for men and $38,018 for women, a difference of 28.0%.
| Sex | Number | Average Earnings |
| Male | 3,921 (50.0%) | $52,824 |
| Female | 3,916 (50.0%) | $38,018 |
| Total | 7,837 (100.0%) | $45,022 |
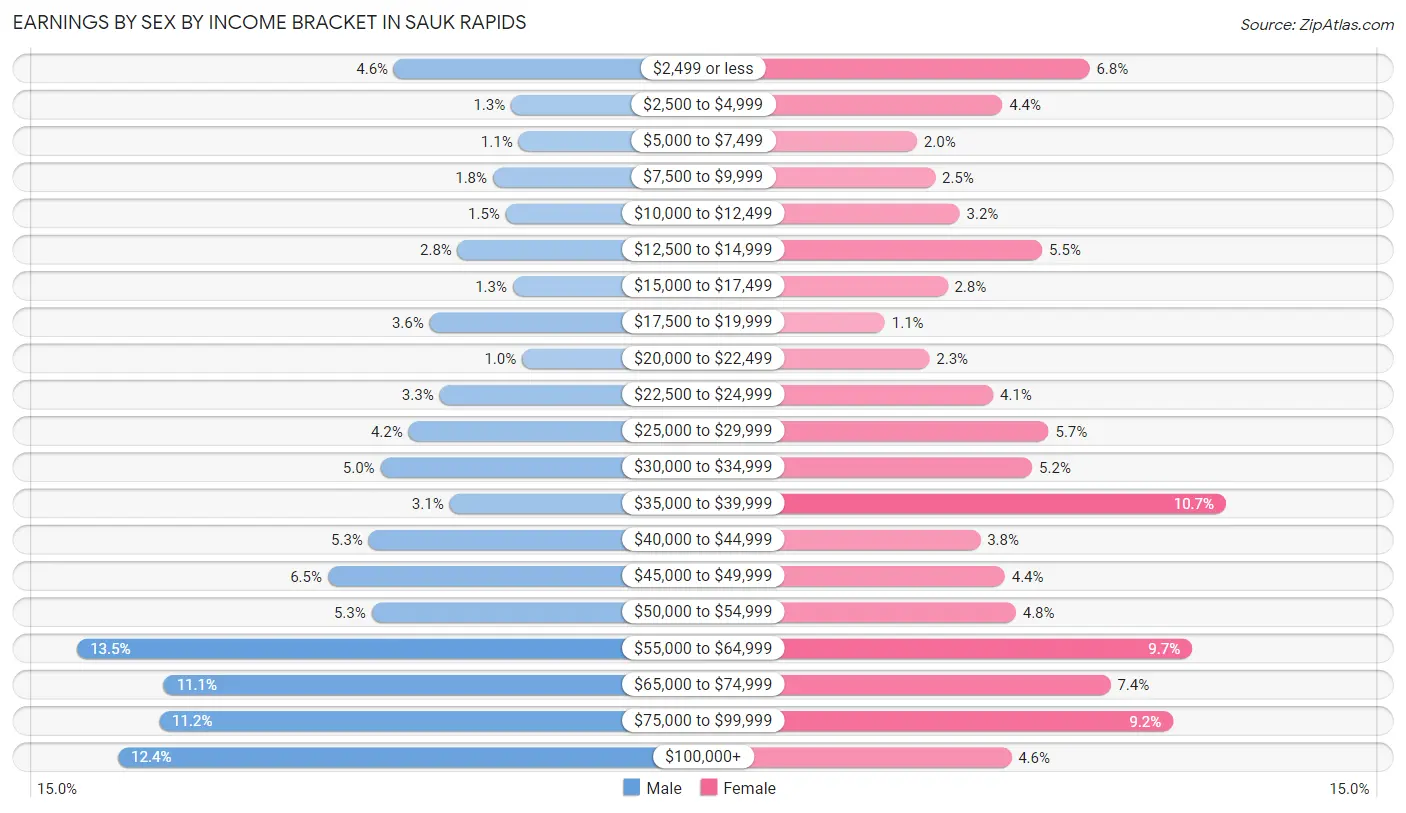
Earnings by Sex by Income Bracket in Sauk Rapids
The most common earnings brackets in Sauk Rapids are $55,000 to $64,999 for men (530 | 13.5%) and $35,000 to $39,999 for women (417 | 10.6%).
| Income | Male | Female |
| $2,499 or less | 181 (4.6%) | 267 (6.8%) |
| $2,500 to $4,999 | 52 (1.3%) | 171 (4.4%) |
| $5,000 to $7,499 | 44 (1.1%) | 77 (2.0%) |
| $7,500 to $9,999 | 72 (1.8%) | 97 (2.5%) |
| $10,000 to $12,499 | 58 (1.5%) | 124 (3.2%) |
| $12,500 to $14,999 | 111 (2.8%) | 215 (5.5%) |
| $15,000 to $17,499 | 50 (1.3%) | 111 (2.8%) |
| $17,500 to $19,999 | 142 (3.6%) | 42 (1.1%) |
| $20,000 to $22,499 | 40 (1.0%) | 91 (2.3%) |
| $22,500 to $24,999 | 131 (3.3%) | 161 (4.1%) |
| $25,000 to $29,999 | 165 (4.2%) | 222 (5.7%) |
| $30,000 to $34,999 | 196 (5.0%) | 204 (5.2%) |
| $35,000 to $39,999 | 120 (3.1%) | 417 (10.6%) |
| $40,000 to $44,999 | 209 (5.3%) | 147 (3.7%) |
| $45,000 to $49,999 | 254 (6.5%) | 174 (4.4%) |
| $50,000 to $54,999 | 206 (5.2%) | 186 (4.8%) |
| $55,000 to $64,999 | 530 (13.5%) | 380 (9.7%) |
| $65,000 to $74,999 | 435 (11.1%) | 290 (7.4%) |
| $75,000 to $99,999 | 440 (11.2%) | 359 (9.2%) |
| $100,000+ | 485 (12.4%) | 181 (4.6%) |
| Total | 3,921 (100.0%) | 3,916 (100.0%) |
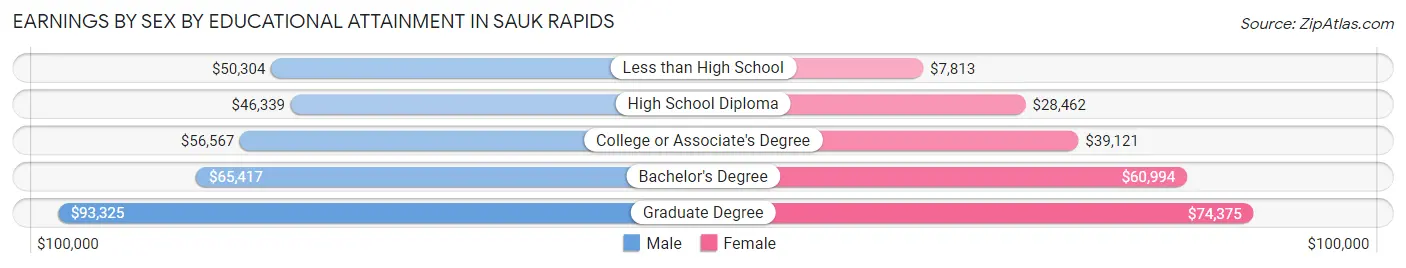
Earnings by Sex by Educational Attainment in Sauk Rapids
Average earnings in Sauk Rapids are $57,019 for men and $43,643 for women, a difference of 23.5%. Men with an educational attainment of graduate degree enjoy the highest average annual earnings of $93,325, while those with high school diploma education earn the least with $46,339. Women with an educational attainment of graduate degree earn the most with the average annual earnings of $74,375, while those with less than high school education have the smallest earnings of $7,813.
| Educational Attainment | Male Income | Female Income |
| Less than High School | $50,304 | $7,813 |
| High School Diploma | $46,339 | $28,462 |
| College or Associate's Degree | $56,567 | $39,121 |
| Bachelor's Degree | $65,417 | $60,994 |
| Graduate Degree | $93,325 | $74,375 |
| Total | $57,019 | $43,643 |
Family Income in Sauk Rapids
Family Income Brackets in Sauk Rapids
According to the Sauk Rapids family income data, there are 806 families falling into the $50,000 to $74,999 income range, which is the most common income bracket and makes up 25.0% of all families.
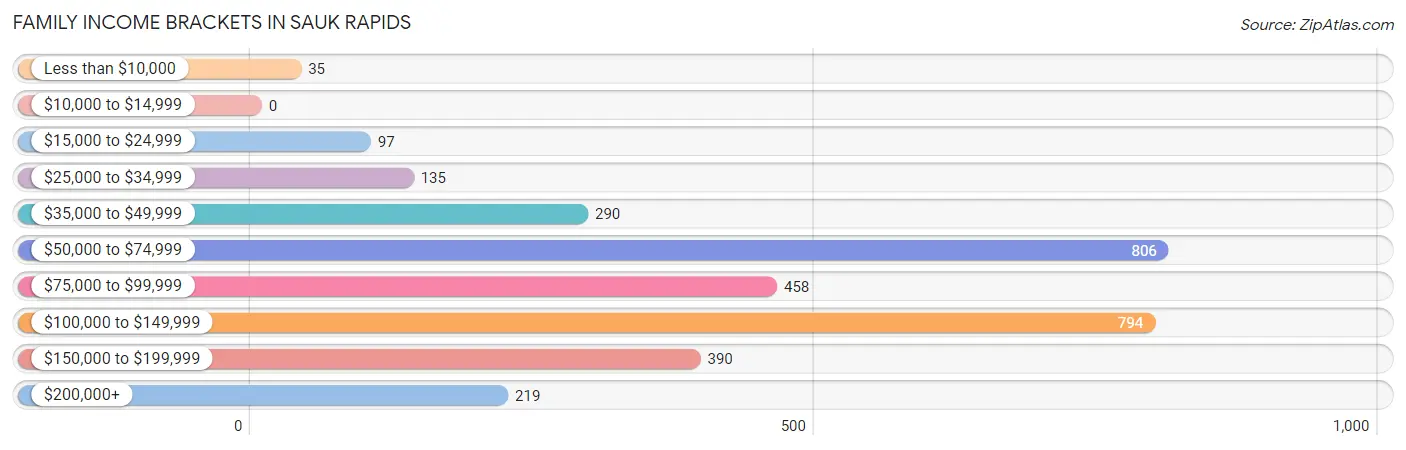
| Income Bracket | # Families | % Families |
| Less than $10,000 | 35 | 1.1% |
| $10,000 to $14,999 | 0 | 0.0% |
| $15,000 to $24,999 | 97 | 3.0% |
| $25,000 to $34,999 | 135 | 4.2% |
| $35,000 to $49,999 | 290 | 9.0% |
| $50,000 to $74,999 | 806 | 25.0% |
| $75,000 to $99,999 | 458 | 14.2% |
| $100,000 to $149,999 | 794 | 24.6% |
| $150,000 to $199,999 | 390 | 12.1% |
| $200,000+ | 219 | 6.8% |
Family Income by Famaliy Size in Sauk Rapids
5-person families (311 | 9.6%) account for the highest median family income in Sauk Rapids with $142,621 per family, while 2-person families (1,490 | 46.2%) have the highest median income of $39,375 per family member.
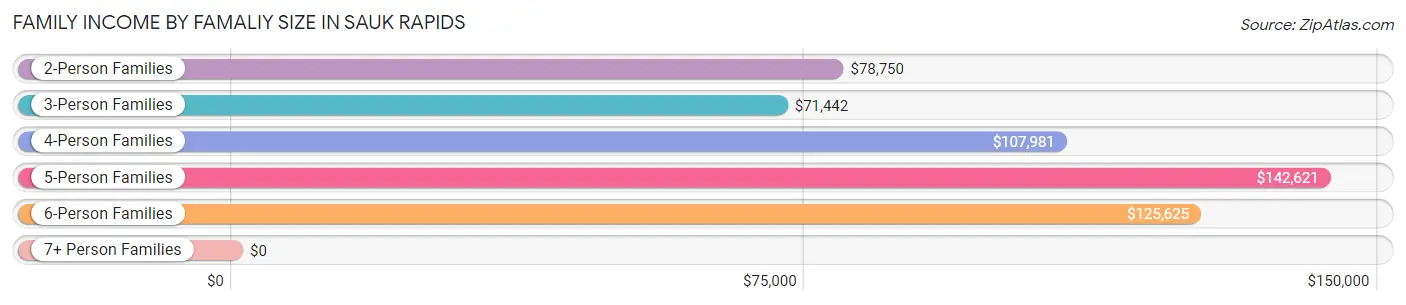
| Income Bracket | # Families | Median Income |
| 2-Person Families | 1,490 (46.2%) | $78,750 |
| 3-Person Families | 721 (22.4%) | $71,442 |
| 4-Person Families | 616 (19.1%) | $107,981 |
| 5-Person Families | 311 (9.6%) | $142,621 |
| 6-Person Families | 60 (1.9%) | $125,625 |
| 7+ Person Families | 28 (0.9%) | $0 |
| Total | 3,226 (100.0%) | $91,129 |
Family Income by Number of Earners in Sauk Rapids
The median family income in Sauk Rapids is $91,129, with families comprising 3+ earners (327) having the highest median family income of $156,179, while families with no earners (363) have the lowest median family income of $51,169, accounting for 10.1% and 11.3% of families, respectively.
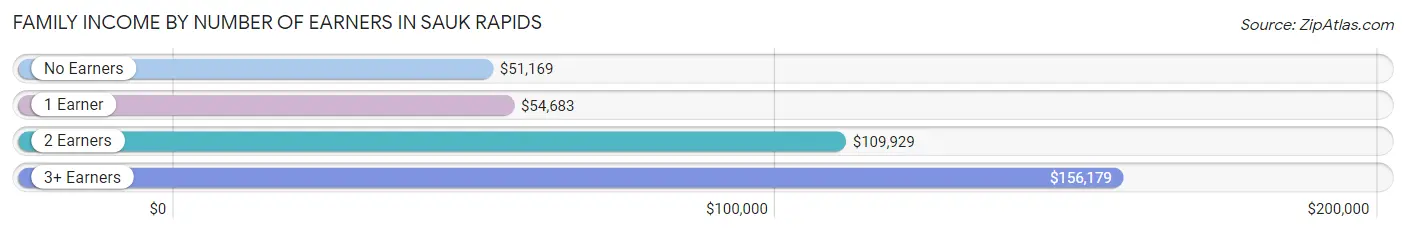
| Number of Earners | # Families | Median Income |
| No Earners | 363 (11.3%) | $51,169 |
| 1 Earner | 816 (25.3%) | $54,683 |
| 2 Earners | 1,720 (53.3%) | $109,929 |
| 3+ Earners | 327 (10.1%) | $156,179 |
| Total | 3,226 (100.0%) | $91,129 |
Household Income in Sauk Rapids
Household Income Brackets in Sauk Rapids
With 1,153 households falling in the category, the $50,000 to $74,999 income range is the most frequent in Sauk Rapids, accounting for 21.4% of all households. In contrast, only 102 households (1.9%) fall into the less than $10,000 income bracket, making it the least populous group.
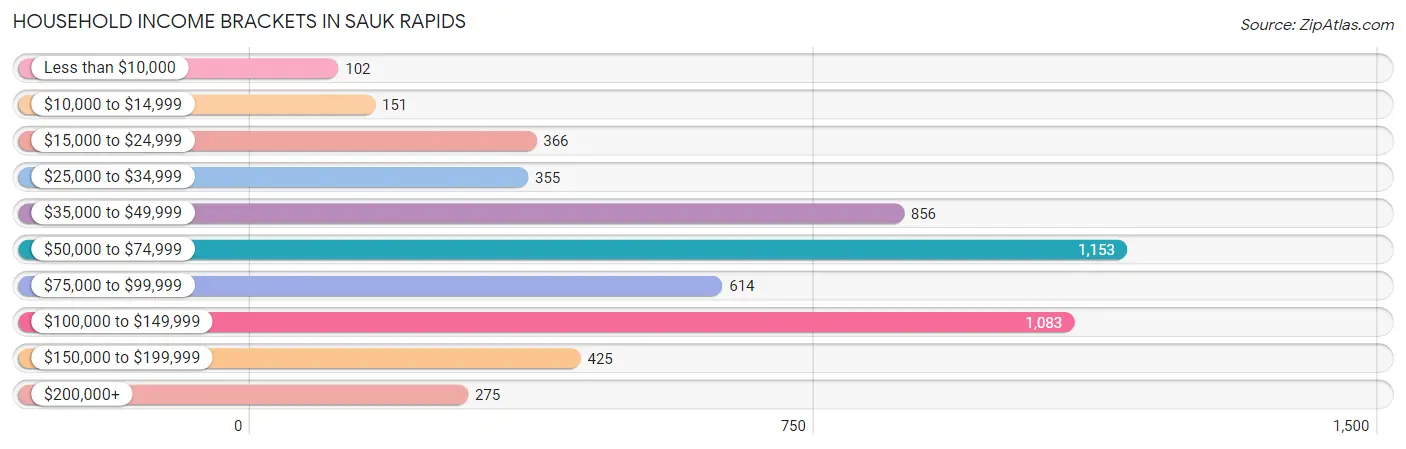
| Income Bracket | # Households | % Households |
| Less than $10,000 | 102 | 1.9% |
| $10,000 to $14,999 | 151 | 2.8% |
| $15,000 to $24,999 | 366 | 6.8% |
| $25,000 to $34,999 | 355 | 6.6% |
| $35,000 to $49,999 | 856 | 15.9% |
| $50,000 to $74,999 | 1,153 | 21.4% |
| $75,000 to $99,999 | 614 | 11.4% |
| $100,000 to $149,999 | 1,083 | 20.1% |
| $150,000 to $199,999 | 425 | 7.9% |
| $200,000+ | 275 | 5.1% |
Household Income by Householder Age in Sauk Rapids
The median household income in Sauk Rapids is $66,442, with the highest median household income of $85,096 found in the 45 to 64 years age bracket for the primary householder. A total of 1,663 households (30.9%) fall into this category. Meanwhile, the 15 to 24 years age bracket for the primary householder has the lowest median household income of $24,583, with 187 households (3.5%) in this group.
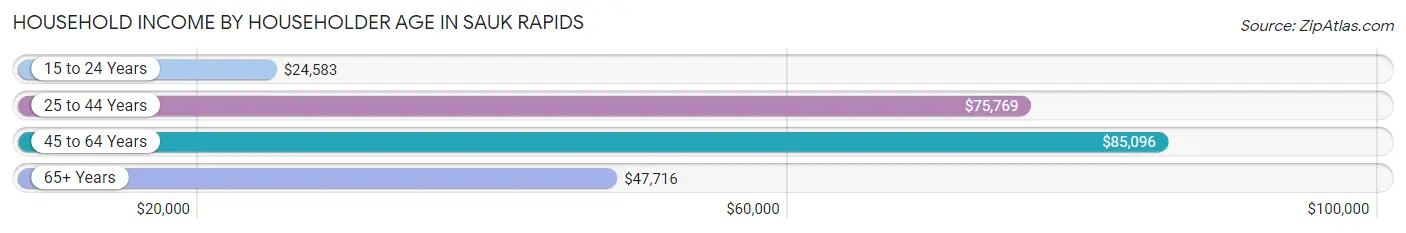
| Income Bracket | # Households | Median Income |
| 15 to 24 Years | 187 (3.5%) | $24,583 |
| 25 to 44 Years | 2,496 (46.3%) | $75,769 |
| 45 to 64 Years | 1,663 (30.9%) | $85,096 |
| 65+ Years | 1,040 (19.3%) | $47,716 |
| Total | 5,386 (100.0%) | $66,442 |
Poverty in Sauk Rapids
Income Below Poverty by Sex and Age in Sauk Rapids
With 6.6% poverty level for males and 7.7% for females among the residents of Sauk Rapids, 5 year old males and 75 year old and over females are the most vulnerable to poverty, with 19 males (22.6%) and 64 females (14.9%) in their respective age groups living below the poverty level.
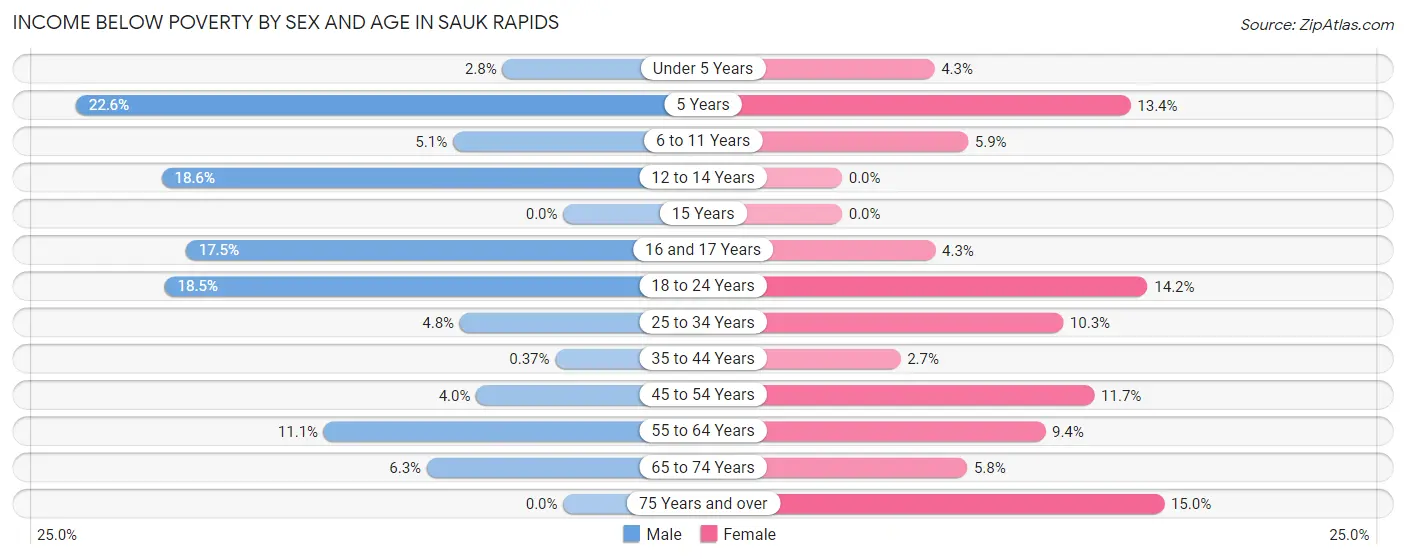
| Age Bracket | Male | Female |
| Under 5 Years | 12 (2.8%) | 18 (4.3%) |
| 5 Years | 19 (22.6%) | 15 (13.4%) |
| 6 to 11 Years | 31 (5.1%) | 40 (5.9%) |
| 12 to 14 Years | 63 (18.6%) | 0 (0.0%) |
| 15 Years | 0 (0.0%) | 0 (0.0%) |
| 16 and 17 Years | 24 (17.5%) | 12 (4.3%) |
| 18 to 24 Years | 91 (18.5%) | 78 (14.2%) |
| 25 to 34 Years | 56 (4.8%) | 103 (10.3%) |
| 35 to 44 Years | 4 (0.4%) | 30 (2.7%) |
| 45 to 54 Years | 29 (4.0%) | 93 (11.7%) |
| 55 to 64 Years | 81 (11.1%) | 48 (9.4%) |
| 65 to 74 Years | 25 (6.3%) | 28 (5.8%) |
| 75 Years and over | 0 (0.0%) | 64 (14.9%) |
| Total | 435 (6.6%) | 529 (7.7%) |
Income Above Poverty by Sex and Age in Sauk Rapids
According to the poverty statistics in Sauk Rapids, males aged 15 years and females aged 12 to 14 years are the age groups that are most secure financially, with 100.0% of males and 100.0% of females in these age groups living above the poverty line.
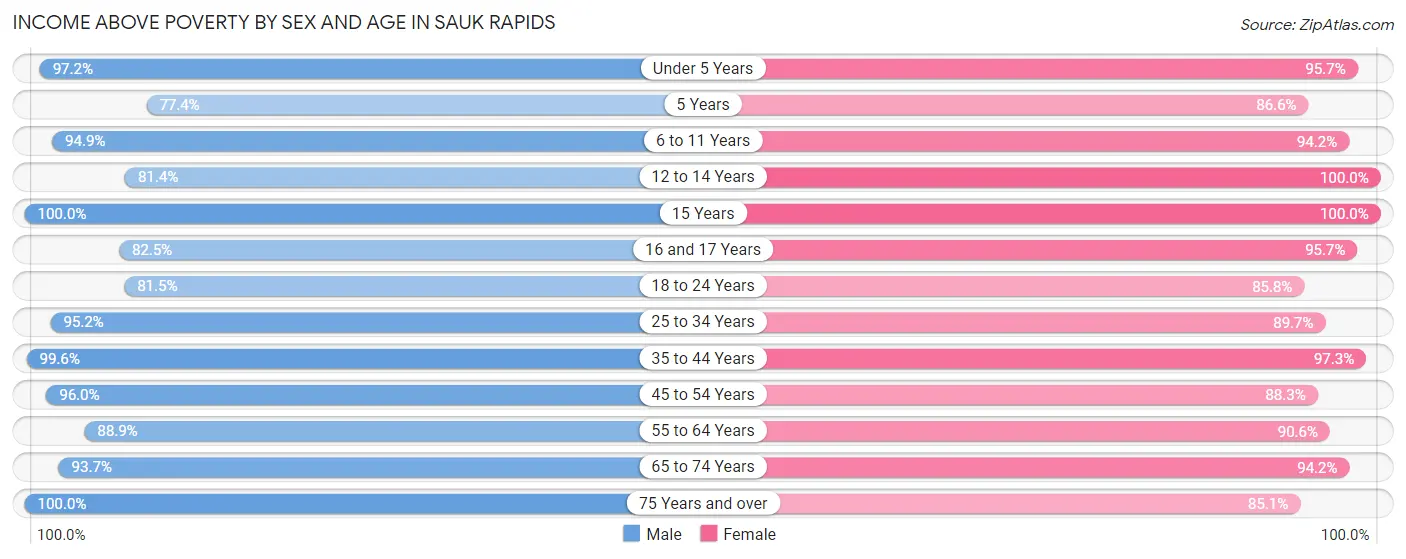
| Age Bracket | Male | Female |
| Under 5 Years | 414 (97.2%) | 402 (95.7%) |
| 5 Years | 65 (77.4%) | 97 (86.6%) |
| 6 to 11 Years | 574 (94.9%) | 644 (94.2%) |
| 12 to 14 Years | 275 (81.4%) | 399 (100.0%) |
| 15 Years | 143 (100.0%) | 92 (100.0%) |
| 16 and 17 Years | 113 (82.5%) | 265 (95.7%) |
| 18 to 24 Years | 401 (81.5%) | 472 (85.8%) |
| 25 to 34 Years | 1,111 (95.2%) | 901 (89.7%) |
| 35 to 44 Years | 1,084 (99.6%) | 1,079 (97.3%) |
| 45 to 54 Years | 688 (96.0%) | 701 (88.3%) |
| 55 to 64 Years | 648 (88.9%) | 461 (90.6%) |
| 65 to 74 Years | 370 (93.7%) | 454 (94.2%) |
| 75 Years and over | 296 (100.0%) | 364 (85.1%) |
| Total | 6,182 (93.4%) | 6,331 (92.3%) |
Income Below Poverty Among Married-Couple Families in Sauk Rapids
The poverty statistics for married-couple families in Sauk Rapids show that 0.7% or 16 of the total 2,348 families live below the poverty line. Families with 5 or more children have the highest poverty rate of 57.1%, comprising of 16 families. On the other hand, families with no children have the lowest poverty rate of 0.0%, which includes 0 families.
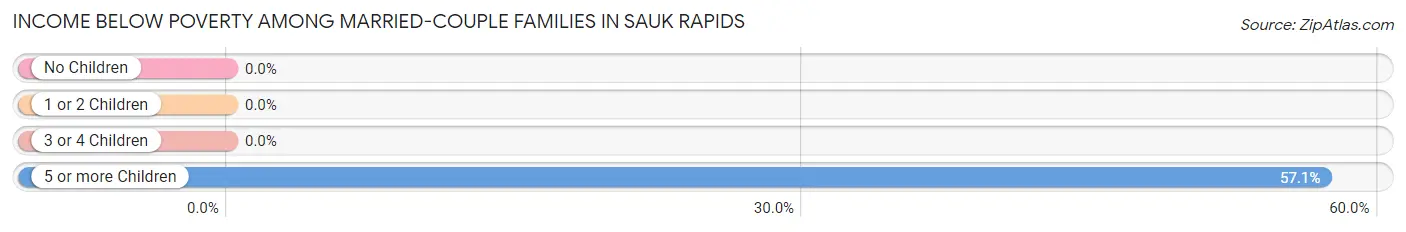
| Children | Above Poverty | Below Poverty |
| No Children | 1,221 (100.0%) | 0 (0.0%) |
| 1 or 2 Children | 877 (100.0%) | 0 (0.0%) |
| 3 or 4 Children | 222 (100.0%) | 0 (0.0%) |
| 5 or more Children | 12 (42.9%) | 16 (57.1%) |
| Total | 2,332 (99.3%) | 16 (0.7%) |
Income Below Poverty Among Single-Parent Households in Sauk Rapids
According to the poverty data in Sauk Rapids, 9.2% or 43 single-father households and 4.6% or 19 single-mother households are living below the poverty line. Among single-father households, those with 1 or 2 children have the highest poverty rate, with 43 households (14.7%) experiencing poverty. Likewise, among single-mother households, those with 3 or 4 children have the highest poverty rate, with 19 households (28.8%) falling below the poverty line.
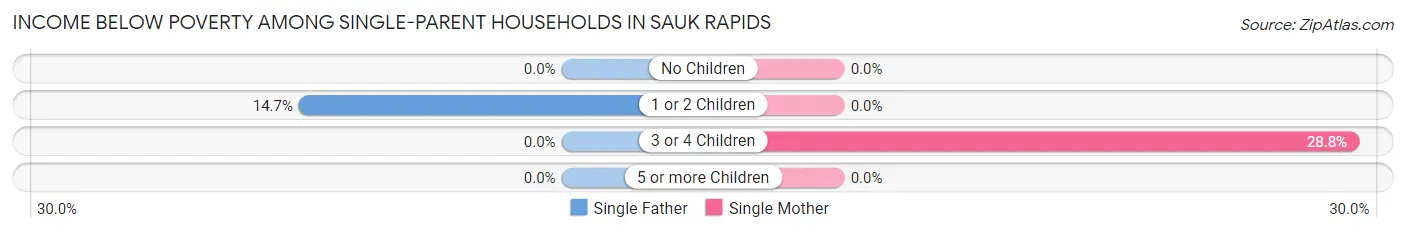
| Children | Single Father | Single Mother |
| No Children | 0 (0.0%) | 0 (0.0%) |
| 1 or 2 Children | 43 (14.7%) | 0 (0.0%) |
| 3 or 4 Children | 0 (0.0%) | 19 (28.8%) |
| 5 or more Children | 0 (0.0%) | 0 (0.0%) |
| Total | 43 (9.2%) | 19 (4.6%) |
Income Below Poverty Among Married-Couple vs Single-Parent Households in Sauk Rapids
The poverty data for Sauk Rapids shows that 16 of the married-couple family households (0.7%) and 62 of the single-parent households (7.1%) are living below the poverty level. Within the married-couple family households, those with 5 or more children have the highest poverty rate, with 16 households (57.1%) falling below the poverty line. Among the single-parent households, those with 3 or 4 children have the highest poverty rate, with 19 household (19.8%) living below poverty.
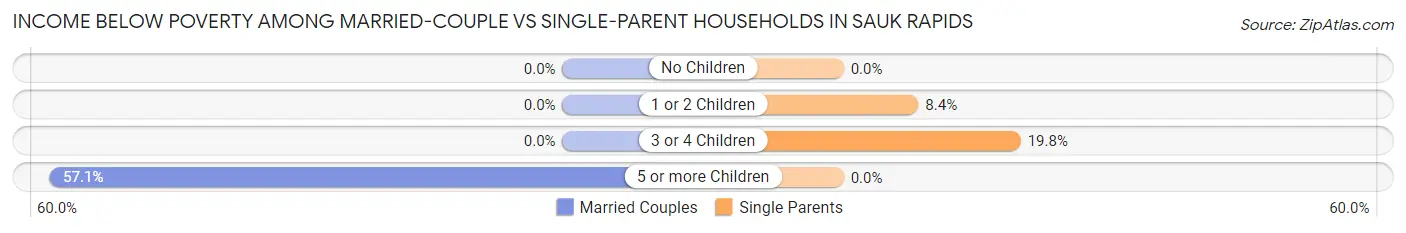
| Children | Married-Couple Families | Single-Parent Households |
| No Children | 0 (0.0%) | 0 (0.0%) |
| 1 or 2 Children | 0 (0.0%) | 43 (8.4%) |
| 3 or 4 Children | 0 (0.0%) | 19 (19.8%) |
| 5 or more Children | 16 (57.1%) | 0 (0.0%) |
| Total | 16 (0.7%) | 62 (7.1%) |
Race in Sauk Rapids
The most populous races in Sauk Rapids are White / Caucasian (12,528 | 90.6%), Two or more Races (533 | 3.8%), and Hispanic or Latino (531 | 3.8%).
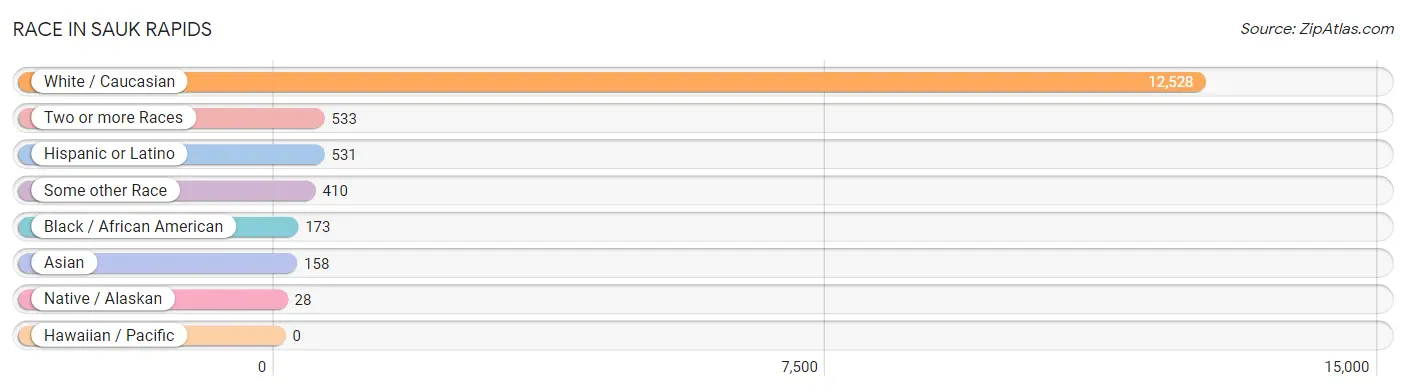
| Race | # Population | % Population |
| Asian | 158 | 1.1% |
| Black / African American | 173 | 1.3% |
| Hawaiian / Pacific | 0 | 0.0% |
| Hispanic or Latino | 531 | 3.8% |
| Native / Alaskan | 28 | 0.2% |
| White / Caucasian | 12,528 | 90.6% |
| Two or more Races | 533 | 3.8% |
| Some other Race | 410 | 3.0% |
| Total | 13,830 | 100.0% |
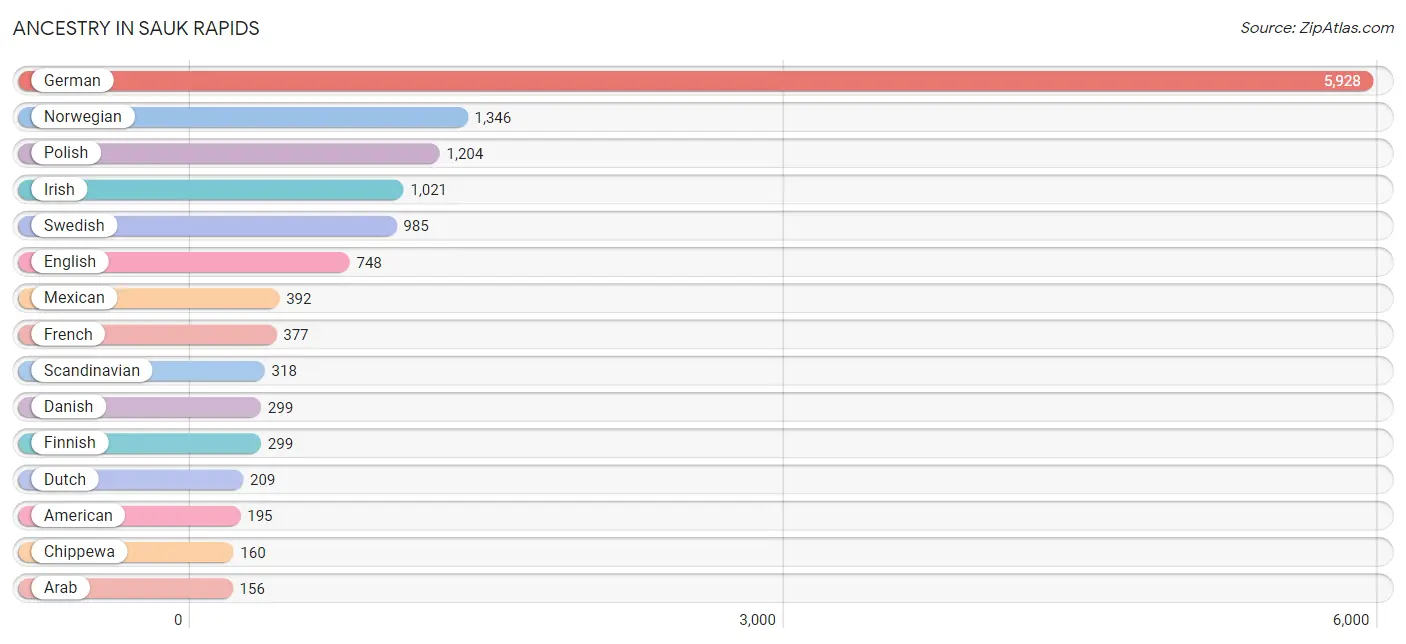
Ancestry in Sauk Rapids
The most populous ancestries reported in Sauk Rapids are German (5,928 | 42.9%), Norwegian (1,346 | 9.7%), Polish (1,204 | 8.7%), Irish (1,021 | 7.4%), and Swedish (985 | 7.1%), together accounting for 75.8% of all Sauk Rapids residents.
| Ancestry | # Population | % Population |
| African | 15 | 0.1% |
| American | 195 | 1.4% |
| Arab | 156 | 1.1% |
| Armenian | 36 | 0.3% |
| Austrian | 16 | 0.1% |
| Belgian | 16 | 0.1% |
| British | 10 | 0.1% |
| Burmese | 38 | 0.3% |
| Central American | 35 | 0.3% |
| Cherokee | 67 | 0.5% |
| Chippewa | 160 | 1.2% |
| Croatian | 26 | 0.2% |
| Cuban | 14 | 0.1% |
| Czech | 137 | 1.0% |
| Danish | 299 | 2.2% |
| Dutch | 209 | 1.5% |
| English | 748 | 5.4% |
| European | 147 | 1.1% |
| Finnish | 299 | 2.2% |
| French | 377 | 2.7% |
| French Canadian | 49 | 0.4% |
| German | 5,928 | 42.9% |
| Guatemalan | 25 | 0.2% |
| Hungarian | 48 | 0.4% |
| Indian (Asian) | 32 | 0.2% |
| Iraqi | 118 | 0.9% |
| Irish | 1,021 | 7.4% |
| Italian | 150 | 1.1% |
| Korean | 75 | 0.5% |
| Laotian | 67 | 0.5% |
| Malaysian | 40 | 0.3% |
| Mexican | 392 | 2.8% |
| Native Hawaiian | 30 | 0.2% |
| Navajo | 1 | 0.0% |
| Nigerian | 50 | 0.4% |
| Norwegian | 1,346 | 9.7% |
| Paraguayan | 10 | 0.1% |
| Polish | 1,204 | 8.7% |
| Portuguese | 57 | 0.4% |
| Puerto Rican | 41 | 0.3% |
| Russian | 92 | 0.7% |
| Salvadoran | 10 | 0.1% |
| Scandinavian | 318 | 2.3% |
| Scotch-Irish | 25 | 0.2% |
| Scottish | 115 | 0.8% |
| Serbian | 9 | 0.1% |
| Sioux | 2 | 0.0% |
| Slovak | 12 | 0.1% |
| Slovene | 39 | 0.3% |
| Somali | 17 | 0.1% |
| South American | 49 | 0.4% |
| Sri Lankan | 67 | 0.5% |
| Subsaharan African | 82 | 0.6% |
| Swedish | 985 | 7.1% |
| Swiss | 51 | 0.4% | View All 55 Rows |
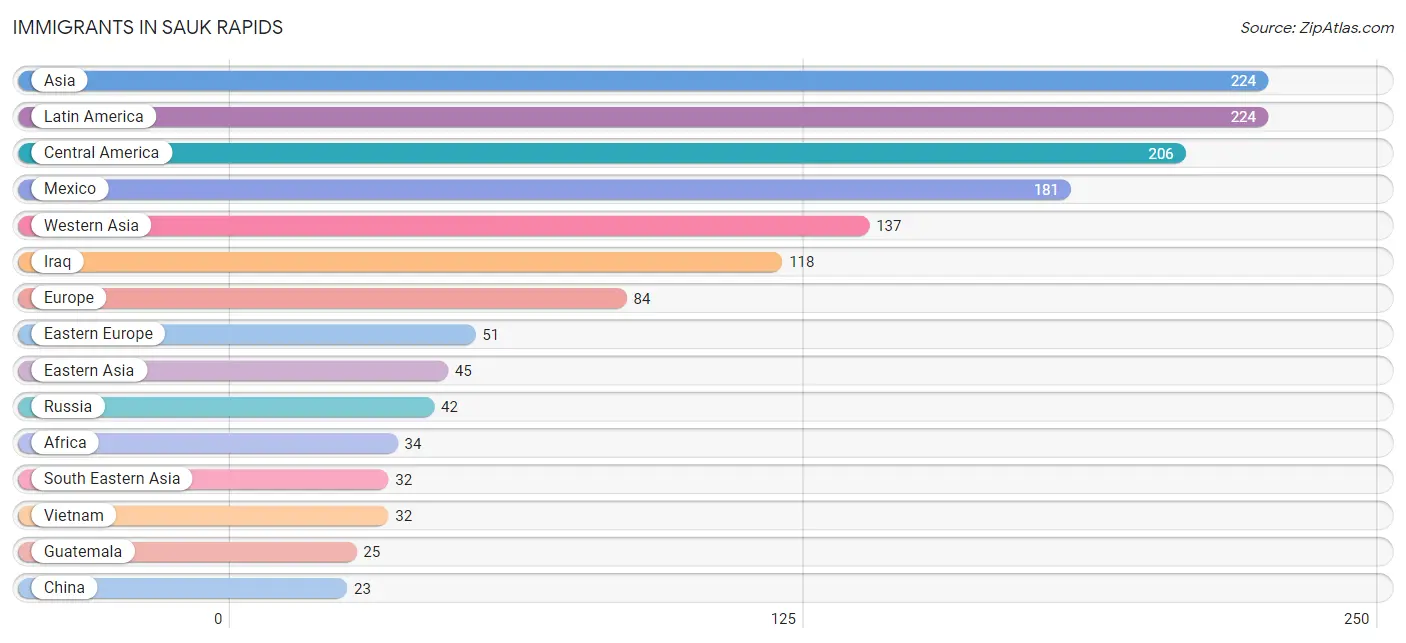
Immigrants in Sauk Rapids
The most numerous immigrant groups reported in Sauk Rapids came from Asia (224 | 1.6%), Latin America (224 | 1.6%), Central America (206 | 1.5%), Mexico (181 | 1.3%), and Western Asia (137 | 1.0%), together accounting for 7.0% of all Sauk Rapids residents.
| Immigration Origin | # Population | % Population |
| Africa | 34 | 0.3% |
| Asia | 224 | 1.6% |
| Brazil | 18 | 0.1% |
| Canada | 10 | 0.1% |
| Central America | 206 | 1.5% |
| China | 23 | 0.2% |
| Denmark | 3 | 0.0% |
| Eastern Africa | 17 | 0.1% |
| Eastern Asia | 45 | 0.3% |
| Eastern Europe | 51 | 0.4% |
| Europe | 84 | 0.6% |
| Germany | 20 | 0.1% |
| Guatemala | 25 | 0.2% |
| Iraq | 118 | 0.9% |
| Ireland | 10 | 0.1% |
| Kazakhstan | 10 | 0.1% |
| Korea | 22 | 0.2% |
| Latin America | 224 | 1.6% |
| Lebanon | 19 | 0.1% |
| Mexico | 181 | 1.3% |
| Nigeria | 17 | 0.1% |
| Northern Europe | 13 | 0.1% |
| Russia | 42 | 0.3% |
| Serbia | 9 | 0.1% |
| Somalia | 17 | 0.1% |
| South America | 18 | 0.1% |
| South Central Asia | 10 | 0.1% |
| South Eastern Asia | 32 | 0.2% |
| Vietnam | 32 | 0.2% |
| Western Africa | 17 | 0.1% |
| Western Asia | 137 | 1.0% |
| Western Europe | 20 | 0.1% | View All 32 Rows |
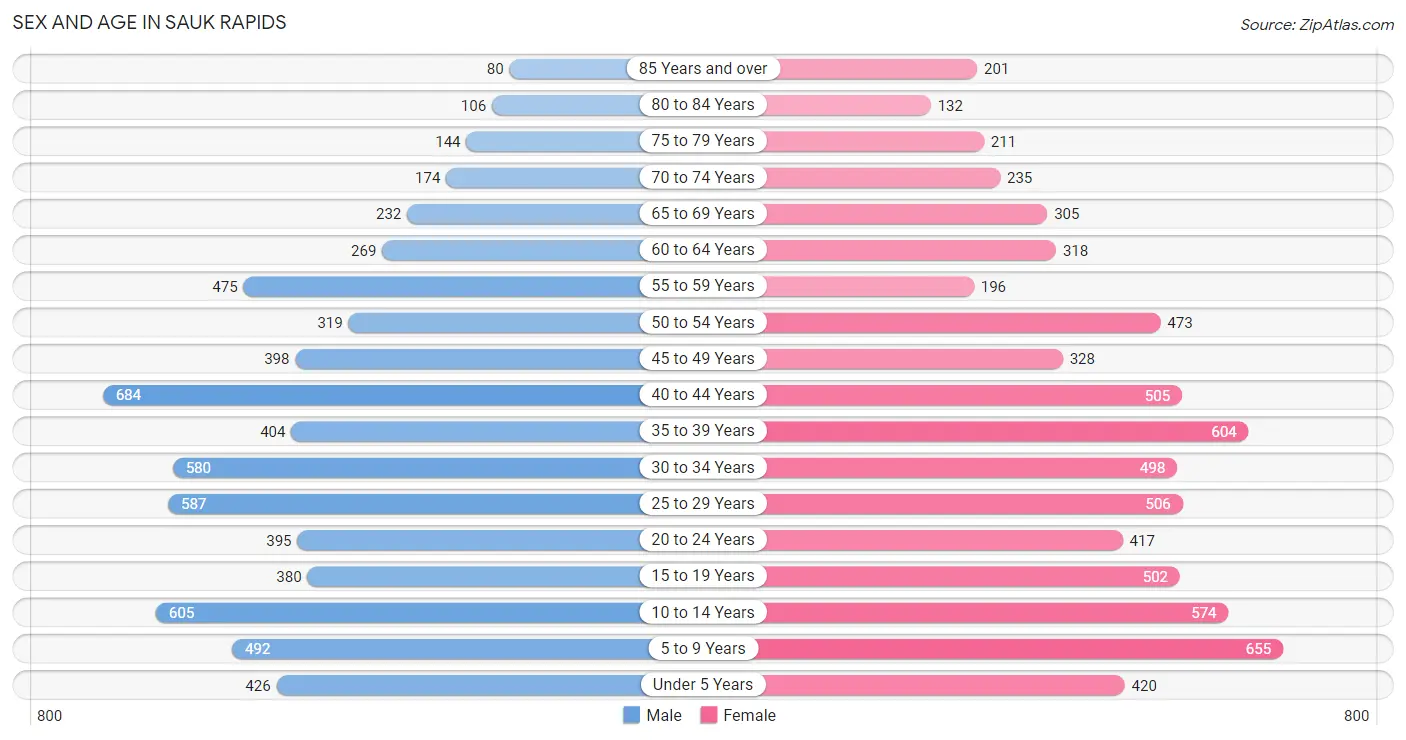
Sex and Age in Sauk Rapids
Sex and Age in Sauk Rapids
The most populous age groups in Sauk Rapids are 40 to 44 Years (684 | 10.1%) for men and 5 to 9 Years (655 | 9.2%) for women.
| Age Bracket | Male | Female |
| Under 5 Years | 426 (6.3%) | 420 (5.9%) |
| 5 to 9 Years | 492 (7.3%) | 655 (9.2%) |
| 10 to 14 Years | 605 (9.0%) | 574 (8.1%) |
| 15 to 19 Years | 380 (5.6%) | 502 (7.1%) |
| 20 to 24 Years | 395 (5.9%) | 417 (5.9%) |
| 25 to 29 Years | 587 (8.7%) | 506 (7.1%) |
| 30 to 34 Years | 580 (8.6%) | 498 (7.0%) |
| 35 to 39 Years | 404 (6.0%) | 604 (8.5%) |
| 40 to 44 Years | 684 (10.1%) | 505 (7.1%) |
| 45 to 49 Years | 398 (5.9%) | 328 (4.6%) |
| 50 to 54 Years | 319 (4.7%) | 473 (6.7%) |
| 55 to 59 Years | 475 (7.0%) | 196 (2.8%) |
| 60 to 64 Years | 269 (4.0%) | 318 (4.5%) |
| 65 to 69 Years | 232 (3.4%) | 305 (4.3%) |
| 70 to 74 Years | 174 (2.6%) | 235 (3.3%) |
| 75 to 79 Years | 144 (2.1%) | 211 (3.0%) |
| 80 to 84 Years | 106 (1.6%) | 132 (1.9%) |
| 85 Years and over | 80 (1.2%) | 201 (2.8%) |
| Total | 6,750 (100.0%) | 7,080 (100.0%) |
Families and Households in Sauk Rapids
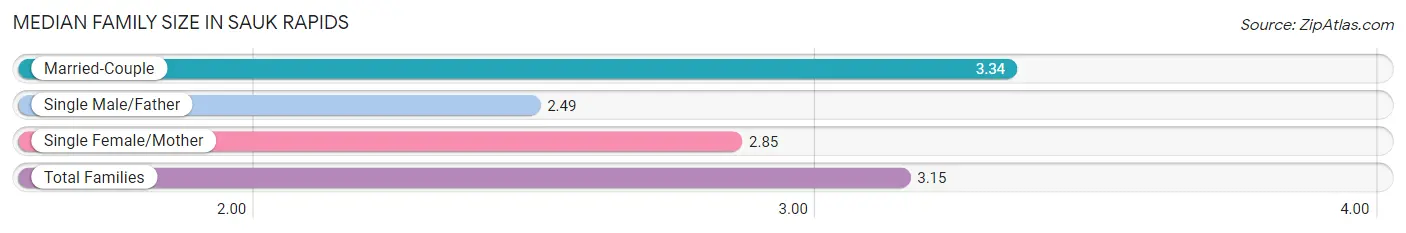
Median Family Size in Sauk Rapids
The median family size in Sauk Rapids is 3.15 persons per family, with married-couple families (2,348 | 72.8%) accounting for the largest median family size of 3.34 persons per family. On the other hand, single male/father families (466 | 14.4%) represent the smallest median family size with 2.49 persons per family.
| Family Type | # Families | Family Size |
| Married-Couple | 2,348 (72.8%) | 3.34 |
| Single Male/Father | 466 (14.4%) | 2.49 |
| Single Female/Mother | 412 (12.8%) | 2.85 |
| Total Families | 3,226 (100.0%) | 3.15 |
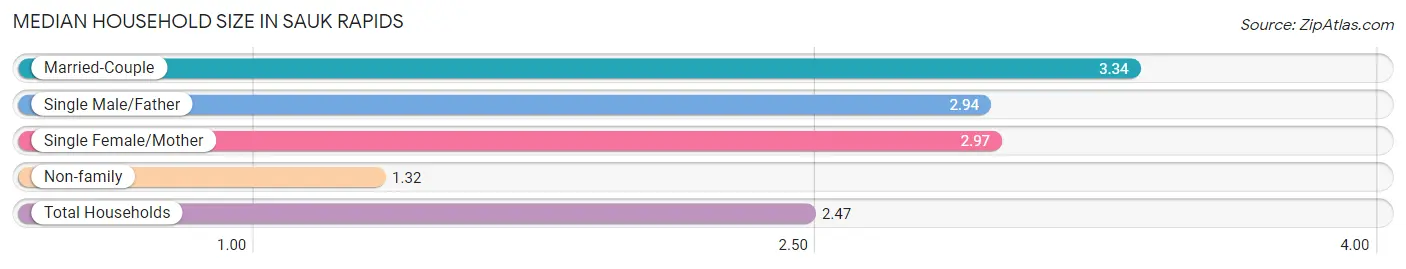
Median Household Size in Sauk Rapids
The median household size in Sauk Rapids is 2.47 persons per household, with married-couple households (2,348 | 43.6%) accounting for the largest median household size of 3.34 persons per household. non-family households (2,160 | 40.1%) represent the smallest median household size with 1.32 persons per household.
| Household Type | # Households | Household Size |
| Married-Couple | 2,348 (43.6%) | 3.34 |
| Single Male/Father | 466 (8.6%) | 2.94 |
| Single Female/Mother | 412 (7.6%) | 2.97 |
| Non-family | 2,160 (40.1%) | 1.32 |
| Total Households | 5,386 (100.0%) | 2.47 |
Household Size by Marriage Status in Sauk Rapids
Out of a total of 5,386 households in Sauk Rapids, 3,226 (59.9%) are family households, while 2,160 (40.1%) are nonfamily households. The most numerous type of family households are 2-person households, comprising 1,372, and the most common type of nonfamily households are 1-person households, comprising 1,681.
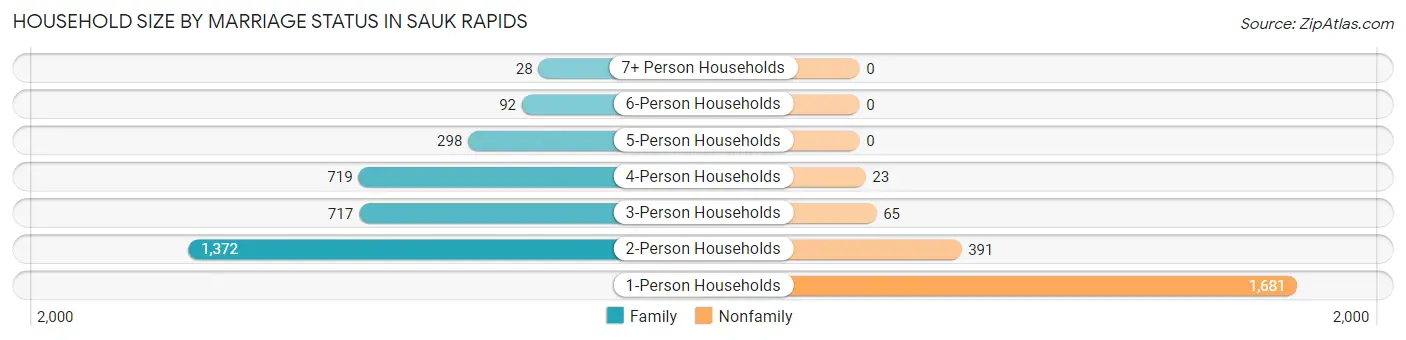
| Household Size | Family Households | Nonfamily Households |
| 1-Person Households | - | 1,681 (31.2%) |
| 2-Person Households | 1,372 (25.5%) | 391 (7.3%) |
| 3-Person Households | 717 (13.3%) | 65 (1.2%) |
| 4-Person Households | 719 (13.4%) | 23 (0.4%) |
| 5-Person Households | 298 (5.5%) | 0 (0.0%) |
| 6-Person Households | 92 (1.7%) | 0 (0.0%) |
| 7+ Person Households | 28 (0.5%) | 0 (0.0%) |
| Total | 3,226 (59.9%) | 2,160 (40.1%) |
Female Fertility in Sauk Rapids
Fertility by Age in Sauk Rapids
Average fertility rate in Sauk Rapids is 33.0 births per 1,000 women. Women in the age bracket of 20 to 34 years have the highest fertility rate with 79.0 births per 1,000 women. Women in the age bracket of 20 to 34 years acount for 100.0% of all women with births.
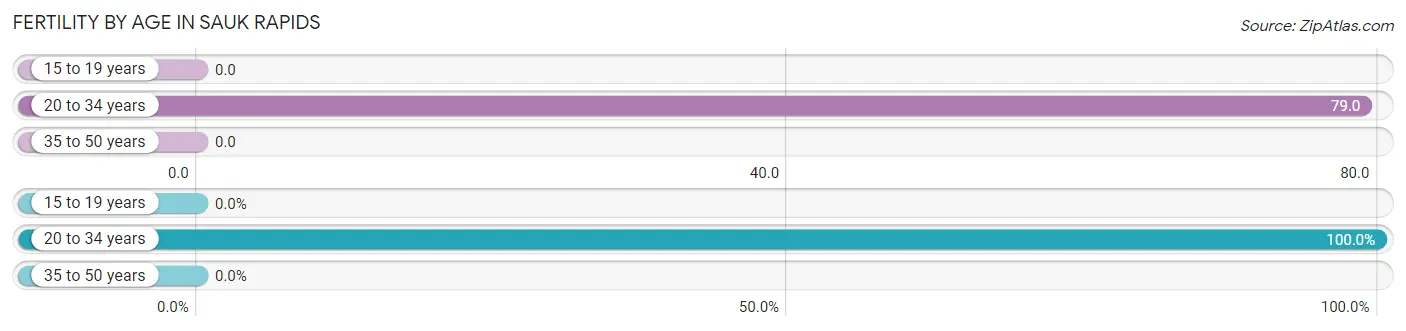
| Age Bracket | Women with Births | Births / 1,000 Women |
| 15 to 19 years | 0 (0.0%) | 0.0 |
| 20 to 34 years | 112 (100.0%) | 79.0 |
| 35 to 50 years | 0 (0.0%) | 0.0 |
| Total | 112 (100.0%) | 33.0 |
Fertility by Age by Marriage Status in Sauk Rapids
81.2% of women with births (112) in Sauk Rapids are married. The highest percentage of unmarried women with births falls into 20 to 34 years age bracket with 18.8% of them unmarried at the time of birth, while the lowest percentage of unmarried women with births belong to 20 to 34 years age bracket with 18.8% of them unmarried.
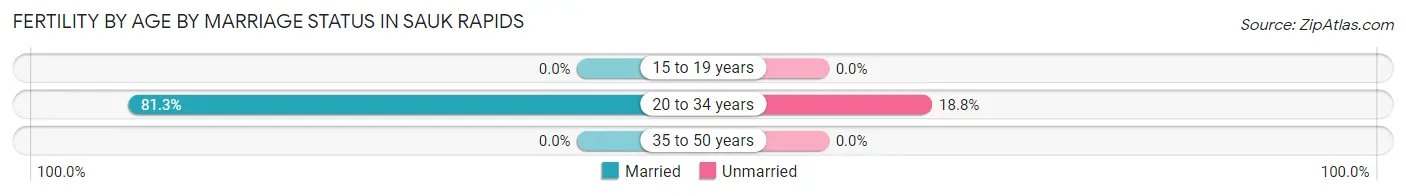
| Age Bracket | Married | Unmarried |
| 15 to 19 years | 0 (0.0%) | 0 (0.0%) |
| 20 to 34 years | 91 (81.2%) | 21 (18.8%) |
| 35 to 50 years | 0 (0.0%) | 0 (0.0%) |
| Total | 91 (81.2%) | 21 (18.8%) |
Fertility by Education in Sauk Rapids
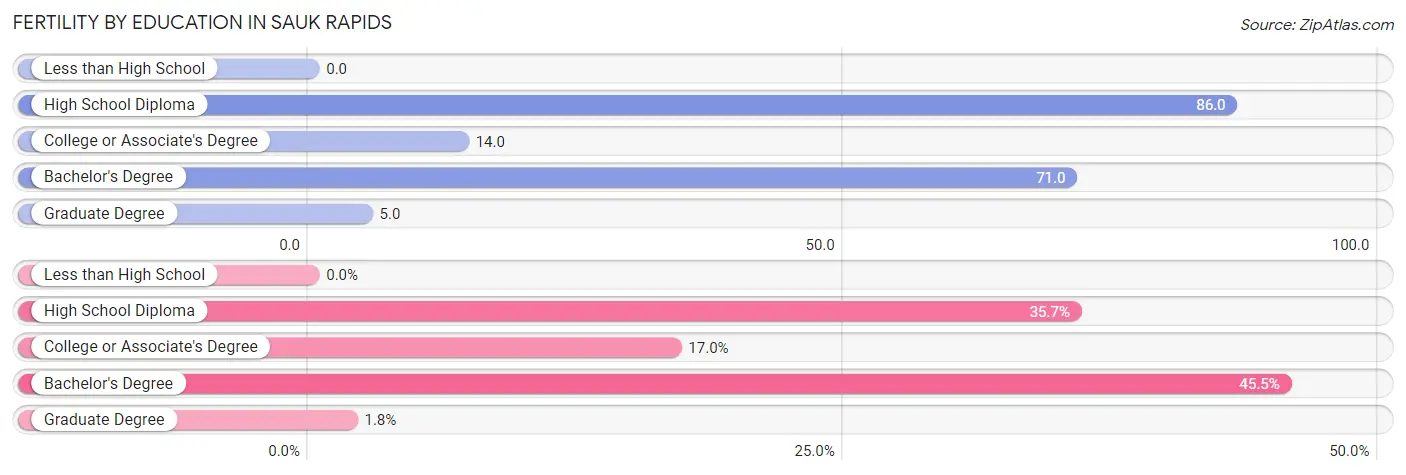
| Educational Attainment | Women with Births | Births / 1,000 Women |
| Less than High School | 0 (0.0%) | 0.0 |
| High School Diploma | 40 (35.7%) | 86.0 |
| College or Associate's Degree | 19 (17.0%) | 14.0 |
| Bachelor's Degree | 51 (45.5%) | 71.0 |
| Graduate Degree | 2 (1.8%) | 5.0 |
| Total | 112 (100.0%) | 33.0 |
Fertility by Education by Marriage Status in Sauk Rapids
18.8% of women with births in Sauk Rapids are unmarried. Women with the educational attainment of college or associate's degree are most likely to be married with 100.0% of them married at childbirth, while women with the educational attainment of graduate degree are least likely to be married with 100.0% of them unmarried at childbirth.
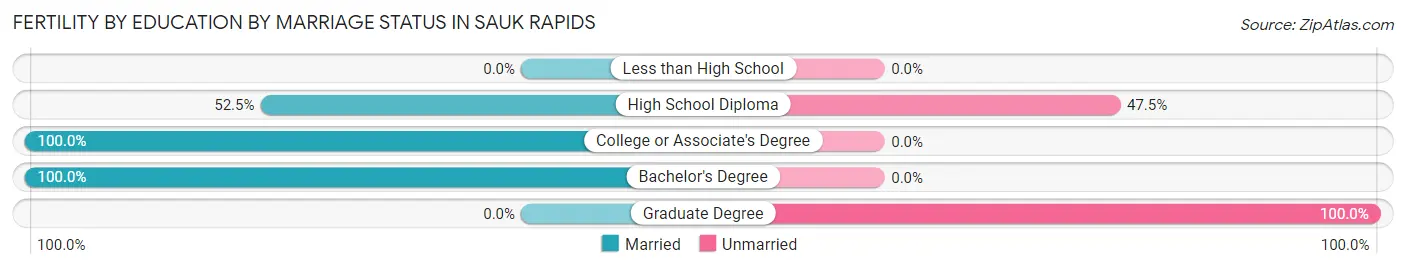
| Educational Attainment | Married | Unmarried |
| Less than High School | 0 (0.0%) | 0 (0.0%) |
| High School Diploma | 21 (52.5%) | 19 (47.5%) |
| College or Associate's Degree | 19 (100.0%) | 0 (0.0%) |
| Bachelor's Degree | 51 (100.0%) | 0 (0.0%) |
| Graduate Degree | 0 (0.0%) | 2 (100.0%) |
| Total | 91 (81.2%) | 21 (18.8%) |
Employment Characteristics in Sauk Rapids
Employment by Class of Employer in Sauk Rapids
Among the 7,321 employed individuals in Sauk Rapids, private company employees (4,806 | 65.6%), not-for-profit organizations (959 | 13.1%), and local government employees (510 | 7.0%) make up the most common classes of employment.
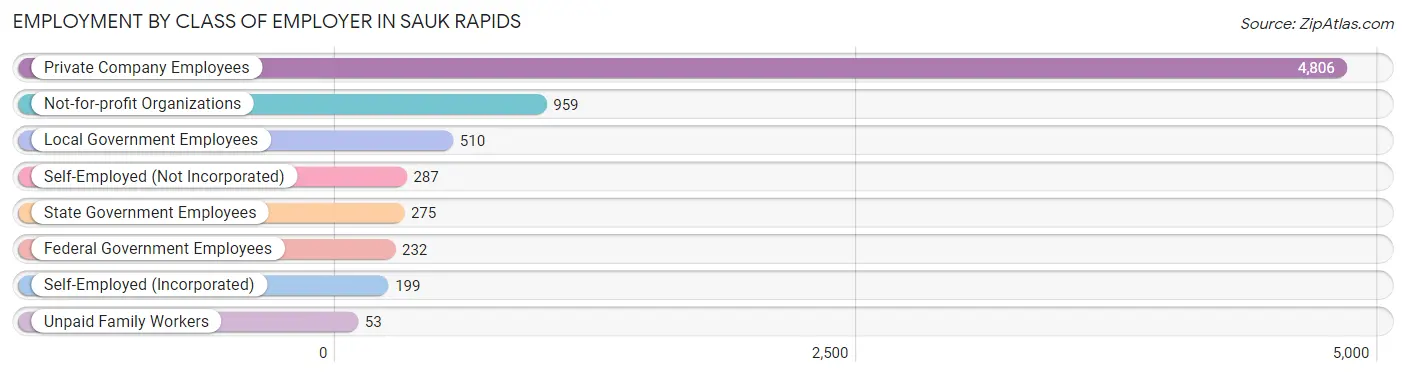
| Employer Class | # Employees | % Employees |
| Private Company Employees | 4,806 | 65.6% |
| Self-Employed (Incorporated) | 199 | 2.7% |
| Self-Employed (Not Incorporated) | 287 | 3.9% |
| Not-for-profit Organizations | 959 | 13.1% |
| Local Government Employees | 510 | 7.0% |
| State Government Employees | 275 | 3.8% |
| Federal Government Employees | 232 | 3.2% |
| Unpaid Family Workers | 53 | 0.7% |
| Total | 7,321 | 100.0% |
Employment Status by Age in Sauk Rapids
According to the labor force statistics for Sauk Rapids, out of the total population over 16 years of age (10,421), 73.5% or 7,659 individuals are in the labor force, with 2.9% or 222 of them unemployed. The age group with the highest labor force participation rate is 35 to 44 years, with 93.6% or 2,056 individuals in the labor force. Within the labor force, the 25 to 29 years age range has the highest percentage of unemployed individuals, with 5.2% or 51 of them being unemployed.
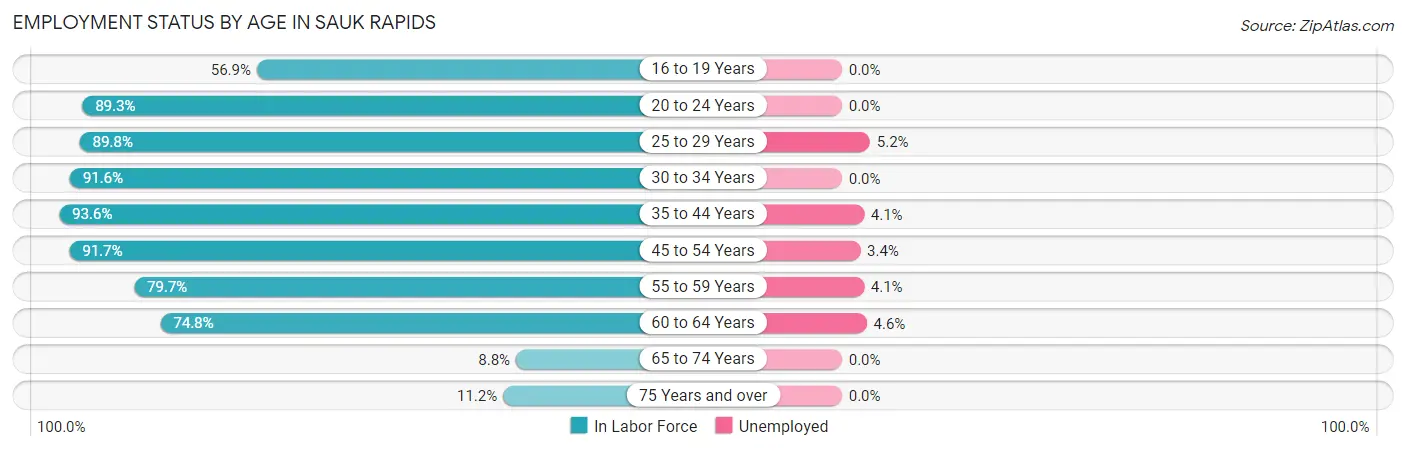
| Age Bracket | In Labor Force | Unemployed |
| 16 to 19 Years | 367 (56.9%) | 0 (0.0%) |
| 20 to 24 Years | 725 (89.3%) | 0 (0.0%) |
| 25 to 29 Years | 982 (89.8%) | 51 (5.2%) |
| 30 to 34 Years | 987 (91.6%) | 0 (0.0%) |
| 35 to 44 Years | 2,056 (93.6%) | 84 (4.1%) |
| 45 to 54 Years | 1,392 (91.7%) | 47 (3.4%) |
| 55 to 59 Years | 535 (79.7%) | 22 (4.1%) |
| 60 to 64 Years | 439 (74.8%) | 20 (4.6%) |
| 65 to 74 Years | 83 (8.8%) | 0 (0.0%) |
| 75 Years and over | 98 (11.2%) | 0 (0.0%) |
| Total | 7,659 (73.5%) | 222 (2.9%) |
Employment Status by Educational Attainment in Sauk Rapids
According to labor force statistics for Sauk Rapids, 89.5% of individuals (6,394) out of the total population between 25 and 64 years of age (7,144) are in the labor force, with 3.5% or 224 of them being unemployed. The group with the highest labor force participation rate are those with the educational attainment of bachelor's degree or higher, with 95.0% or 2,128 individuals in the labor force. Within the labor force, individuals with high school diploma education have the highest percentage of unemployment, with 10.0% or 129 of them being unemployed.
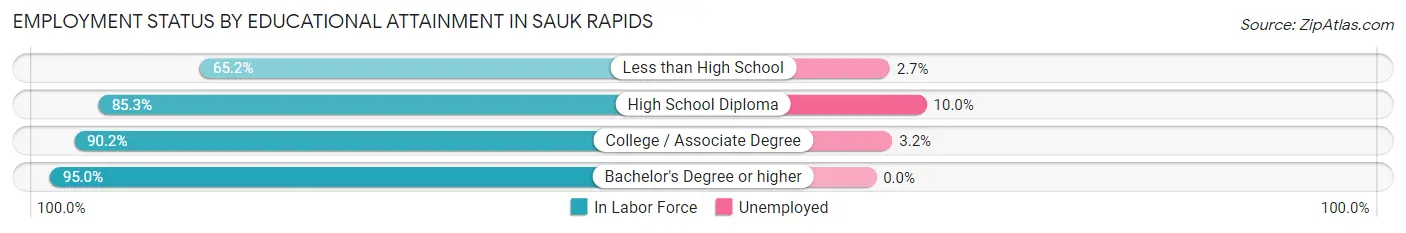
| Educational Attainment | In Labor Force | Unemployed |
| Less than High School | 225 (65.2%) | 9 (2.7%) |
| High School Diploma | 1,290 (85.3%) | 151 (10.0%) |
| College / Associate Degree | 2,748 (90.2%) | 98 (3.2%) |
| Bachelor's Degree or higher | 2,128 (95.0%) | 0 (0.0%) |
| Total | 6,394 (89.5%) | 250 (3.5%) |
Employment Occupations by Sex in Sauk Rapids
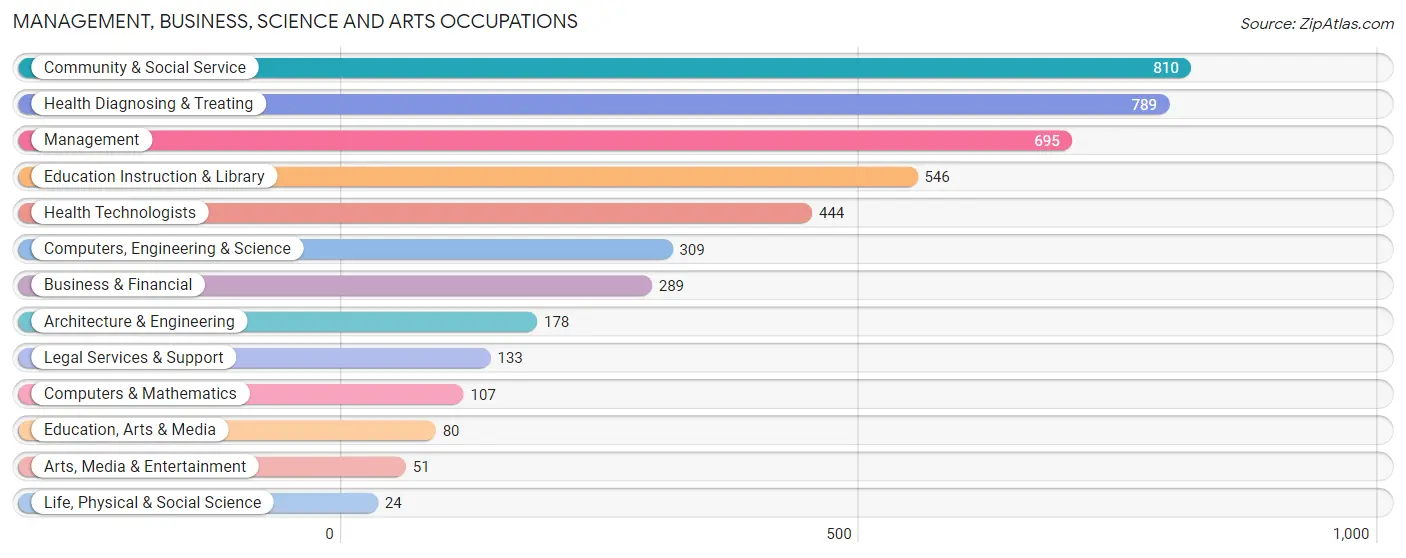
Management, Business, Science and Arts Occupations
The most common Management, Business, Science and Arts occupations in Sauk Rapids are Community & Social Service (810 | 11.0%), Health Diagnosing & Treating (789 | 10.7%), Management (695 | 9.4%), Education Instruction & Library (546 | 7.4%), and Health Technologists (444 | 6.0%).
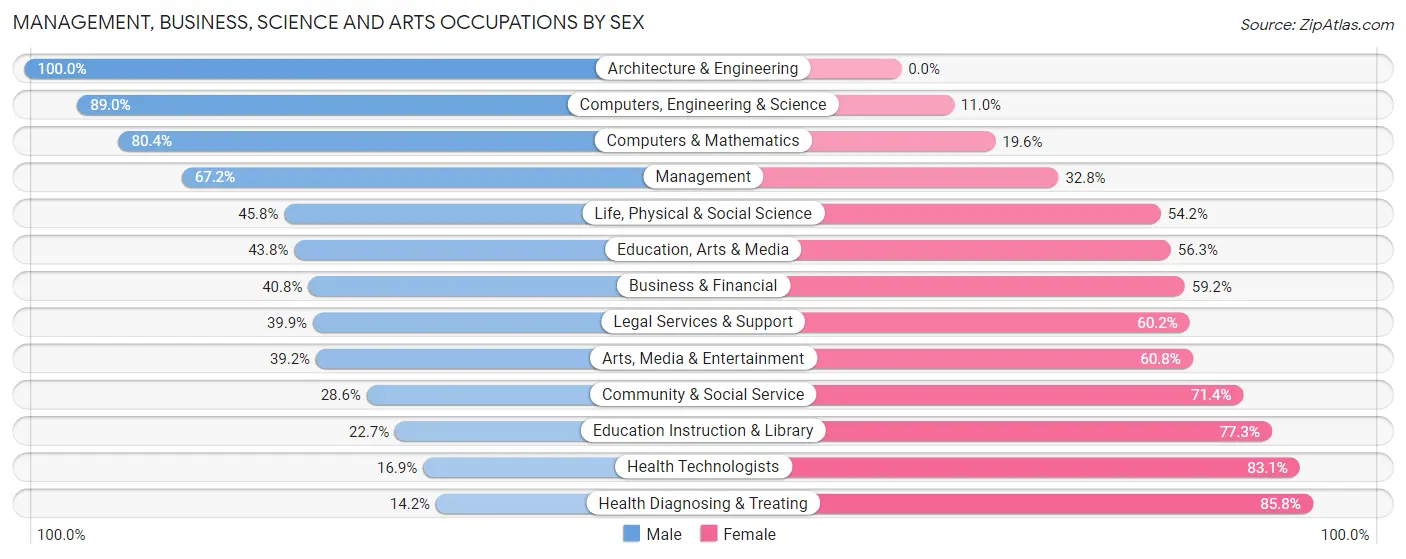
Management, Business, Science and Arts Occupations by Sex
Within the Management, Business, Science and Arts occupations in Sauk Rapids, the most male-oriented occupations are Architecture & Engineering (100.0%), Computers, Engineering & Science (89.0%), and Computers & Mathematics (80.4%), while the most female-oriented occupations are Health Diagnosing & Treating (85.8%), Health Technologists (83.1%), and Education Instruction & Library (77.3%).
| Occupation | Male | Female |
| Management | 467 (67.2%) | 228 (32.8%) |
| Business & Financial | 118 (40.8%) | 171 (59.2%) |
| Computers, Engineering & Science | 275 (89.0%) | 34 (11.0%) |
| Computers & Mathematics | 86 (80.4%) | 21 (19.6%) |
| Architecture & Engineering | 178 (100.0%) | 0 (0.0%) |
| Life, Physical & Social Science | 11 (45.8%) | 13 (54.2%) |
| Community & Social Service | 232 (28.6%) | 578 (71.4%) |
| Education, Arts & Media | 35 (43.8%) | 45 (56.2%) |
| Legal Services & Support | 53 (39.9%) | 80 (60.2%) |
| Education Instruction & Library | 124 (22.7%) | 422 (77.3%) |
| Arts, Media & Entertainment | 20 (39.2%) | 31 (60.8%) |
| Health Diagnosing & Treating | 112 (14.2%) | 677 (85.8%) |
| Health Technologists | 75 (16.9%) | 369 (83.1%) |
| Total (Category) | 1,204 (41.6%) | 1,688 (58.4%) |
| Total (Overall) | 3,712 (50.2%) | 3,682 (49.8%) |
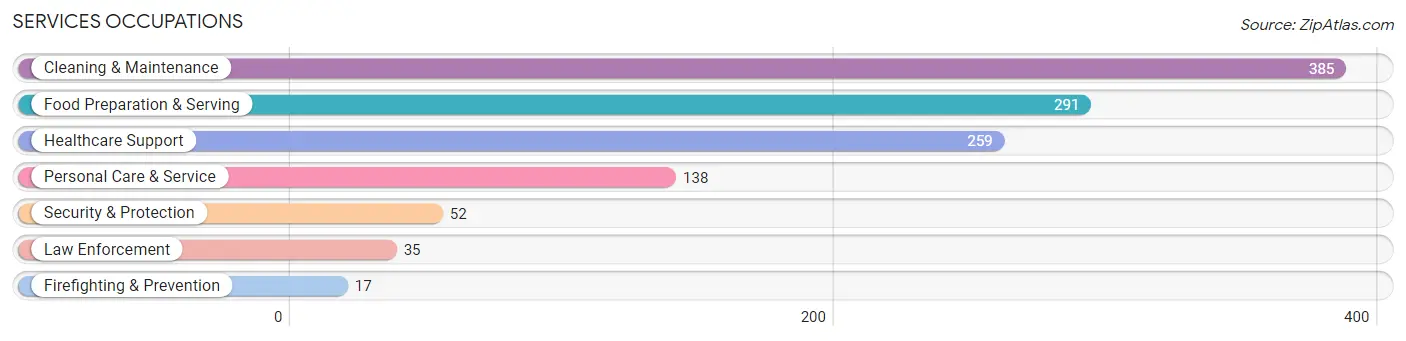
Services Occupations
The most common Services occupations in Sauk Rapids are Cleaning & Maintenance (385 | 5.2%), Food Preparation & Serving (291 | 3.9%), Healthcare Support (259 | 3.5%), Personal Care & Service (138 | 1.9%), and Security & Protection (52 | 0.7%).
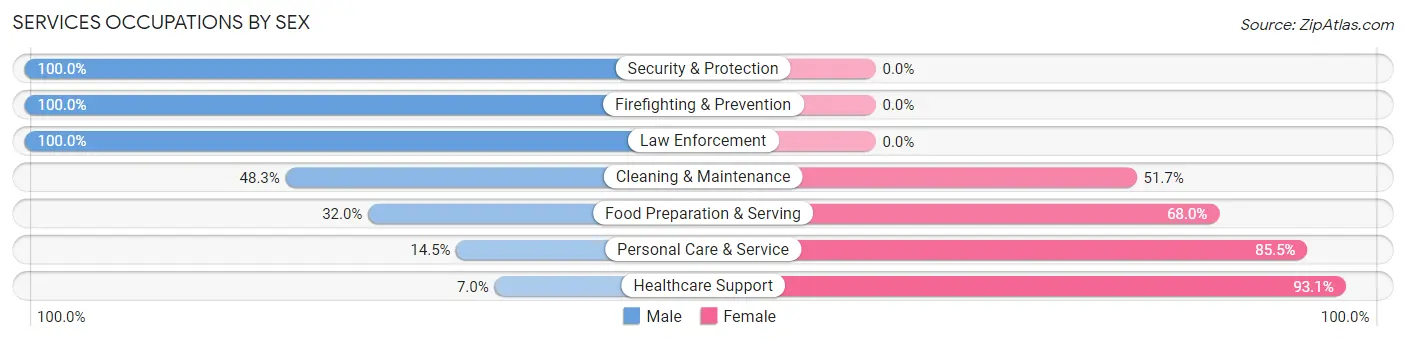
Services Occupations by Sex
Within the Services occupations in Sauk Rapids, the most male-oriented occupations are Security & Protection (100.0%), Firefighting & Prevention (100.0%), and Law Enforcement (100.0%), while the most female-oriented occupations are Healthcare Support (93.0%), Personal Care & Service (85.5%), and Food Preparation & Serving (68.0%).
| Occupation | Male | Female |
| Healthcare Support | 18 (7.0%) | 241 (93.0%) |
| Security & Protection | 52 (100.0%) | 0 (0.0%) |
| Firefighting & Prevention | 17 (100.0%) | 0 (0.0%) |
| Law Enforcement | 35 (100.0%) | 0 (0.0%) |
| Food Preparation & Serving | 93 (32.0%) | 198 (68.0%) |
| Cleaning & Maintenance | 186 (48.3%) | 199 (51.7%) |
| Personal Care & Service | 20 (14.5%) | 118 (85.5%) |
| Total (Category) | 369 (32.8%) | 756 (67.2%) |
| Total (Overall) | 3,712 (50.2%) | 3,682 (49.8%) |
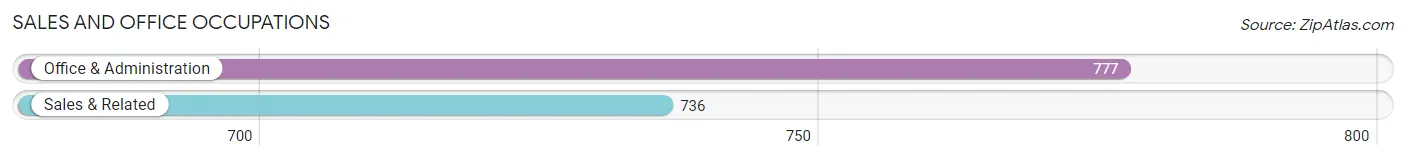
Sales and Office Occupations
The most common Sales and Office occupations in Sauk Rapids are Office & Administration (777 | 10.5%), and Sales & Related (736 | 10.0%).
Sales and Office Occupations by Sex
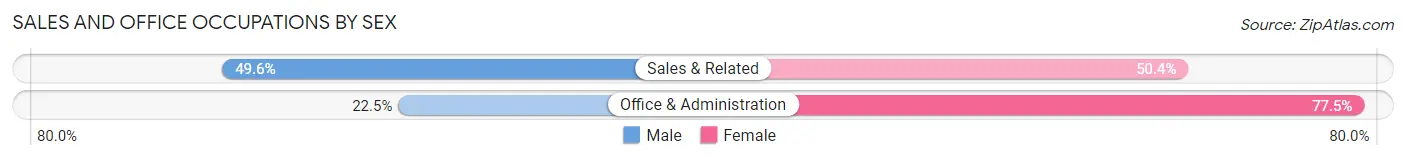
| Occupation | Male | Female |
| Sales & Related | 365 (49.6%) | 371 (50.4%) |
| Office & Administration | 175 (22.5%) | 602 (77.5%) |
| Total (Category) | 540 (35.7%) | 973 (64.3%) |
| Total (Overall) | 3,712 (50.2%) | 3,682 (49.8%) |
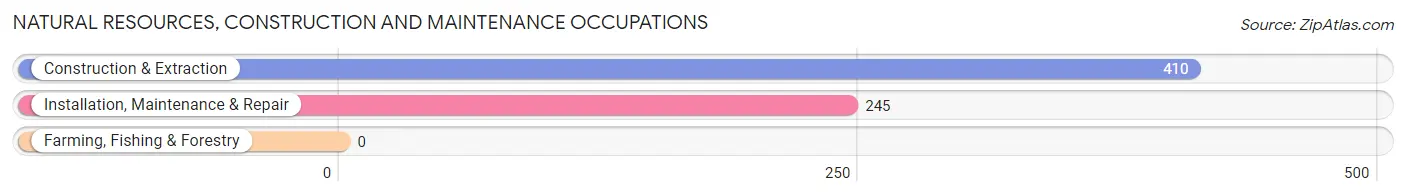
Natural Resources, Construction and Maintenance Occupations
The most common Natural Resources, Construction and Maintenance occupations in Sauk Rapids are Construction & Extraction (410 | 5.6%), and Installation, Maintenance & Repair (245 | 3.3%).
Natural Resources, Construction and Maintenance Occupations by Sex
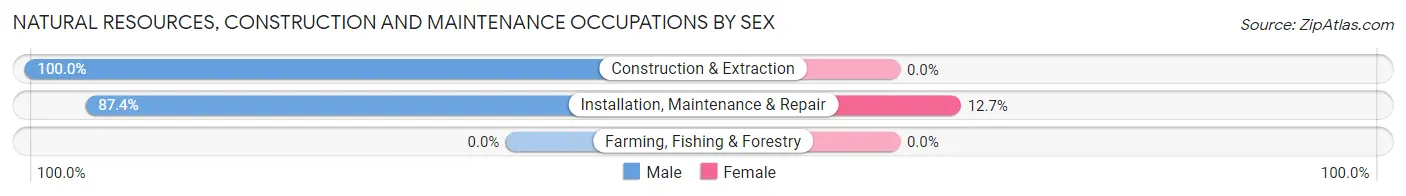
| Occupation | Male | Female |
| Farming, Fishing & Forestry | 0 (0.0%) | 0 (0.0%) |
| Construction & Extraction | 410 (100.0%) | 0 (0.0%) |
| Installation, Maintenance & Repair | 214 (87.4%) | 31 (12.7%) |
| Total (Category) | 624 (95.3%) | 31 (4.7%) |
| Total (Overall) | 3,712 (50.2%) | 3,682 (49.8%) |
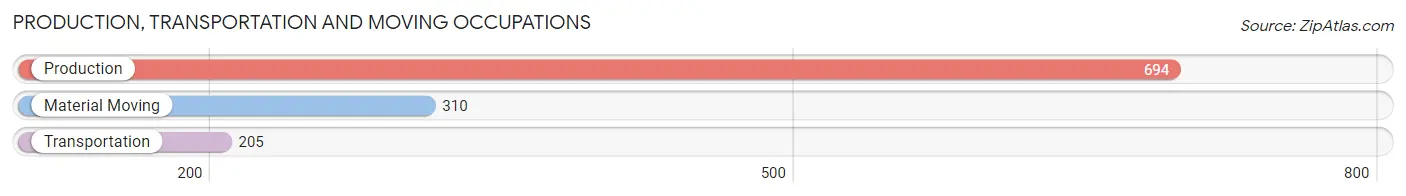
Production, Transportation and Moving Occupations
The most common Production, Transportation and Moving occupations in Sauk Rapids are Production (694 | 9.4%), Material Moving (310 | 4.2%), and Transportation (205 | 2.8%).
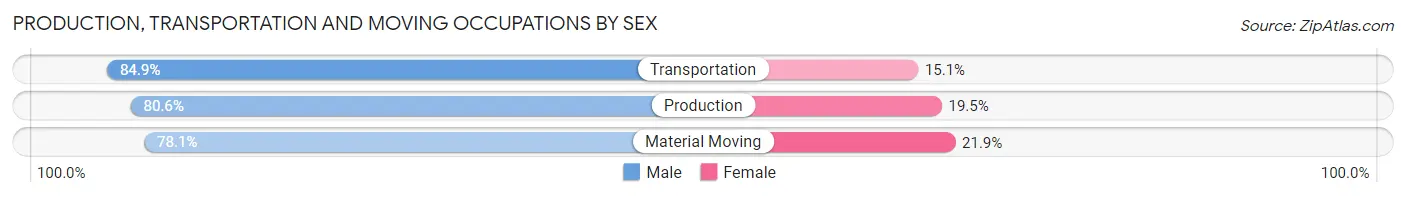
Production, Transportation and Moving Occupations by Sex
| Occupation | Male | Female |
| Production | 559 (80.5%) | 135 (19.5%) |
| Transportation | 174 (84.9%) | 31 (15.1%) |
| Material Moving | 242 (78.1%) | 68 (21.9%) |
| Total (Category) | 975 (80.6%) | 234 (19.4%) |
| Total (Overall) | 3,712 (50.2%) | 3,682 (49.8%) |
Employment Industries by Sex in Sauk Rapids
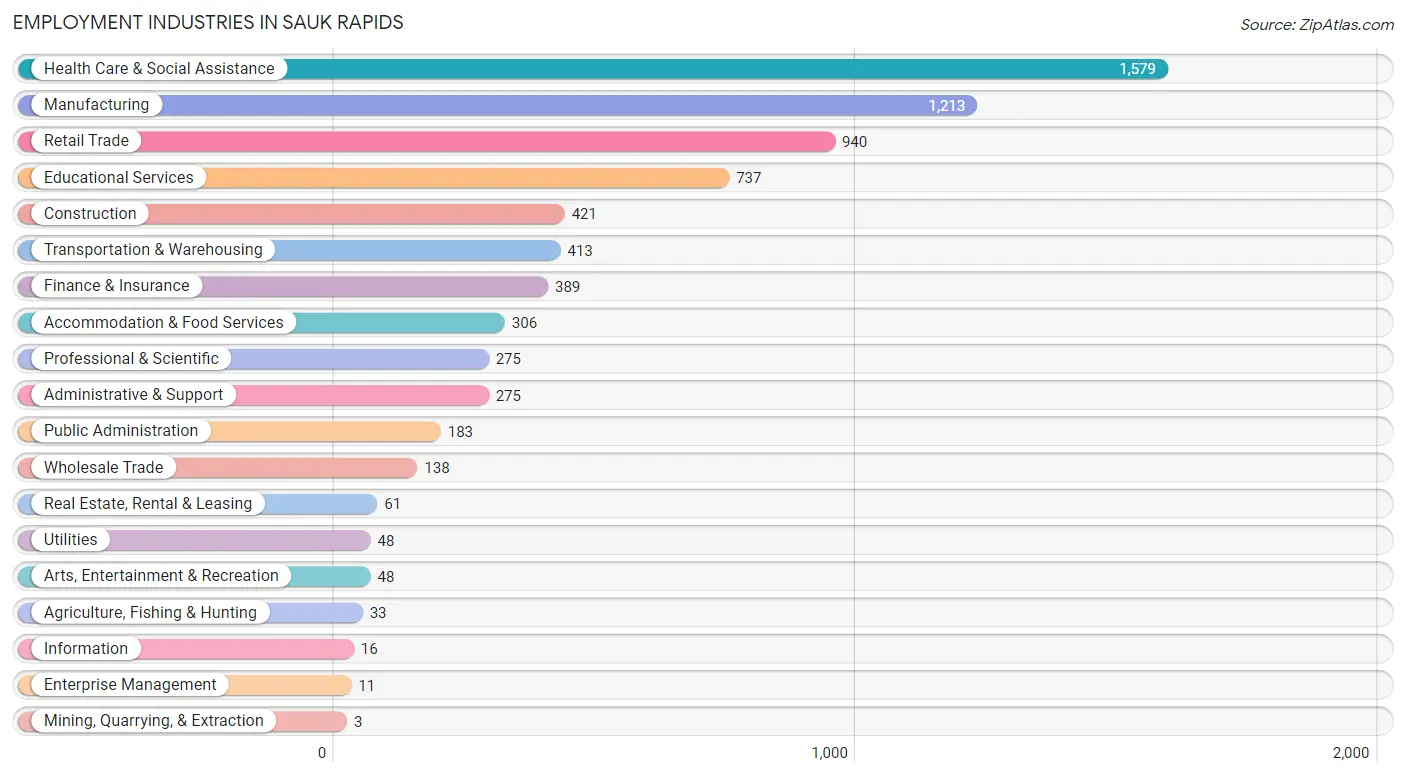
Employment Industries in Sauk Rapids
The major employment industries in Sauk Rapids include Health Care & Social Assistance (1,579 | 21.4%), Manufacturing (1,213 | 16.4%), Retail Trade (940 | 12.7%), Educational Services (737 | 10.0%), and Construction (421 | 5.7%).
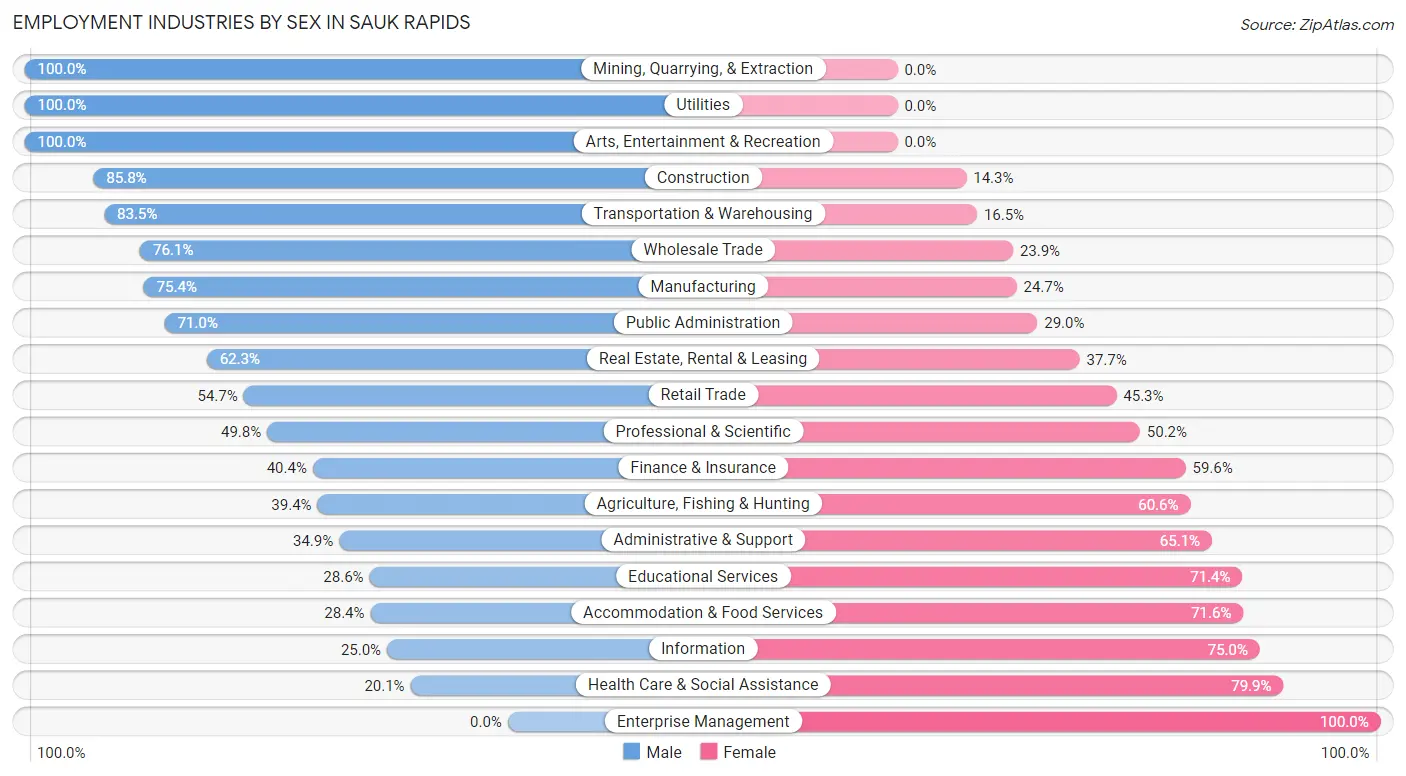
Employment Industries by Sex in Sauk Rapids
The Sauk Rapids industries that see more men than women are Mining, Quarrying, & Extraction (100.0%), Utilities (100.0%), and Arts, Entertainment & Recreation (100.0%), whereas the industries that tend to have a higher number of women are Enterprise Management (100.0%), Health Care & Social Assistance (79.9%), and Information (75.0%).
| Industry | Male | Female |
| Agriculture, Fishing & Hunting | 13 (39.4%) | 20 (60.6%) |
| Mining, Quarrying, & Extraction | 3 (100.0%) | 0 (0.0%) |
| Construction | 361 (85.8%) | 60 (14.2%) |
| Manufacturing | 914 (75.3%) | 299 (24.6%) |
| Wholesale Trade | 105 (76.1%) | 33 (23.9%) |
| Retail Trade | 514 (54.7%) | 426 (45.3%) |
| Transportation & Warehousing | 345 (83.5%) | 68 (16.5%) |
| Utilities | 48 (100.0%) | 0 (0.0%) |
| Information | 4 (25.0%) | 12 (75.0%) |
| Finance & Insurance | 157 (40.4%) | 232 (59.6%) |
| Real Estate, Rental & Leasing | 38 (62.3%) | 23 (37.7%) |
| Professional & Scientific | 137 (49.8%) | 138 (50.2%) |
| Enterprise Management | 0 (0.0%) | 11 (100.0%) |
| Administrative & Support | 96 (34.9%) | 179 (65.1%) |
| Educational Services | 211 (28.6%) | 526 (71.4%) |
| Health Care & Social Assistance | 318 (20.1%) | 1,261 (79.9%) |
| Arts, Entertainment & Recreation | 48 (100.0%) | 0 (0.0%) |
| Accommodation & Food Services | 87 (28.4%) | 219 (71.6%) |
| Public Administration | 130 (71.0%) | 53 (29.0%) |
| Total | 3,712 (50.2%) | 3,682 (49.8%) |
Education in Sauk Rapids
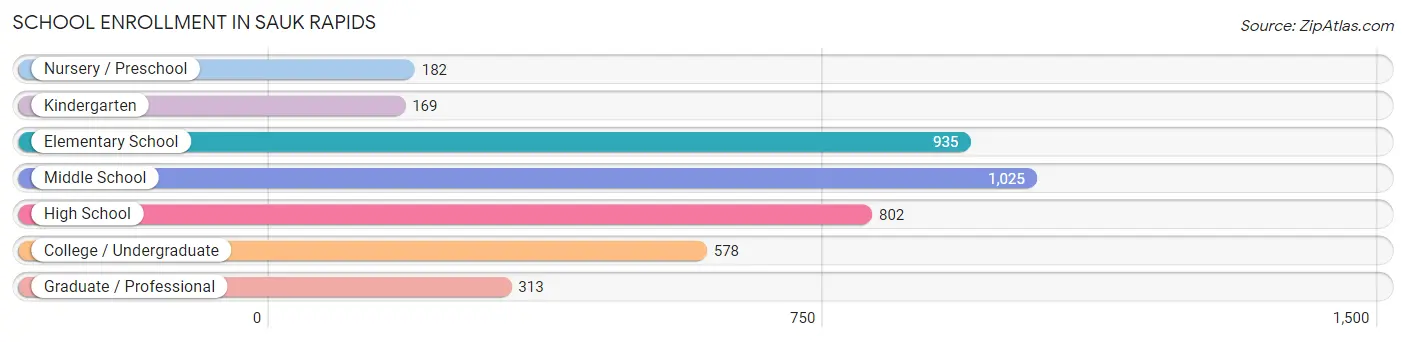
School Enrollment in Sauk Rapids
The most common levels of schooling among the 4,004 students in Sauk Rapids are middle school (1,025 | 25.6%), elementary school (935 | 23.4%), and high school (802 | 20.0%).
| School Level | # Students | % Students |
| Nursery / Preschool | 182 | 4.5% |
| Kindergarten | 169 | 4.2% |
| Elementary School | 935 | 23.4% |
| Middle School | 1,025 | 25.6% |
| High School | 802 | 20.0% |
| College / Undergraduate | 578 | 14.4% |
| Graduate / Professional | 313 | 7.8% |
| Total | 4,004 | 100.0% |
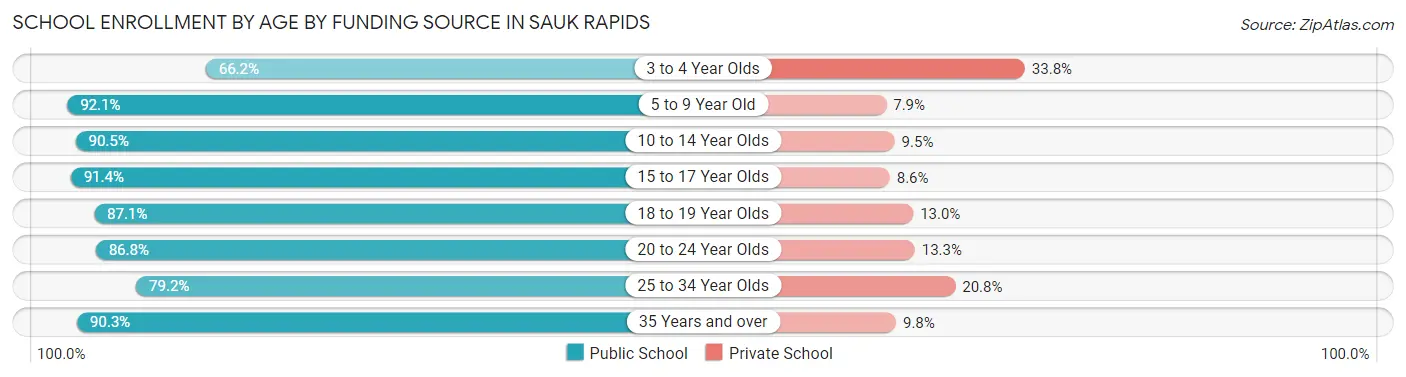
School Enrollment by Age by Funding Source in Sauk Rapids
Out of a total of 4,004 students who are enrolled in schools in Sauk Rapids, 444 (11.1%) attend a private institution, while the remaining 3,560 (88.9%) are enrolled in public schools. The age group of 3 to 4 year olds has the highest likelihood of being enrolled in private schools, with 53 (33.8% in the age bracket) enrolled. Conversely, the age group of 5 to 9 year old has the lowest likelihood of being enrolled in a private school, with 962 (92.1% in the age bracket) attending a public institution.
| Age Bracket | Public School | Private School |
| 3 to 4 Year Olds | 104 (66.2%) | 53 (33.8%) |
| 5 to 9 Year Old | 962 (92.1%) | 83 (7.9%) |
| 10 to 14 Year Olds | 1,067 (90.5%) | 112 (9.5%) |
| 15 to 17 Year Olds | 596 (91.4%) | 56 (8.6%) |
| 18 to 19 Year Olds | 121 (87.1%) | 18 (13.0%) |
| 20 to 24 Year Olds | 275 (86.8%) | 42 (13.3%) |
| 25 to 34 Year Olds | 221 (79.2%) | 58 (20.8%) |
| 35 Years and over | 213 (90.2%) | 23 (9.8%) |
| Total | 3,560 (88.9%) | 444 (11.1%) |
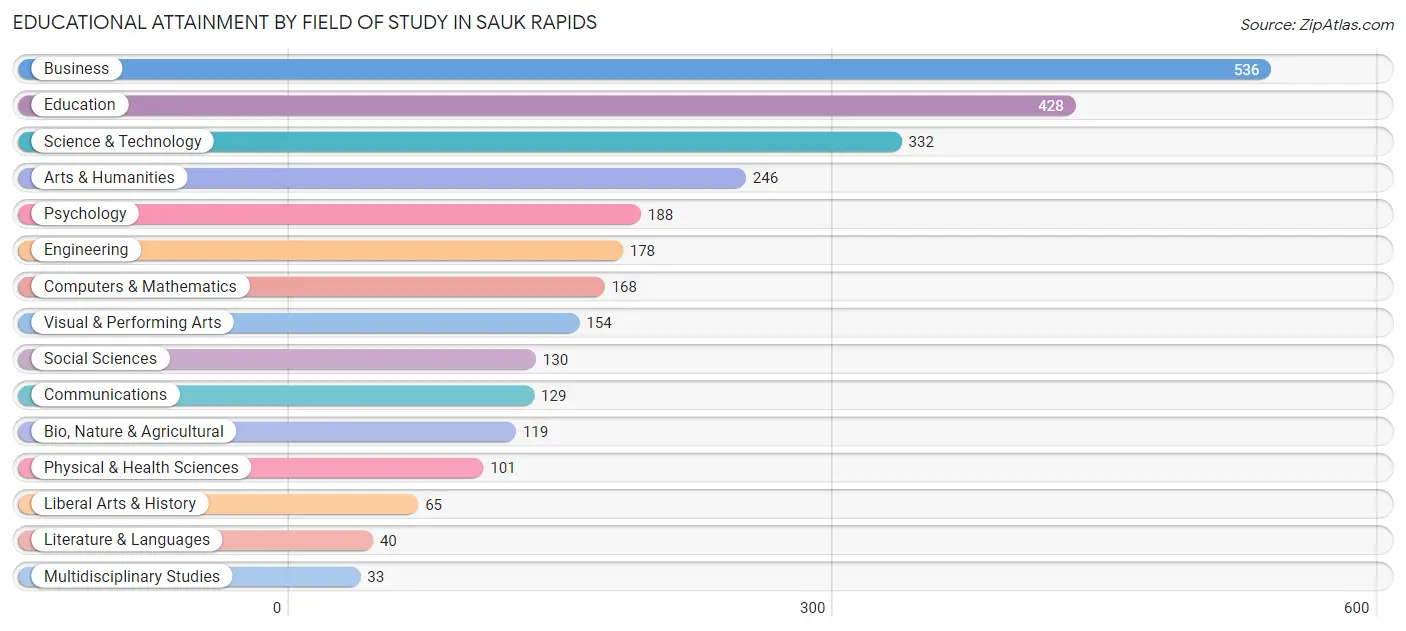
Educational Attainment by Field of Study in Sauk Rapids
Business (536 | 18.8%), education (428 | 15.0%), science & technology (332 | 11.7%), arts & humanities (246 | 8.6%), and psychology (188 | 6.6%) are the most common fields of study among 2,847 individuals in Sauk Rapids who have obtained a bachelor's degree or higher.
| Field of Study | # Graduates | % Graduates |
| Computers & Mathematics | 168 | 5.9% |
| Bio, Nature & Agricultural | 119 | 4.2% |
| Physical & Health Sciences | 101 | 3.5% |
| Psychology | 188 | 6.6% |
| Social Sciences | 130 | 4.6% |
| Engineering | 178 | 6.2% |
| Multidisciplinary Studies | 33 | 1.2% |
| Science & Technology | 332 | 11.7% |
| Business | 536 | 18.8% |
| Education | 428 | 15.0% |
| Literature & Languages | 40 | 1.4% |
| Liberal Arts & History | 65 | 2.3% |
| Visual & Performing Arts | 154 | 5.4% |
| Communications | 129 | 4.5% |
| Arts & Humanities | 246 | 8.6% |
| Total | 2,847 | 100.0% |
Transportation & Commute in Sauk Rapids
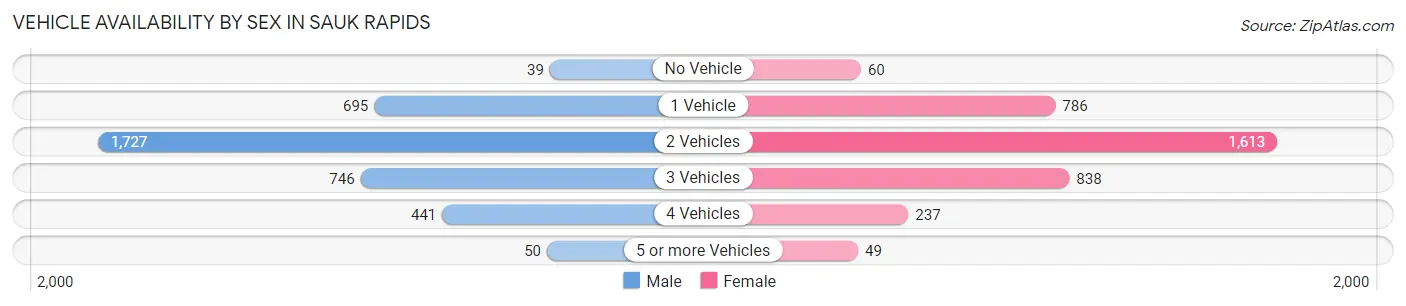
Vehicle Availability by Sex in Sauk Rapids
The most prevalent vehicle ownership categories in Sauk Rapids are males with 2 vehicles (1,727, accounting for 46.7%) and females with 2 vehicles (1,613, making up 48.2%).
| Vehicles Available | Male | Female |
| No Vehicle | 39 (1.1%) | 60 (1.7%) |
| 1 Vehicle | 695 (18.8%) | 786 (21.9%) |
| 2 Vehicles | 1,727 (46.7%) | 1,613 (45.0%) |
| 3 Vehicles | 746 (20.2%) | 838 (23.4%) |
| 4 Vehicles | 441 (11.9%) | 237 (6.6%) |
| 5 or more Vehicles | 50 (1.3%) | 49 (1.4%) |
| Total | 3,698 (100.0%) | 3,583 (100.0%) |
Commute Time in Sauk Rapids
The most frequently occuring commute durations in Sauk Rapids are 10 to 14 minutes (1,781 commuters, 25.9%), 5 to 9 minutes (1,242 commuters, 18.1%), and 15 to 19 minutes (1,224 commuters, 17.8%).
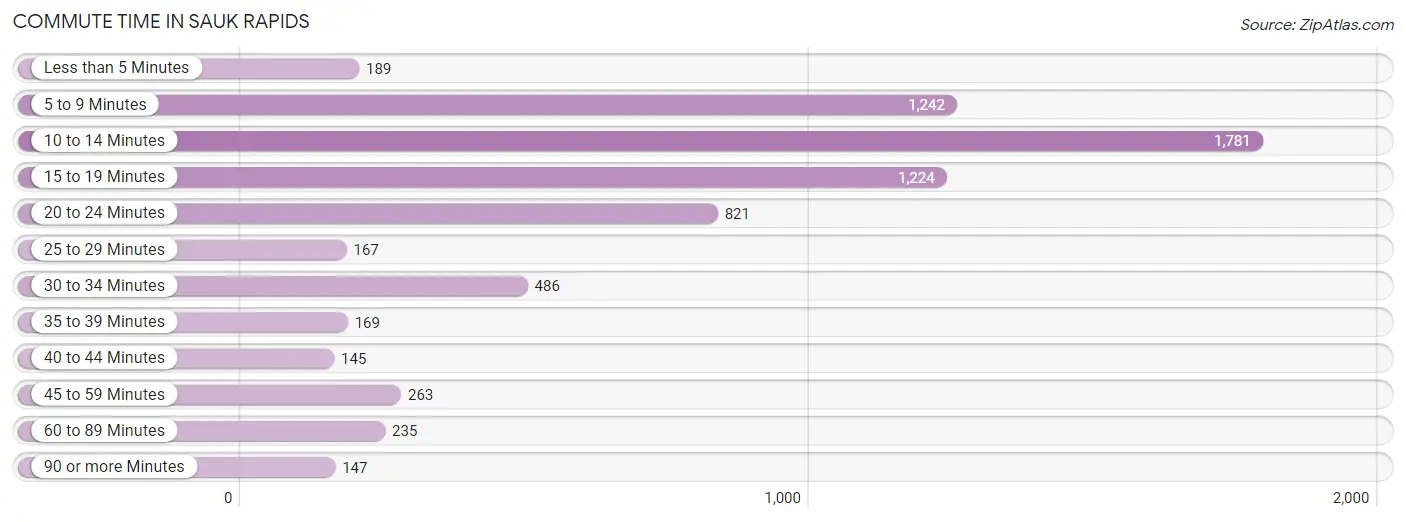
| Commute Time | # Commuters | % Commuters |
| Less than 5 Minutes | 189 | 2.8% |
| 5 to 9 Minutes | 1,242 | 18.1% |
| 10 to 14 Minutes | 1,781 | 25.9% |
| 15 to 19 Minutes | 1,224 | 17.8% |
| 20 to 24 Minutes | 821 | 11.9% |
| 25 to 29 Minutes | 167 | 2.4% |
| 30 to 34 Minutes | 486 | 7.1% |
| 35 to 39 Minutes | 169 | 2.5% |
| 40 to 44 Minutes | 145 | 2.1% |
| 45 to 59 Minutes | 263 | 3.8% |
| 60 to 89 Minutes | 235 | 3.4% |
| 90 or more Minutes | 147 | 2.1% |
Commute Time by Sex in Sauk Rapids
The most common commute times in Sauk Rapids are 10 to 14 minutes (791 commuters, 22.3%) for males and 10 to 14 minutes (990 commuters, 29.8%) for females.
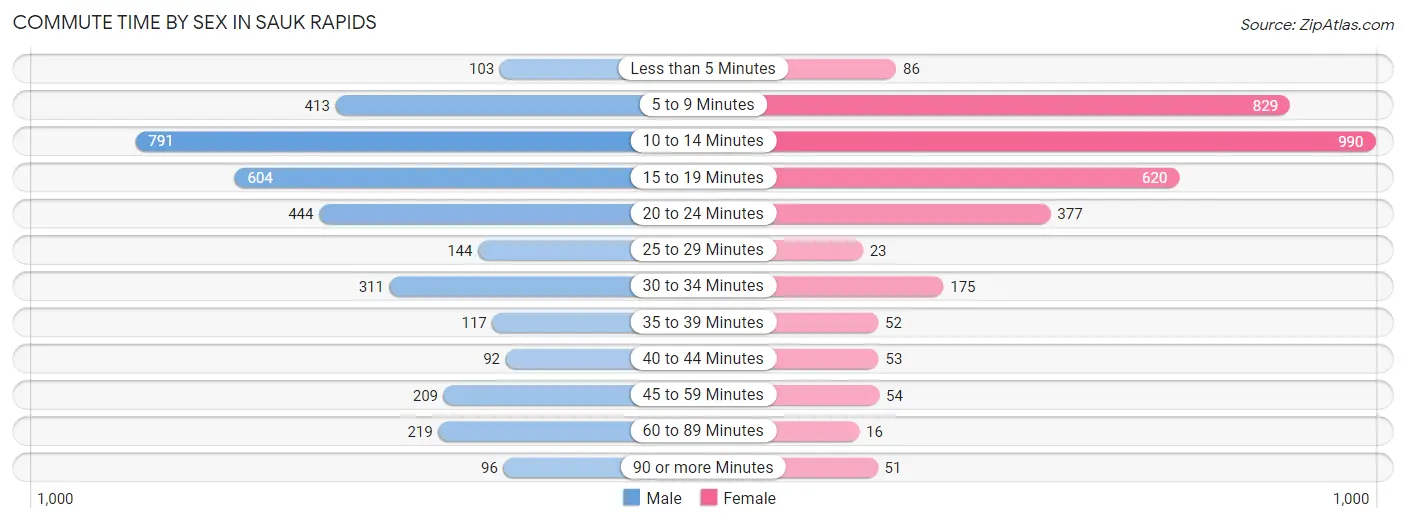
| Commute Time | Male | Female |
| Less than 5 Minutes | 103 (2.9%) | 86 (2.6%) |
| 5 to 9 Minutes | 413 (11.7%) | 829 (24.9%) |
| 10 to 14 Minutes | 791 (22.3%) | 990 (29.8%) |
| 15 to 19 Minutes | 604 (17.1%) | 620 (18.6%) |
| 20 to 24 Minutes | 444 (12.5%) | 377 (11.3%) |
| 25 to 29 Minutes | 144 (4.1%) | 23 (0.7%) |
| 30 to 34 Minutes | 311 (8.8%) | 175 (5.3%) |
| 35 to 39 Minutes | 117 (3.3%) | 52 (1.6%) |
| 40 to 44 Minutes | 92 (2.6%) | 53 (1.6%) |
| 45 to 59 Minutes | 209 (5.9%) | 54 (1.6%) |
| 60 to 89 Minutes | 219 (6.2%) | 16 (0.5%) |
| 90 or more Minutes | 96 (2.7%) | 51 (1.5%) |
Time of Departure to Work by Sex in Sauk Rapids
The most frequent times of departure to work in Sauk Rapids are 7:00 AM to 7:29 AM (624, 17.6%) for males and 7:30 AM to 7:59 AM (588, 17.7%) for females.
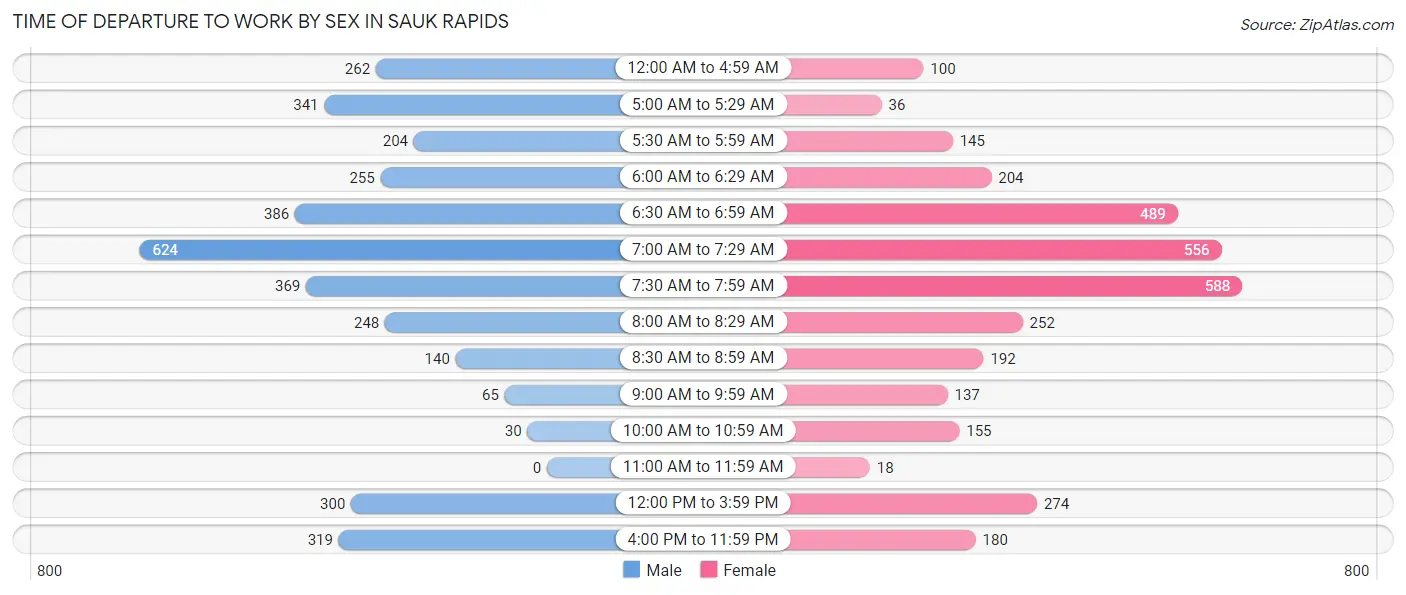
| Time of Departure | Male | Female |
| 12:00 AM to 4:59 AM | 262 (7.4%) | 100 (3.0%) |
| 5:00 AM to 5:29 AM | 341 (9.6%) | 36 (1.1%) |
| 5:30 AM to 5:59 AM | 204 (5.8%) | 145 (4.4%) |
| 6:00 AM to 6:29 AM | 255 (7.2%) | 204 (6.1%) |
| 6:30 AM to 6:59 AM | 386 (10.9%) | 489 (14.7%) |
| 7:00 AM to 7:29 AM | 624 (17.6%) | 556 (16.7%) |
| 7:30 AM to 7:59 AM | 369 (10.4%) | 588 (17.7%) |
| 8:00 AM to 8:29 AM | 248 (7.0%) | 252 (7.6%) |
| 8:30 AM to 8:59 AM | 140 (4.0%) | 192 (5.8%) |
| 9:00 AM to 9:59 AM | 65 (1.8%) | 137 (4.1%) |
| 10:00 AM to 10:59 AM | 30 (0.9%) | 155 (4.7%) |
| 11:00 AM to 11:59 AM | 0 (0.0%) | 18 (0.5%) |
| 12:00 PM to 3:59 PM | 300 (8.5%) | 274 (8.2%) |
| 4:00 PM to 11:59 PM | 319 (9.0%) | 180 (5.4%) |
| Total | 3,543 (100.0%) | 3,326 (100.0%) |
Housing Occupancy in Sauk Rapids
Occupancy by Ownership in Sauk Rapids
Of the total 5,386 dwellings in Sauk Rapids, owner-occupied units account for 3,346 (62.1%), while renter-occupied units make up 2,040 (37.9%).
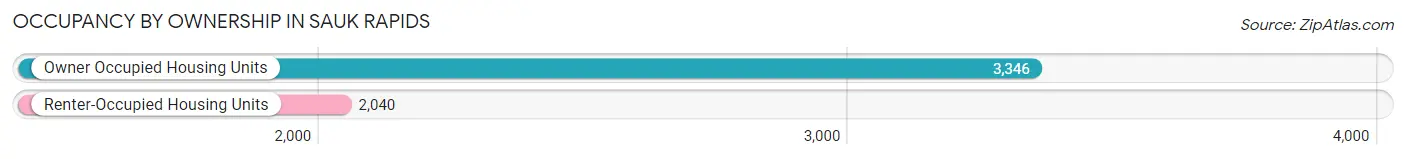
| Occupancy | # Housing Units | % Housing Units |
| Owner Occupied Housing Units | 3,346 | 62.1% |
| Renter-Occupied Housing Units | 2,040 | 37.9% |
| Total Occupied Housing Units | 5,386 | 100.0% |
Occupancy by Household Size in Sauk Rapids
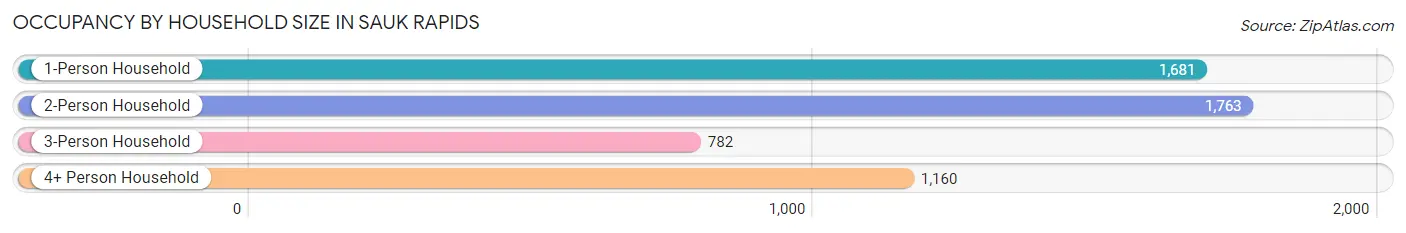
| Household Size | # Housing Units | % Housing Units |
| 1-Person Household | 1,681 | 31.2% |
| 2-Person Household | 1,763 | 32.7% |
| 3-Person Household | 782 | 14.5% |
| 4+ Person Household | 1,160 | 21.5% |
| Total Housing Units | 5,386 | 100.0% |
Occupancy by Ownership by Household Size in Sauk Rapids
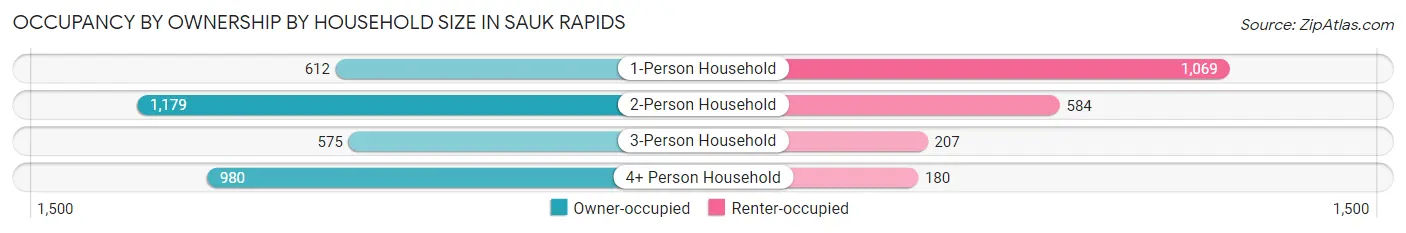
| Household Size | Owner-occupied | Renter-occupied |
| 1-Person Household | 612 (36.4%) | 1,069 (63.6%) |
| 2-Person Household | 1,179 (66.9%) | 584 (33.1%) |
| 3-Person Household | 575 (73.5%) | 207 (26.5%) |
| 4+ Person Household | 980 (84.5%) | 180 (15.5%) |
| Total Housing Units | 3,346 (62.1%) | 2,040 (37.9%) |
Occupancy by Educational Attainment in Sauk Rapids
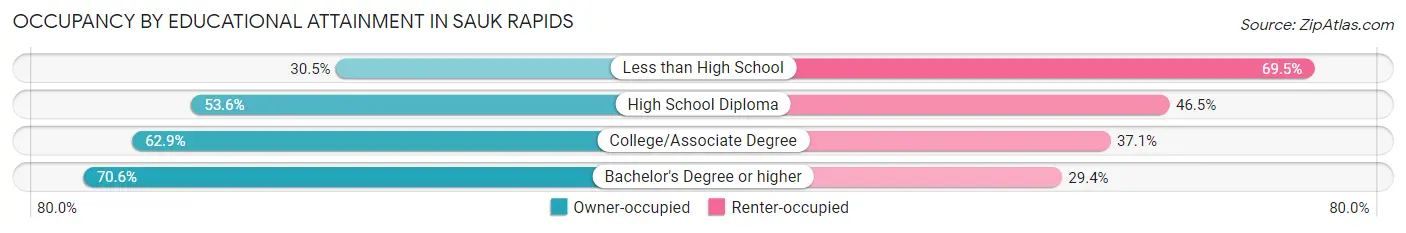
| Household Size | Owner-occupied | Renter-occupied |
| Less than High School | 62 (30.5%) | 141 (69.5%) |
| High School Diploma | 604 (53.5%) | 524 (46.5%) |
| College/Associate Degree | 1,500 (62.9%) | 884 (37.1%) |
| Bachelor's Degree or higher | 1,180 (70.6%) | 491 (29.4%) |
Occupancy by Age of Householder in Sauk Rapids
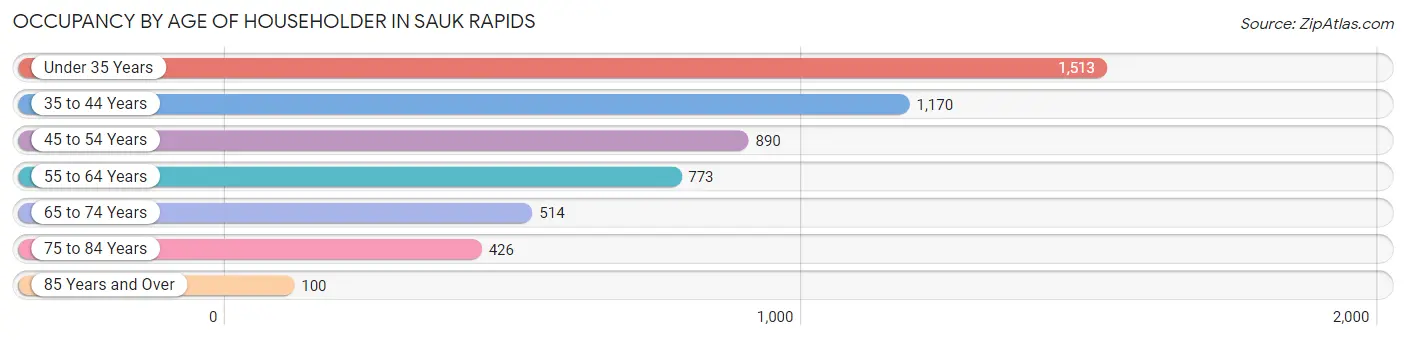
| Age Bracket | # Households | % Households |
| Under 35 Years | 1,513 | 28.1% |
| 35 to 44 Years | 1,170 | 21.7% |
| 45 to 54 Years | 890 | 16.5% |
| 55 to 64 Years | 773 | 14.3% |
| 65 to 74 Years | 514 | 9.5% |
| 75 to 84 Years | 426 | 7.9% |
| 85 Years and Over | 100 | 1.9% |
| Total | 5,386 | 100.0% |
Housing Finances in Sauk Rapids
Median Income by Occupancy in Sauk Rapids
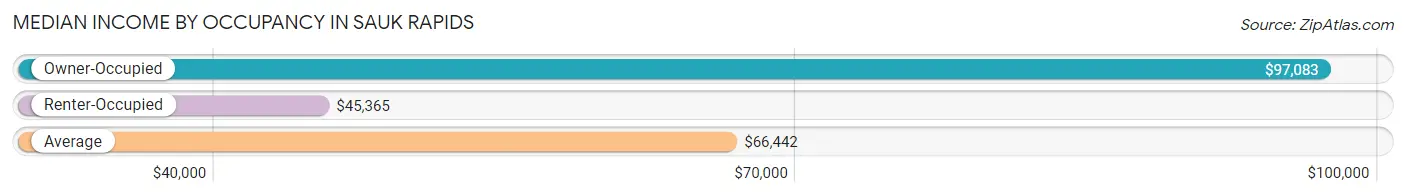
| Occupancy Type | # Households | Median Income |
| Owner-Occupied | 3,346 (62.1%) | $97,083 |
| Renter-Occupied | 2,040 (37.9%) | $45,365 |
| Average | 5,386 (100.0%) | $66,442 |
Occupancy by Householder Income Bracket in Sauk Rapids
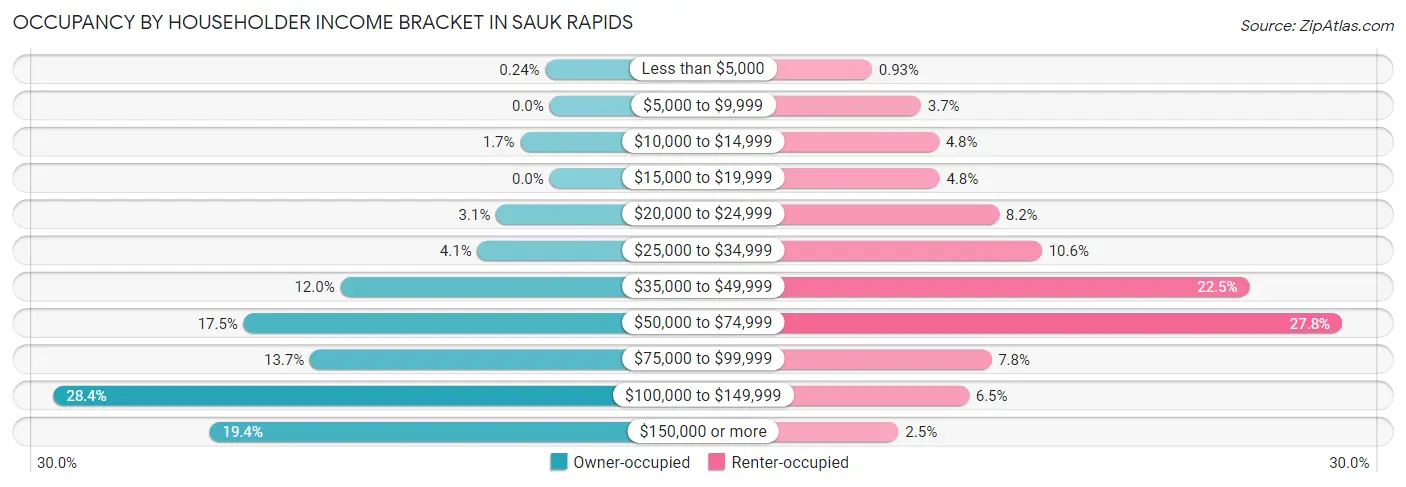
| Income Bracket | Owner-occupied | Renter-occupied |
| Less than $5,000 | 8 (0.2%) | 19 (0.9%) |
| $5,000 to $9,999 | 0 (0.0%) | 76 (3.7%) |
| $10,000 to $14,999 | 56 (1.7%) | 97 (4.8%) |
| $15,000 to $19,999 | 0 (0.0%) | 98 (4.8%) |
| $20,000 to $24,999 | 102 (3.0%) | 167 (8.2%) |
| $25,000 to $34,999 | 138 (4.1%) | 217 (10.6%) |
| $35,000 to $49,999 | 400 (11.9%) | 459 (22.5%) |
| $50,000 to $74,999 | 585 (17.5%) | 567 (27.8%) |
| $75,000 to $99,999 | 458 (13.7%) | 158 (7.7%) |
| $100,000 to $149,999 | 949 (28.4%) | 132 (6.5%) |
| $150,000 or more | 650 (19.4%) | 50 (2.5%) |
| Total | 3,346 (100.0%) | 2,040 (100.0%) |
Monthly Housing Cost Tiers in Sauk Rapids
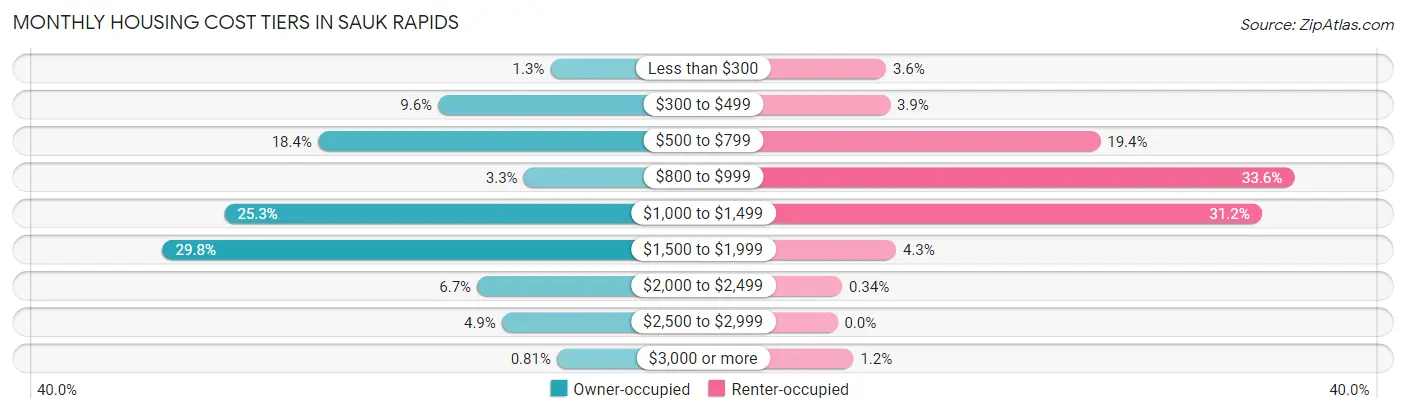
| Monthly Cost | Owner-occupied | Renter-occupied |
| Less than $300 | 43 (1.3%) | 73 (3.6%) |
| $300 to $499 | 320 (9.6%) | 79 (3.9%) |
| $500 to $799 | 616 (18.4%) | 395 (19.4%) |
| $800 to $999 | 109 (3.3%) | 686 (33.6%) |
| $1,000 to $1,499 | 846 (25.3%) | 637 (31.2%) |
| $1,500 to $1,999 | 998 (29.8%) | 88 (4.3%) |
| $2,000 to $2,499 | 224 (6.7%) | 7 (0.3%) |
| $2,500 to $2,999 | 163 (4.9%) | 0 (0.0%) |
| $3,000 or more | 27 (0.8%) | 24 (1.2%) |
| Total | 3,346 (100.0%) | 2,040 (100.0%) |
Physical Housing Characteristics in Sauk Rapids
Housing Structures in Sauk Rapids
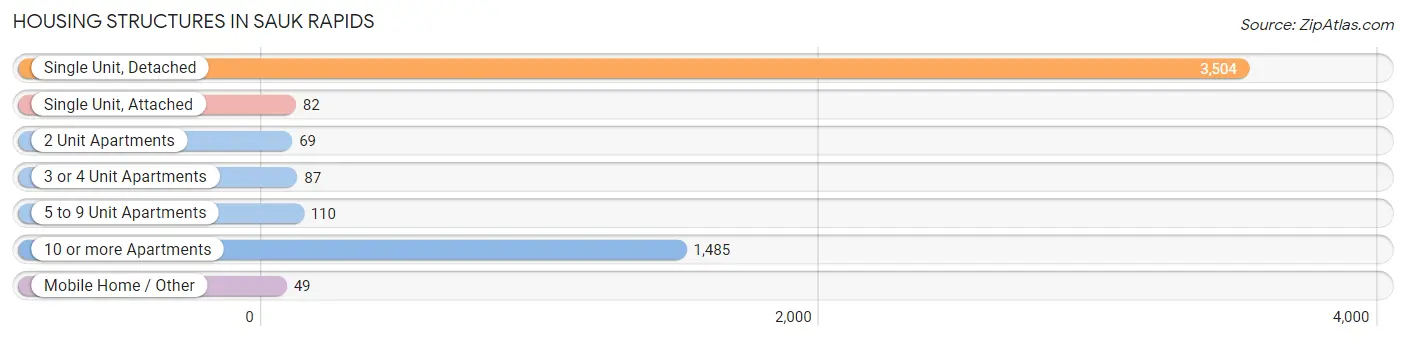
| Structure Type | # Housing Units | % Housing Units |
| Single Unit, Detached | 3,504 | 65.1% |
| Single Unit, Attached | 82 | 1.5% |
| 2 Unit Apartments | 69 | 1.3% |
| 3 or 4 Unit Apartments | 87 | 1.6% |
| 5 to 9 Unit Apartments | 110 | 2.0% |
| 10 or more Apartments | 1,485 | 27.6% |
| Mobile Home / Other | 49 | 0.9% |
| Total | 5,386 | 100.0% |
Housing Structures by Occupancy in Sauk Rapids
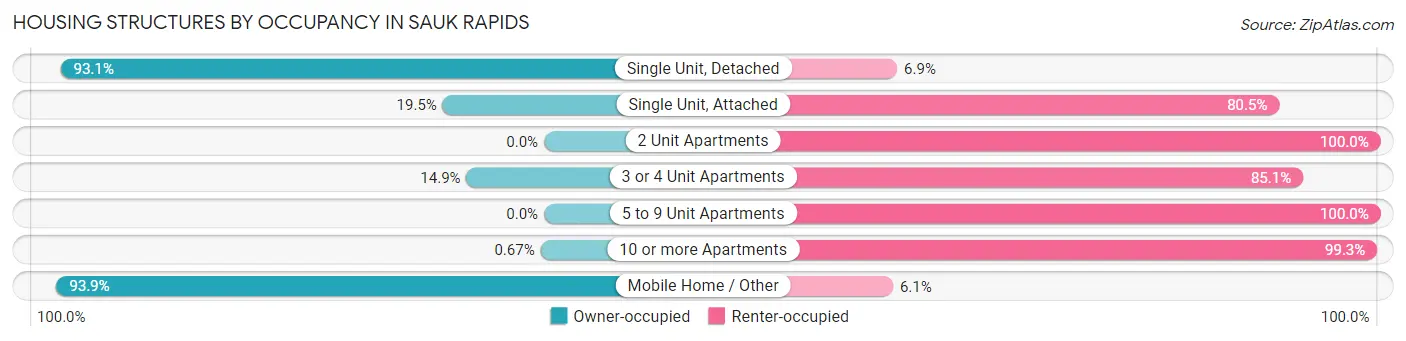
| Structure Type | Owner-occupied | Renter-occupied |
| Single Unit, Detached | 3,261 (93.1%) | 243 (6.9%) |
| Single Unit, Attached | 16 (19.5%) | 66 (80.5%) |
| 2 Unit Apartments | 0 (0.0%) | 69 (100.0%) |
| 3 or 4 Unit Apartments | 13 (14.9%) | 74 (85.1%) |
| 5 to 9 Unit Apartments | 0 (0.0%) | 110 (100.0%) |
| 10 or more Apartments | 10 (0.7%) | 1,475 (99.3%) |
| Mobile Home / Other | 46 (93.9%) | 3 (6.1%) |
| Total | 3,346 (62.1%) | 2,040 (37.9%) |
Housing Structures by Number of Rooms in Sauk Rapids
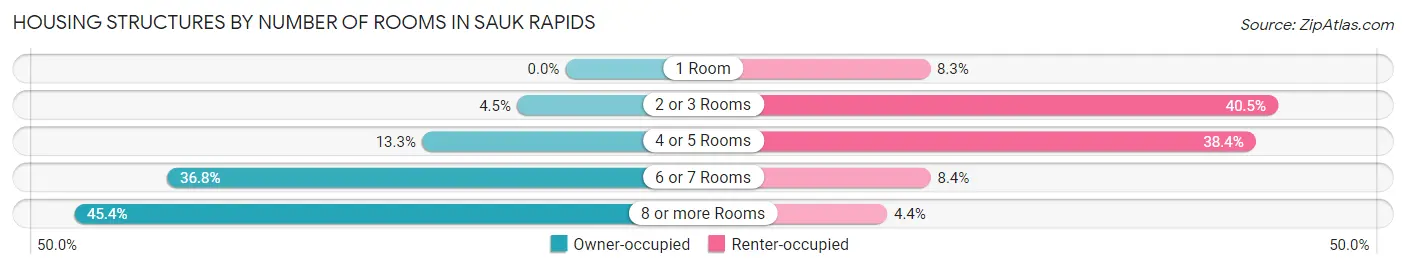
| Number of Rooms | Owner-occupied | Renter-occupied |
| 1 Room | 0 (0.0%) | 170 (8.3%) |
| 2 or 3 Rooms | 150 (4.5%) | 826 (40.5%) |
| 4 or 5 Rooms | 444 (13.3%) | 784 (38.4%) |
| 6 or 7 Rooms | 1,232 (36.8%) | 171 (8.4%) |
| 8 or more Rooms | 1,520 (45.4%) | 89 (4.4%) |
| Total | 3,346 (100.0%) | 2,040 (100.0%) |
Housing Structure by Heating Type in Sauk Rapids
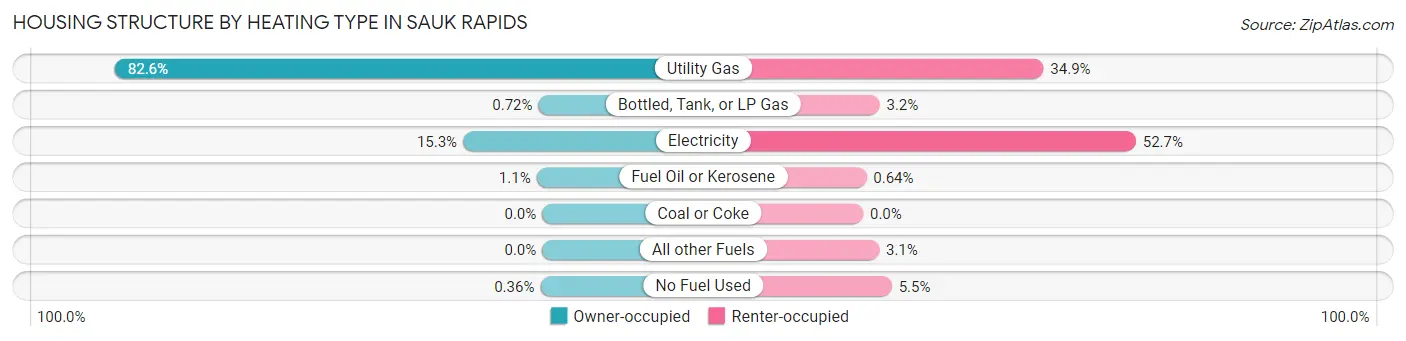
| Heating Type | Owner-occupied | Renter-occupied |
| Utility Gas | 2,762 (82.6%) | 711 (34.8%) |
| Bottled, Tank, or LP Gas | 24 (0.7%) | 65 (3.2%) |
| Electricity | 512 (15.3%) | 1,075 (52.7%) |
| Fuel Oil or Kerosene | 36 (1.1%) | 13 (0.6%) |
| Coal or Coke | 0 (0.0%) | 0 (0.0%) |
| All other Fuels | 0 (0.0%) | 63 (3.1%) |
| No Fuel Used | 12 (0.4%) | 113 (5.5%) |
| Total | 3,346 (100.0%) | 2,040 (100.0%) |
Household Vehicle Usage in Sauk Rapids
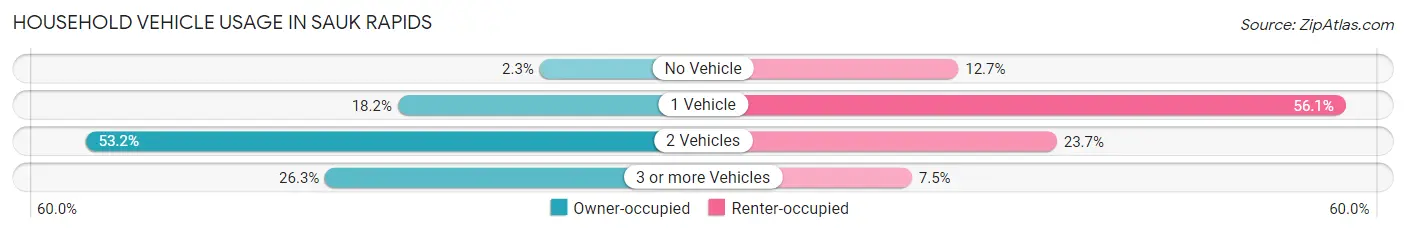
| Vehicles per Household | Owner-occupied | Renter-occupied |
| No Vehicle | 77 (2.3%) | 259 (12.7%) |
| 1 Vehicle | 609 (18.2%) | 1,144 (56.1%) |
| 2 Vehicles | 1,779 (53.2%) | 484 (23.7%) |
| 3 or more Vehicles | 881 (26.3%) | 153 (7.5%) |
| Total | 3,346 (100.0%) | 2,040 (100.0%) |
Real Estate & Mortgages in Sauk Rapids
Real Estate and Mortgage Overview in Sauk Rapids
| Characteristic | Without Mortgage | With Mortgage |
| Housing Units | 994 | 2,352 |
| Median Property Value | $217,000 | $230,200 |
| Median Household Income | $59,538 | $436 |
| Monthly Housing Costs | $551 | $27 |
| Real Estate Taxes | $2,509 | $24 |
Property Value by Mortgage Status in Sauk Rapids
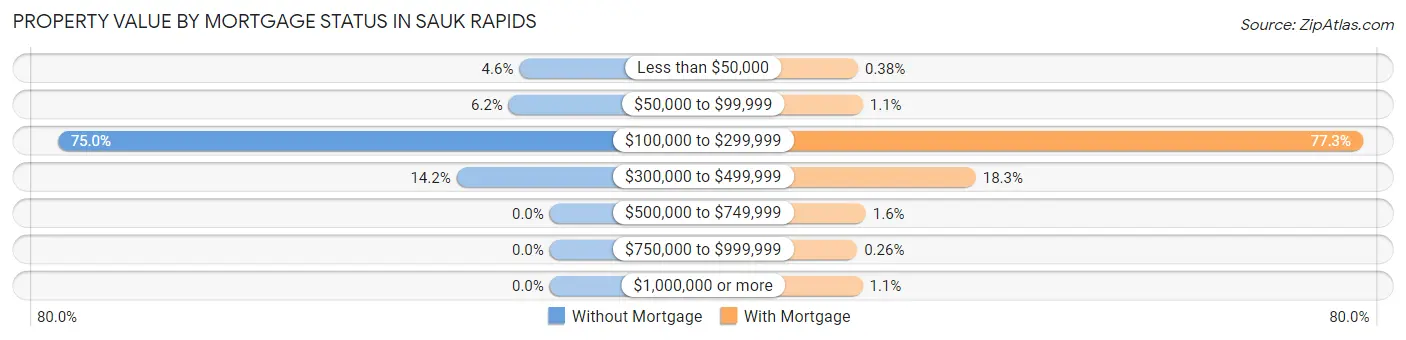
| Property Value | Without Mortgage | With Mortgage |
| Less than $50,000 | 46 (4.6%) | 9 (0.4%) |
| $50,000 to $99,999 | 62 (6.2%) | 26 (1.1%) |
| $100,000 to $299,999 | 745 (75.0%) | 1,818 (77.3%) |
| $300,000 to $499,999 | 141 (14.2%) | 431 (18.3%) |
| $500,000 to $749,999 | 0 (0.0%) | 37 (1.6%) |
| $750,000 to $999,999 | 0 (0.0%) | 6 (0.3%) |
| $1,000,000 or more | 0 (0.0%) | 25 (1.1%) |
| Total | 994 (100.0%) | 2,352 (100.0%) |
Household Income by Mortgage Status in Sauk Rapids
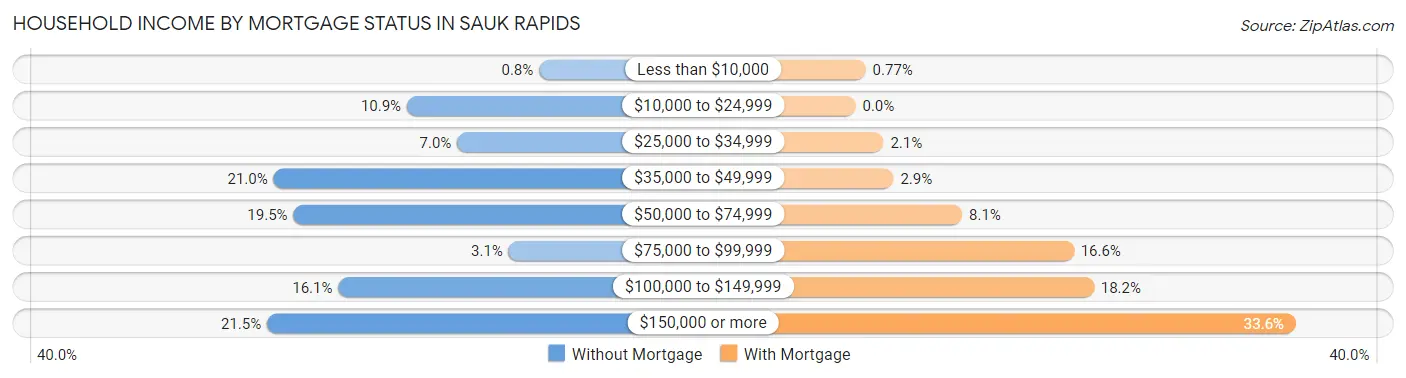
| Household Income | Without Mortgage | With Mortgage |
| Less than $10,000 | 8 (0.8%) | 18 (0.8%) |
| $10,000 to $24,999 | 108 (10.9%) | 0 (0.0%) |
| $25,000 to $34,999 | 70 (7.0%) | 50 (2.1%) |
| $35,000 to $49,999 | 209 (21.0%) | 68 (2.9%) |
| $50,000 to $74,999 | 194 (19.5%) | 191 (8.1%) |
| $75,000 to $99,999 | 31 (3.1%) | 391 (16.6%) |
| $100,000 to $149,999 | 160 (16.1%) | 427 (18.1%) |
| $150,000 or more | 214 (21.5%) | 789 (33.6%) |
| Total | 994 (100.0%) | 2,352 (100.0%) |
Property Value to Household Income Ratio in Sauk Rapids
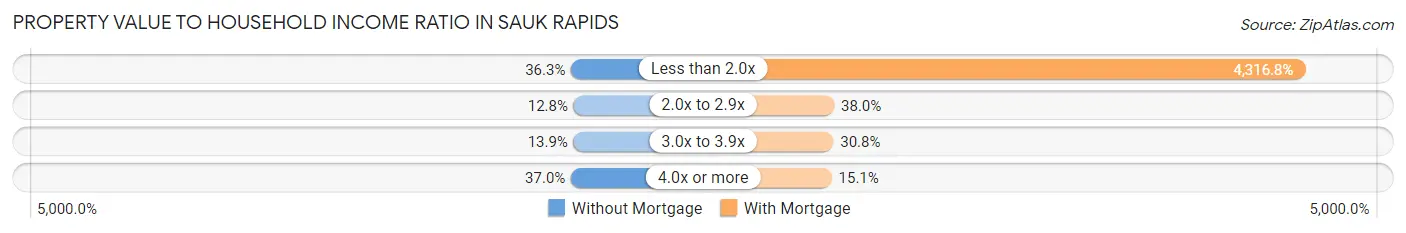
| Value-to-Income Ratio | Without Mortgage | With Mortgage |
| Less than 2.0x | 361 (36.3%) | 101,531 (4,316.8%) |
| 2.0x to 2.9x | 127 (12.8%) | 893 (38.0%) |
| 3.0x to 3.9x | 138 (13.9%) | 724 (30.8%) |
| 4.0x or more | 368 (37.0%) | 355 (15.1%) |
| Total | 994 (100.0%) | 2,352 (100.0%) |
Real Estate Taxes by Mortgage Status in Sauk Rapids
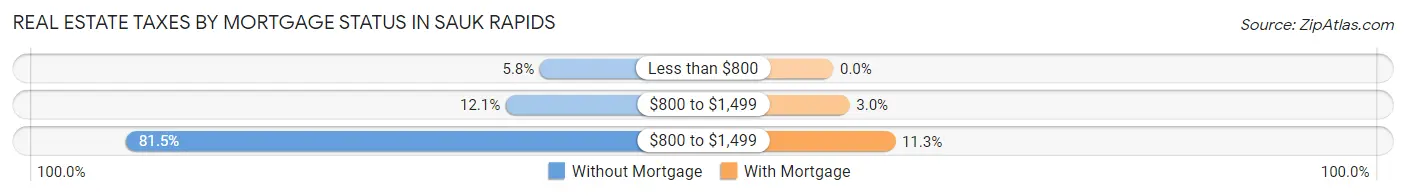
| Property Taxes | Without Mortgage | With Mortgage |
| Less than $800 | 58 (5.8%) | 0 (0.0%) |
| $800 to $1,499 | 120 (12.1%) | 70 (3.0%) |
| $800 to $1,499 | 810 (81.5%) | 266 (11.3%) |
| Total | 994 (100.0%) | 2,352 (100.0%) |
Health & Disability in Sauk Rapids
Health Insurance Coverage by Age in Sauk Rapids
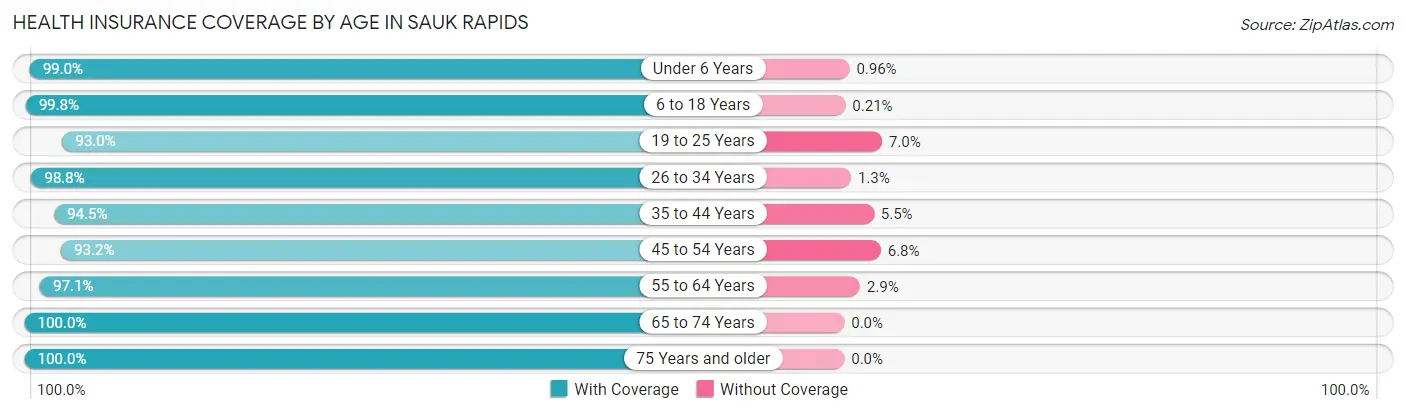
| Age Bracket | With Coverage | Without Coverage |
| Under 6 Years | 1,032 (99.0%) | 10 (1.0%) |
| 6 to 18 Years | 2,908 (99.8%) | 6 (0.2%) |
| 19 to 25 Years | 1,045 (93.0%) | 79 (7.0%) |
| 26 to 34 Years | 1,895 (98.8%) | 24 (1.3%) |
| 35 to 44 Years | 2,076 (94.5%) | 121 (5.5%) |
| 45 to 54 Years | 1,395 (93.2%) | 102 (6.8%) |
| 55 to 64 Years | 1,202 (97.1%) | 36 (2.9%) |
| 65 to 74 Years | 877 (100.0%) | 0 (0.0%) |
| 75 Years and older | 724 (100.0%) | 0 (0.0%) |
| Total | 13,154 (97.2%) | 378 (2.8%) |
Health Insurance Coverage by Citizenship Status in Sauk Rapids
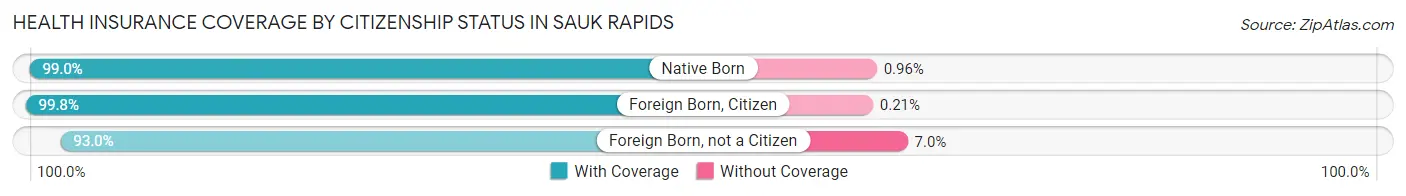
| Citizenship Status | With Coverage | Without Coverage |
| Native Born | 1,032 (99.0%) | 10 (1.0%) |
| Foreign Born, Citizen | 2,908 (99.8%) | 6 (0.2%) |
| Foreign Born, not a Citizen | 1,045 (93.0%) | 79 (7.0%) |
Health Insurance Coverage by Household Income in Sauk Rapids
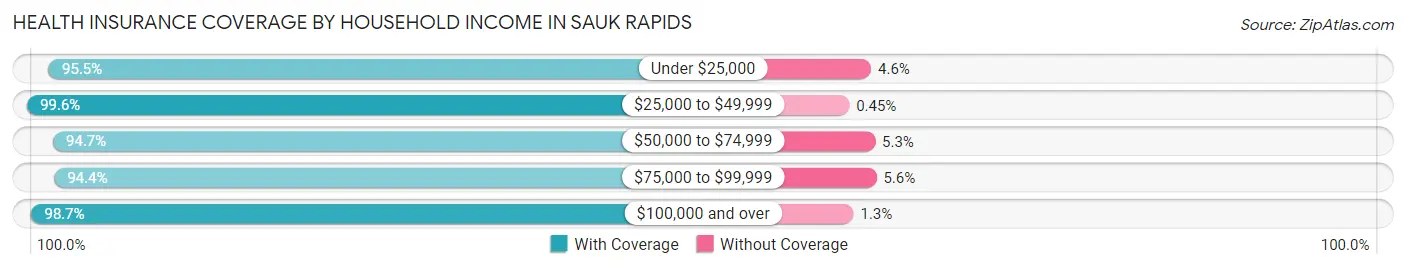
| Household Income | With Coverage | Without Coverage |
| Under $25,000 | 672 (95.5%) | 32 (4.5%) |
| $25,000 to $49,999 | 2,231 (99.6%) | 10 (0.4%) |
| $50,000 to $74,999 | 2,806 (94.7%) | 157 (5.3%) |
| $75,000 to $99,999 | 1,530 (94.4%) | 90 (5.6%) |
| $100,000 and over | 5,643 (98.7%) | 72 (1.3%) |
Public vs Private Health Insurance Coverage by Age in Sauk Rapids
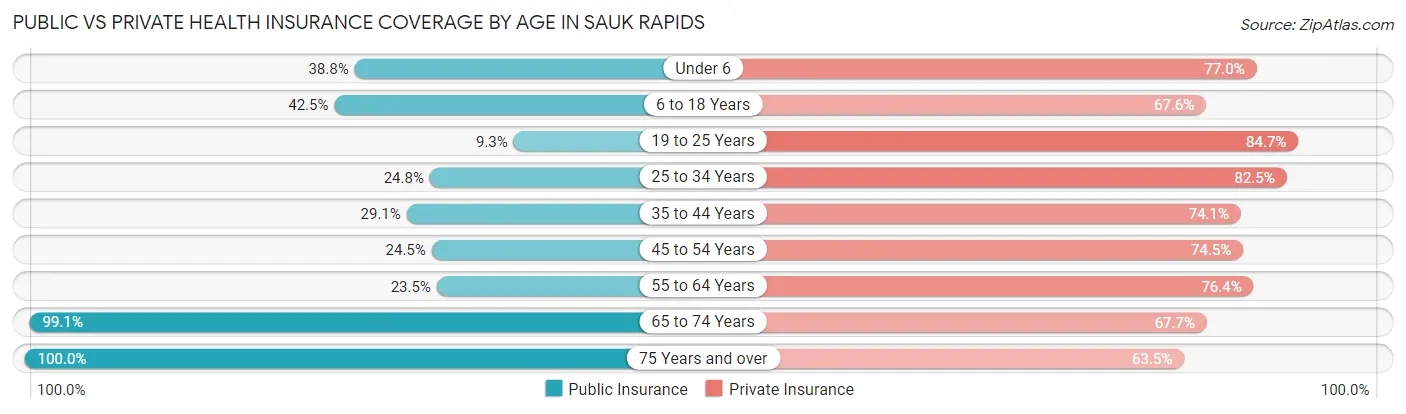
| Age Bracket | Public Insurance | Private Insurance |
| Under 6 | 404 (38.8%) | 802 (77.0%) |
| 6 to 18 Years | 1,239 (42.5%) | 1,970 (67.6%) |
| 19 to 25 Years | 104 (9.2%) | 952 (84.7%) |
| 25 to 34 Years | 476 (24.8%) | 1,584 (82.5%) |
| 35 to 44 Years | 639 (29.1%) | 1,627 (74.1%) |
| 45 to 54 Years | 366 (24.4%) | 1,115 (74.5%) |
| 55 to 64 Years | 291 (23.5%) | 946 (76.4%) |
| 65 to 74 Years | 869 (99.1%) | 594 (67.7%) |
| 75 Years and over | 724 (100.0%) | 460 (63.5%) |
| Total | 5,112 (37.8%) | 10,050 (74.3%) |
Disability Status by Sex by Age in Sauk Rapids
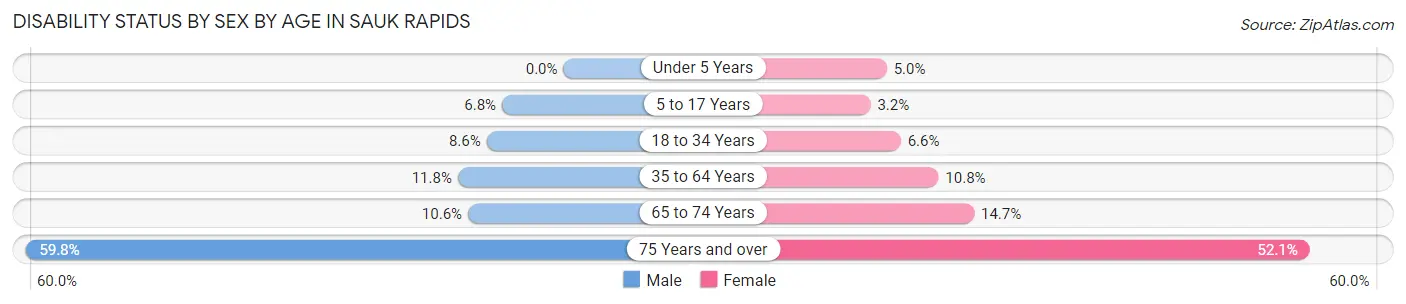
| Age Bracket | Male | Female |
| Under 5 Years | 0 (0.0%) | 21 (5.0%) |
| 5 to 17 Years | 94 (6.8%) | 51 (3.2%) |
| 18 to 34 Years | 139 (8.6%) | 102 (6.6%) |
| 35 to 64 Years | 298 (11.8%) | 258 (10.8%) |
| 65 to 74 Years | 42 (10.6%) | 71 (14.7%) |
| 75 Years and over | 177 (59.8%) | 223 (52.1%) |
Disability Class by Sex by Age in Sauk Rapids
Disability Class: Hearing Difficulty
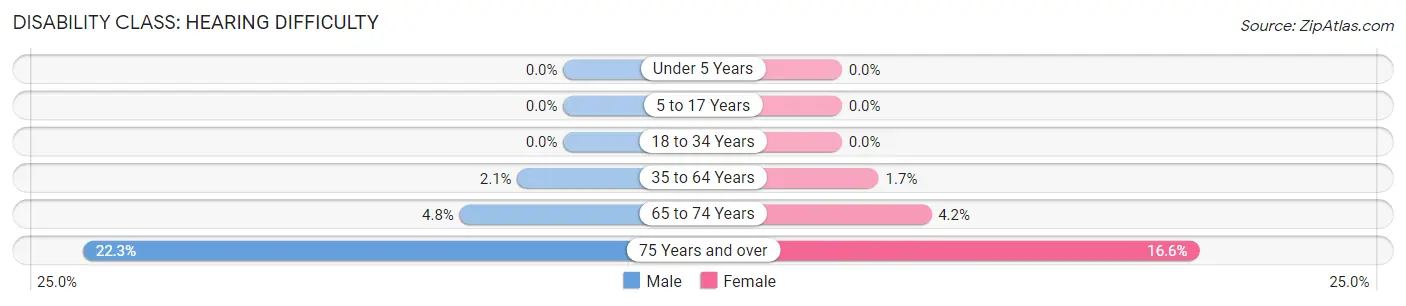
| Age Bracket | Male | Female |
| Under 5 Years | 0 (0.0%) | 0 (0.0%) |
| 5 to 17 Years | 0 (0.0%) | 0 (0.0%) |
| 18 to 34 Years | 0 (0.0%) | 0 (0.0%) |
| 35 to 64 Years | 54 (2.1%) | 41 (1.7%) |
| 65 to 74 Years | 19 (4.8%) | 20 (4.2%) |
| 75 Years and over | 66 (22.3%) | 71 (16.6%) |
Disability Class: Vision Difficulty
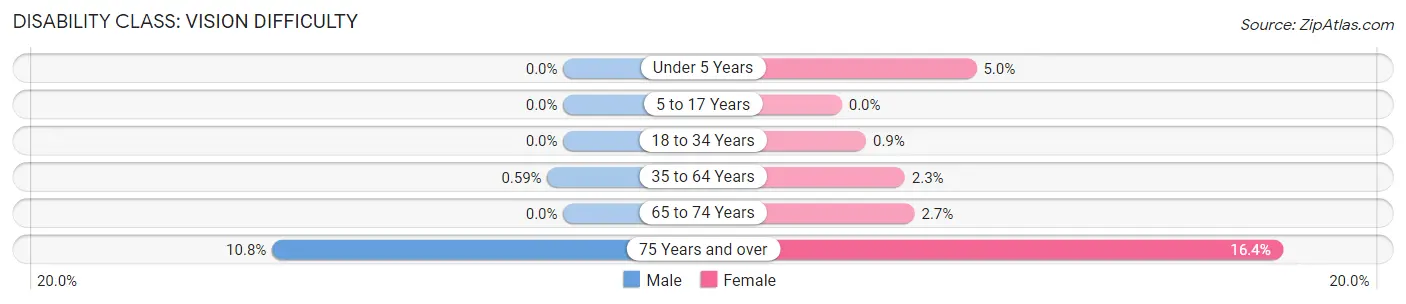
| Age Bracket | Male | Female |
| Under 5 Years | 0 (0.0%) | 21 (5.0%) |
| 5 to 17 Years | 0 (0.0%) | 0 (0.0%) |
| 18 to 34 Years | 0 (0.0%) | 14 (0.9%) |
| 35 to 64 Years | 15 (0.6%) | 56 (2.3%) |
| 65 to 74 Years | 0 (0.0%) | 13 (2.7%) |
| 75 Years and over | 32 (10.8%) | 70 (16.4%) |
Disability Class: Cognitive Difficulty
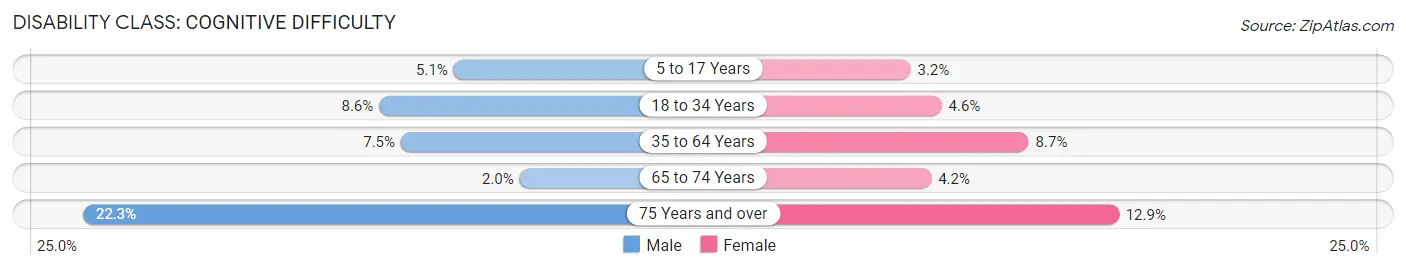
| Age Bracket | Male | Female |
| 5 to 17 Years | 70 (5.1%) | 51 (3.2%) |
| 18 to 34 Years | 139 (8.6%) | 72 (4.6%) |
| 35 to 64 Years | 191 (7.5%) | 208 (8.7%) |
| 65 to 74 Years | 8 (2.0%) | 20 (4.2%) |
| 75 Years and over | 66 (22.3%) | 55 (12.9%) |
Disability Class: Ambulatory Difficulty
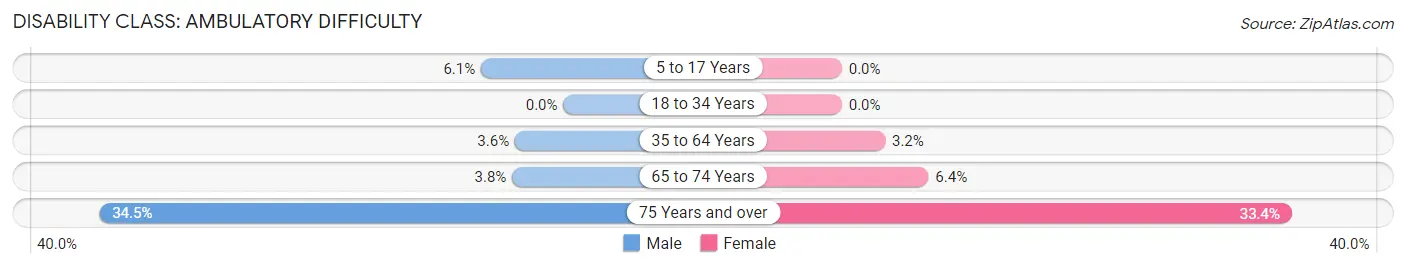
| Age Bracket | Male | Female |
| 5 to 17 Years | 84 (6.1%) | 0 (0.0%) |
| 18 to 34 Years | 0 (0.0%) | 0 (0.0%) |
| 35 to 64 Years | 91 (3.6%) | 77 (3.2%) |
| 65 to 74 Years | 15 (3.8%) | 31 (6.4%) |
| 75 Years and over | 102 (34.5%) | 143 (33.4%) |
Disability Class: Self-Care Difficulty
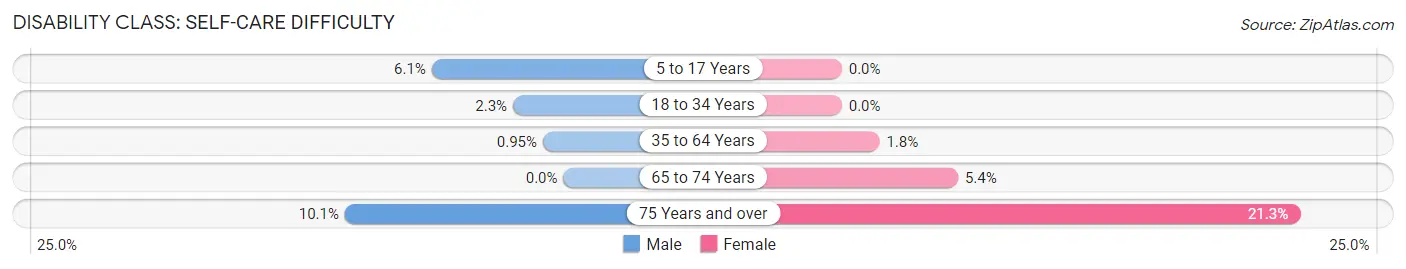
| Age Bracket | Male | Female |
| 5 to 17 Years | 84 (6.1%) | 0 (0.0%) |
| 18 to 34 Years | 38 (2.3%) | 0 (0.0%) |
| 35 to 64 Years | 24 (0.9%) | 42 (1.8%) |
| 65 to 74 Years | 0 (0.0%) | 26 (5.4%) |
| 75 Years and over | 30 (10.1%) | 91 (21.3%) |
Technology Access in Sauk Rapids
Computing Device Access in Sauk Rapids
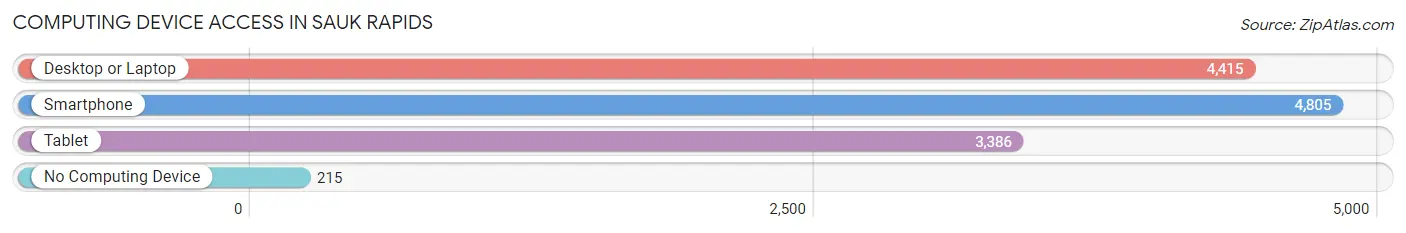
| Device Type | # Households | % Households |
| Desktop or Laptop | 4,415 | 82.0% |
| Smartphone | 4,805 | 89.2% |
| Tablet | 3,386 | 62.9% |
| No Computing Device | 215 | 4.0% |
| Total | 5,386 | 100.0% |
Internet Access in Sauk Rapids
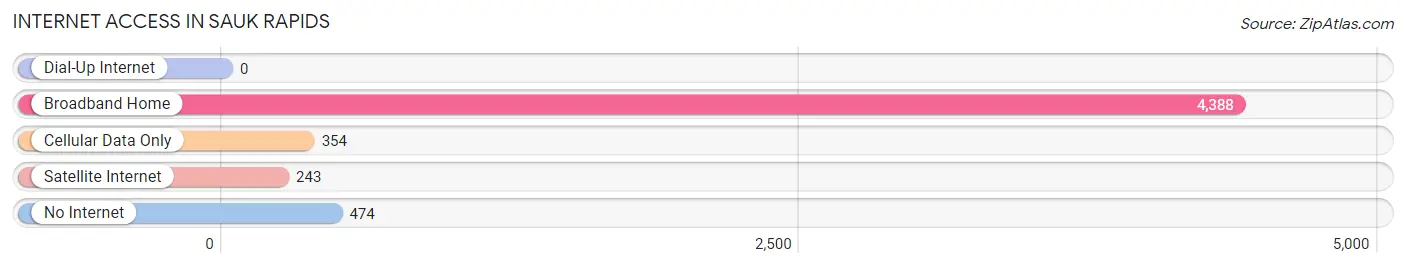
| Internet Type | # Households | % Households |
| Dial-Up Internet | 0 | 0.0% |
| Broadband Home | 4,388 | 81.5% |
| Cellular Data Only | 354 | 6.6% |
| Satellite Internet | 243 | 4.5% |
| No Internet | 474 | 8.8% |
| Total | 5,386 | 100.0% |
Sauk Rapids Summary
Sauk Rapids is a city located in Benton County, Minnesota, United States. The population was 12,773 at the 2010 census. It is located on the banks of the Mississippi River, just north of St. Cloud.
History
The area that is now Sauk Rapids was first settled in 1854 by a group of German immigrants led by John and Mary Schulte. The Schultes built a log cabin on the banks of the Mississippi River and named it Sauk Rapids, after the Sauk Rapids Rapids, a series of rapids in the river. The Schultes and their neighbors cleared the land and began farming.
In 1856, the first post office was established in Sauk Rapids. The town was officially incorporated in 1872.
In the late 19th century, Sauk Rapids became an important transportation hub. The Great Northern Railway built a line through the city in 1887, connecting it to St. Cloud and Minneapolis. This allowed the city to become a major shipping center for the region.
In the early 20th century, Sauk Rapids began to industrialize. The first paper mill was built in 1906, and the city soon became a major producer of paper products. The city also became a center for manufacturing, with several factories producing furniture, clothing, and other goods.
Geography
Sauk Rapids is located at the confluence of the Mississippi and Sauk Rivers. The city is situated on the western edge of the Anoka Sand Plain, a flat, sandy area that stretches from the Twin Cities to the north and east. The city is surrounded by rolling hills and wooded areas.
The city has a total area of 8.2 square miles, of which 8.1 square miles is land and 0.1 square mile is water.
Economy
Sauk Rapids is a major center for manufacturing and industry. The city is home to several paper mills, furniture factories, and other manufacturing plants. The city is also home to several retail stores, restaurants, and other businesses.
The city is also home to several educational institutions, including St. Cloud State University, St. Cloud Technical and Community College, and the Sauk Rapids-Rice School District.
Demographics
As of the 2010 census, the population of Sauk Rapids was 12,773. The racial makeup of the city was 94.3% White, 1.2% African American, 0.7% Native American, 1.2% Asian, 0.1% Pacific Islander, 1.2% from other races, and 1.5% from two or more races. Hispanic or Latino of any race were 3.2% of the population.
The median income for a household in the city was $45,945, and the median income for a family was $54,945. The per capita income for the city was $21,945. About 6.2% of families and 8.7% of the population were below the poverty line, including 11.2% of those under age 18 and 6.2% of those age 65 or over.
Common Questions
What is Per Capita Income in Sauk Rapids?
Per Capita income in Sauk Rapids is $35,029.
What is the Median Family Income in Sauk Rapids?
Median Family Income in Sauk Rapids is $91,129.
What is the Median Household income in Sauk Rapids?
Median Household Income in Sauk Rapids is $66,442.
What is Income or Wage Gap in Sauk Rapids?
Income or Wage Gap in Sauk Rapids is 28.0%.
Women in Sauk Rapids earn 72.0 cents for every dollar earned by a man.
What is Inequality or Gini Index in Sauk Rapids?
Inequality or Gini Index in Sauk Rapids is 0.39.
What is the Total Population of Sauk Rapids?
Total Population of Sauk Rapids is 13,830.
What is the Total Male Population of Sauk Rapids?
Total Male Population of Sauk Rapids is 6,750.
What is the Total Female Population of Sauk Rapids?
Total Female Population of Sauk Rapids is 7,080.
What is the Ratio of Males per 100 Females in Sauk Rapids?
There are 95.34 Males per 100 Females in Sauk Rapids.
What is the Ratio of Females per 100 Males in Sauk Rapids?
There are 104.89 Females per 100 Males in Sauk Rapids.
What is the Median Population Age in Sauk Rapids?
Median Population Age in Sauk Rapids is 34.5 Years.
What is the Average Family Size in Sauk Rapids
Average Family Size in Sauk Rapids is 3.1 People.
What is the Average Household Size in Sauk Rapids
Average Household Size in Sauk Rapids is 2.5 People.
How Large is the Labor Force in Sauk Rapids?
There are 7,659 People in the Labor Forcein in Sauk Rapids.
What is the Percentage of People in the Labor Force in Sauk Rapids?
73.5% of People are in the Labor Force in Sauk Rapids.
What is the Unemployment Rate in Sauk Rapids?
Unemployment Rate in Sauk Rapids is 2.9%.