Spring Park, MN Map & Demographics
Spring Park Map
Spring Park Overview
$52,346
PER CAPITA INCOME
$63,958
AVG FAMILY INCOME
$48,684
AVG HOUSEHOLD INCOME
4.3%
WAGE / INCOME GAP [ % ]
95.7¢/ $1
WAGE / INCOME GAP [ $ ]
0.49
INEQUALITY / GINI INDEX
1,919
TOTAL POPULATION
907
MALE POPULATION
1,012
FEMALE POPULATION
89.62
MALES / 100 FEMALES
111.58
FEMALES / 100 MALES
55.5
MEDIAN AGE
2.3
AVG FAMILY SIZE
1.5
AVG HOUSEHOLD SIZE
1,024
LABOR FORCE [ PEOPLE ]
56.6%
PERCENT IN LABOR FORCE
3.5%
UNEMPLOYMENT RATE
Spring Park Zip Codes
Income in Spring Park
Income Overview in Spring Park
Per Capita Income in Spring Park is $52,346, while median incomes of families and households are $63,958 and $48,684 respectively.
| Characteristic | Number | Measure |
| Per Capita Income | 1,919 | $52,346 |
| Median Family Income | 392 | $63,958 |
| Mean Family Income | 392 | $117,142 |
| Median Household Income | 1,220 | $48,684 |
| Mean Household Income | 1,220 | $79,881 |
| Income Deficit | 392 | $0 |
| Wage / Income Gap (%) | 1,919 | 4.33% |
| Wage / Income Gap ($) | 1,919 | 95.67¢ per $1 |
| Gini / Inequality Index | 1,919 | 0.49 |
Earnings by Sex in Spring Park
Average Earnings in Spring Park are $39,802, $39,705 for men and $41,500 for women, a difference of 4.3%.
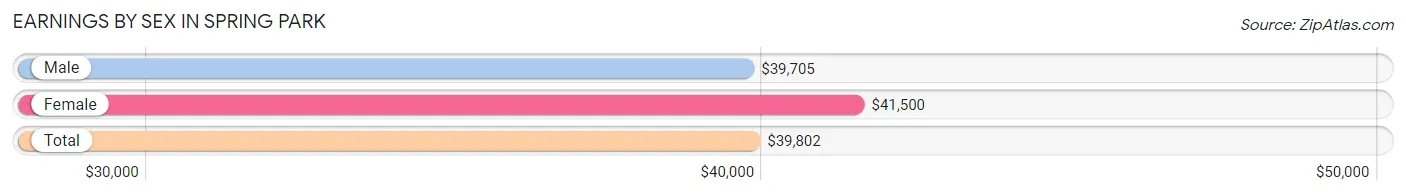
| Sex | Number | Average Earnings |
| Male | 543 (51.4%) | $39,705 |
| Female | 514 (48.6%) | $41,500 |
| Total | 1,057 (100.0%) | $39,802 |
Earnings by Sex by Income Bracket in Spring Park
The most common earnings brackets in Spring Park are $35,000 to $39,999 for men (132 | 24.3%) and $30,000 to $34,999 for women (70 | 13.6%).
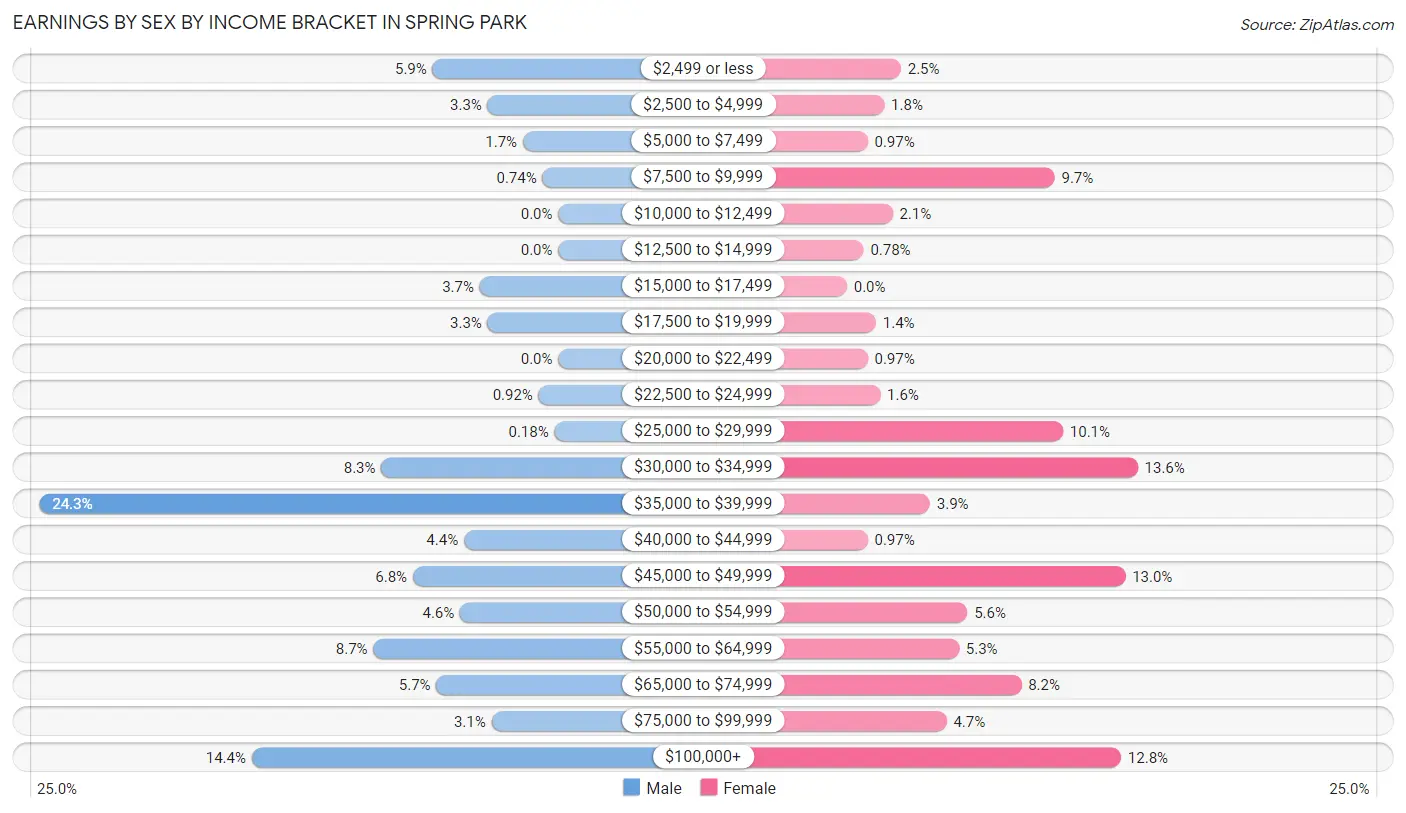
| Income | Male | Female |
| $2,499 or less | 32 (5.9%) | 13 (2.5%) |
| $2,500 to $4,999 | 18 (3.3%) | 9 (1.8%) |
| $5,000 to $7,499 | 9 (1.7%) | 5 (1.0%) |
| $7,500 to $9,999 | 4 (0.7%) | 50 (9.7%) |
| $10,000 to $12,499 | 0 (0.0%) | 11 (2.1%) |
| $12,500 to $14,999 | 0 (0.0%) | 4 (0.8%) |
| $15,000 to $17,499 | 20 (3.7%) | 0 (0.0%) |
| $17,500 to $19,999 | 18 (3.3%) | 7 (1.4%) |
| $20,000 to $22,499 | 0 (0.0%) | 5 (1.0%) |
| $22,500 to $24,999 | 5 (0.9%) | 8 (1.6%) |
| $25,000 to $29,999 | 1 (0.2%) | 52 (10.1%) |
| $30,000 to $34,999 | 45 (8.3%) | 70 (13.6%) |
| $35,000 to $39,999 | 132 (24.3%) | 20 (3.9%) |
| $40,000 to $44,999 | 24 (4.4%) | 5 (1.0%) |
| $45,000 to $49,999 | 37 (6.8%) | 67 (13.0%) |
| $50,000 to $54,999 | 25 (4.6%) | 29 (5.6%) |
| $55,000 to $64,999 | 47 (8.7%) | 27 (5.2%) |
| $65,000 to $74,999 | 31 (5.7%) | 42 (8.2%) |
| $75,000 to $99,999 | 17 (3.1%) | 24 (4.7%) |
| $100,000+ | 78 (14.4%) | 66 (12.8%) |
| Total | 543 (100.0%) | 514 (100.0%) |
Earnings by Sex by Educational Attainment in Spring Park
Average earnings in Spring Park are $40,278 for men and $47,250 for women, a difference of 14.8%. Men with an educational attainment of bachelor's degree enjoy the highest average annual earnings of $93,438, while those with high school diploma education earn the least with $39,175. Women with an educational attainment of graduate degree earn the most with the average annual earnings of $65,417, while those with high school diploma education have the smallest earnings of $33,000.
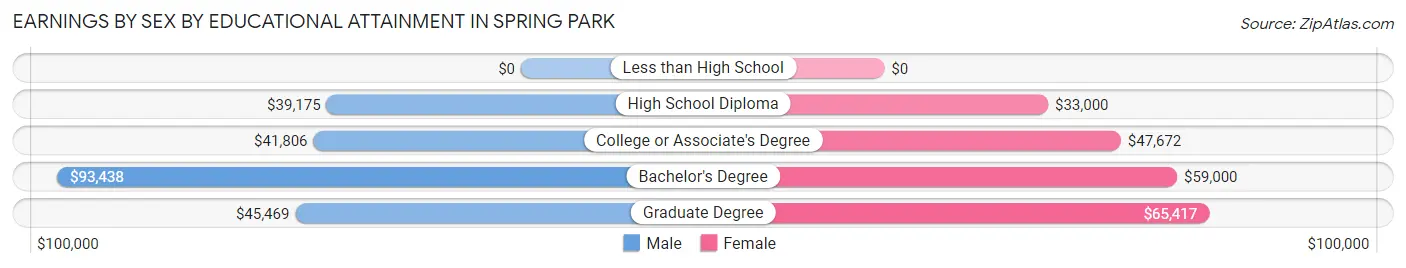
| Educational Attainment | Male Income | Female Income |
| Less than High School | - | - |
| High School Diploma | $39,175 | $33,000 |
| College or Associate's Degree | $41,806 | $47,672 |
| Bachelor's Degree | $93,438 | $59,000 |
| Graduate Degree | $45,469 | $65,417 |
| Total | $40,278 | $47,250 |
Family Income in Spring Park
Family Income Brackets in Spring Park
According to the Spring Park family income data, there are 69 families falling into the $50,000 to $74,999 income range, which is the most common income bracket and makes up 17.6% of all families.
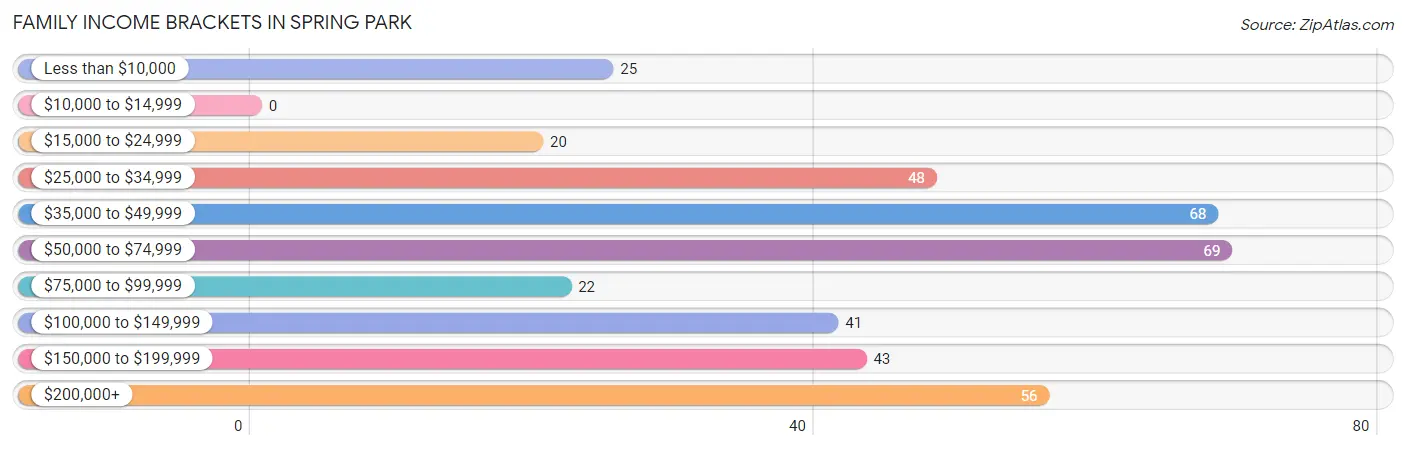
| Income Bracket | # Families | % Families |
| Less than $10,000 | 25 | 6.4% |
| $10,000 to $14,999 | 0 | 0.0% |
| $15,000 to $24,999 | 20 | 5.1% |
| $25,000 to $34,999 | 48 | 12.2% |
| $35,000 to $49,999 | 68 | 17.3% |
| $50,000 to $74,999 | 69 | 17.6% |
| $75,000 to $99,999 | 22 | 5.6% |
| $100,000 to $149,999 | 41 | 10.5% |
| $150,000 to $199,999 | 43 | 11.0% |
| $200,000+ | 56 | 14.3% |
Family Income by Famaliy Size in Spring Park
2-person families (288 | 73.5%) account for the highest median family income in Spring Park with $67,857 per family, while 2-person families (288 | 73.5%) have the highest median income of $33,928 per family member.
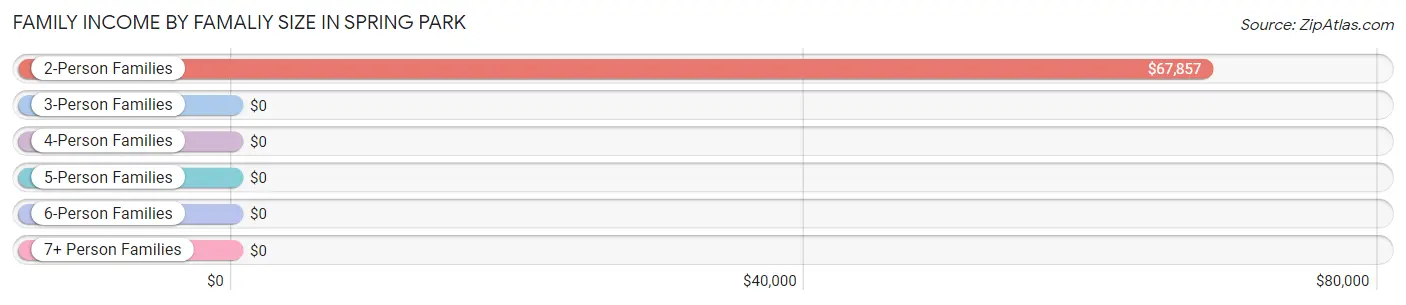
| Income Bracket | # Families | Median Income |
| 2-Person Families | 288 (73.5%) | $67,857 |
| 3-Person Families | 80 (20.4%) | $0 |
| 4-Person Families | 18 (4.6%) | $0 |
| 5-Person Families | 0 (0.0%) | $0 |
| 6-Person Families | 6 (1.5%) | $0 |
| 7+ Person Families | 0 (0.0%) | $0 |
| Total | 392 (100.0%) | $63,958 |
Family Income by Number of Earners in Spring Park
The median family income in Spring Park is $63,958, with families comprising 3+ earners (40) having the highest median family income of $193,667, while families with 1 earner (124) have the lowest median family income of $48,534, accounting for 10.2% and 31.6% of families, respectively.
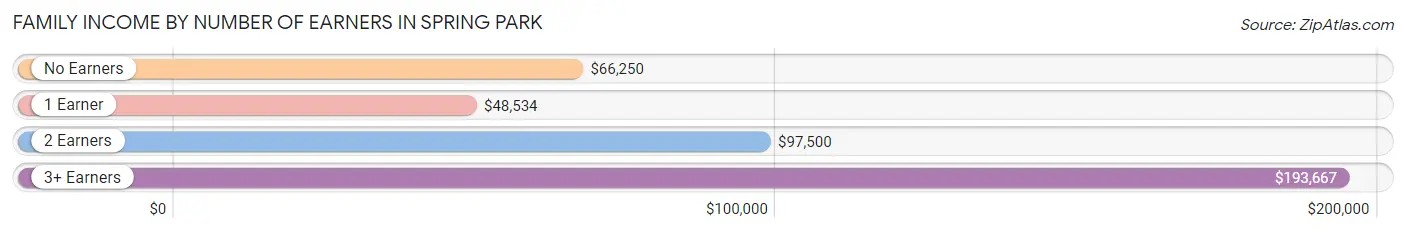
| Number of Earners | # Families | Median Income |
| No Earners | 96 (24.5%) | $66,250 |
| 1 Earner | 124 (31.6%) | $48,534 |
| 2 Earners | 132 (33.7%) | $97,500 |
| 3+ Earners | 40 (10.2%) | $193,667 |
| Total | 392 (100.0%) | $63,958 |
Household Income in Spring Park
Household Income Brackets in Spring Park
With 314 households falling in the category, the $35,000 to $49,999 income range is the most frequent in Spring Park, accounting for 25.7% of all households. In contrast, only 51 households (4.2%) fall into the less than $10,000 income bracket, making it the least populous group.
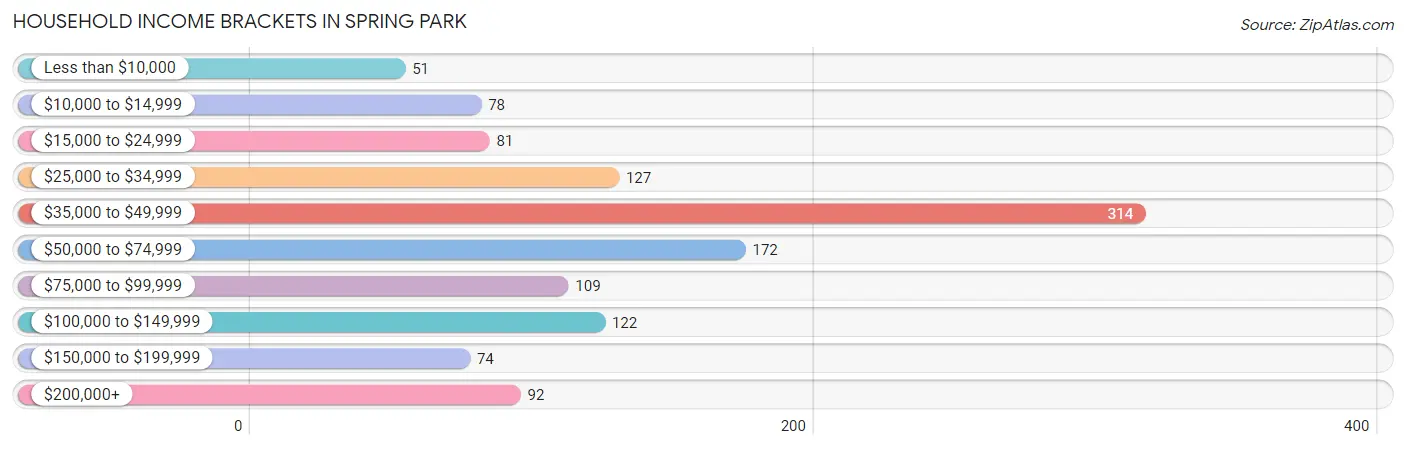
| Income Bracket | # Households | % Households |
| Less than $10,000 | 51 | 4.2% |
| $10,000 to $14,999 | 78 | 6.4% |
| $15,000 to $24,999 | 81 | 6.6% |
| $25,000 to $34,999 | 127 | 10.4% |
| $35,000 to $49,999 | 314 | 25.7% |
| $50,000 to $74,999 | 172 | 14.1% |
| $75,000 to $99,999 | 109 | 8.9% |
| $100,000 to $149,999 | 122 | 10.0% |
| $150,000 to $199,999 | 74 | 6.1% |
| $200,000+ | 92 | 7.5% |
Household Income by Householder Age in Spring Park
The median household income in Spring Park is $48,684, with the highest median household income of $68,846 found in the 45 to 64 years age bracket for the primary householder. A total of 342 households (28.0%) fall into this category. Meanwhile, the 15 to 24 years age bracket for the primary householder has the lowest median household income of $0, with 11 households (0.9%) in this group.
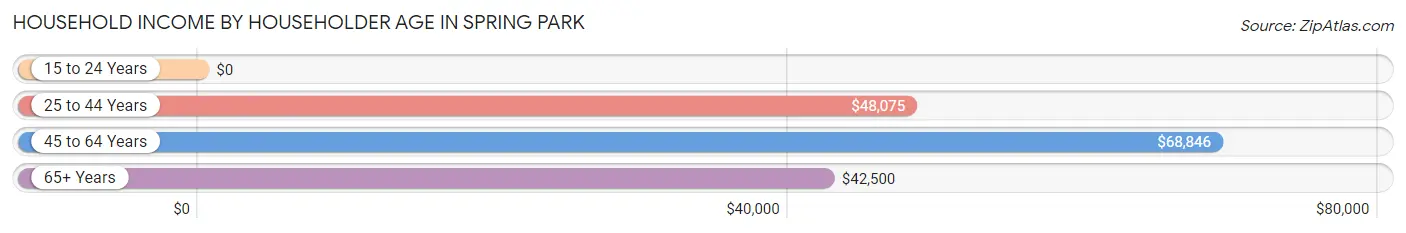
| Income Bracket | # Households | Median Income |
| 15 to 24 Years | 11 (0.9%) | $0 |
| 25 to 44 Years | 395 (32.4%) | $48,075 |
| 45 to 64 Years | 342 (28.0%) | $68,846 |
| 65+ Years | 472 (38.7%) | $42,500 |
| Total | 1,220 (100.0%) | $48,684 |
Poverty in Spring Park
Income Below Poverty by Sex and Age in Spring Park
With 6.2% poverty level for males and 10.9% for females among the residents of Spring Park, under 5 year old males and 18 to 24 year old females are the most vulnerable to poverty, with 7 males (100.0%) and 19 females (55.9%) in their respective age groups living below the poverty level.
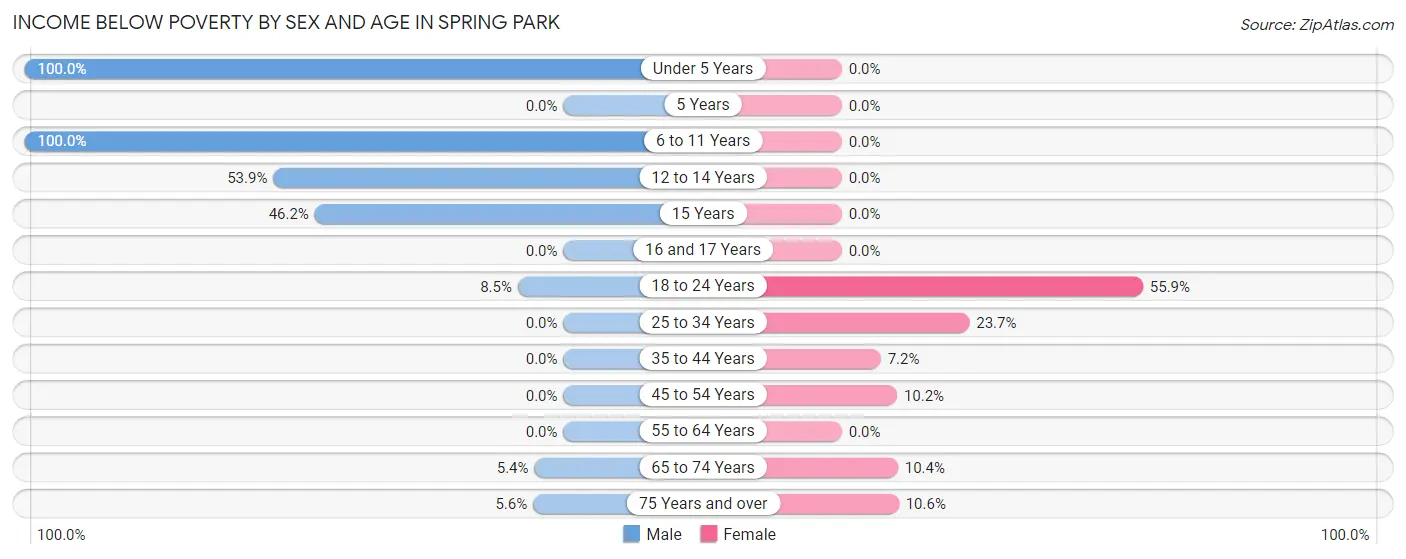
| Age Bracket | Male | Female |
| Under 5 Years | 7 (100.0%) | 0 (0.0%) |
| 5 Years | 0 (0.0%) | 0 (0.0%) |
| 6 to 11 Years | 13 (100.0%) | 0 (0.0%) |
| 12 to 14 Years | 7 (53.8%) | 0 (0.0%) |
| 15 Years | 6 (46.2%) | 0 (0.0%) |
| 16 and 17 Years | 0 (0.0%) | 0 (0.0%) |
| 18 to 24 Years | 6 (8.5%) | 19 (55.9%) |
| 25 to 34 Years | 0 (0.0%) | 31 (23.7%) |
| 35 to 44 Years | 0 (0.0%) | 7 (7.2%) |
| 45 to 54 Years | 0 (0.0%) | 13 (10.2%) |
| 55 to 64 Years | 0 (0.0%) | 0 (0.0%) |
| 65 to 74 Years | 5 (5.4%) | 8 (10.4%) |
| 75 Years and over | 8 (5.6%) | 26 (10.6%) |
| Total | 52 (6.2%) | 104 (10.9%) |
Income Above Poverty by Sex and Age in Spring Park
According to the poverty statistics in Spring Park, males aged 16 and 17 years and females aged under 5 years are the age groups that are most secure financially, with 100.0% of males and 100.0% of females in these age groups living above the poverty line.
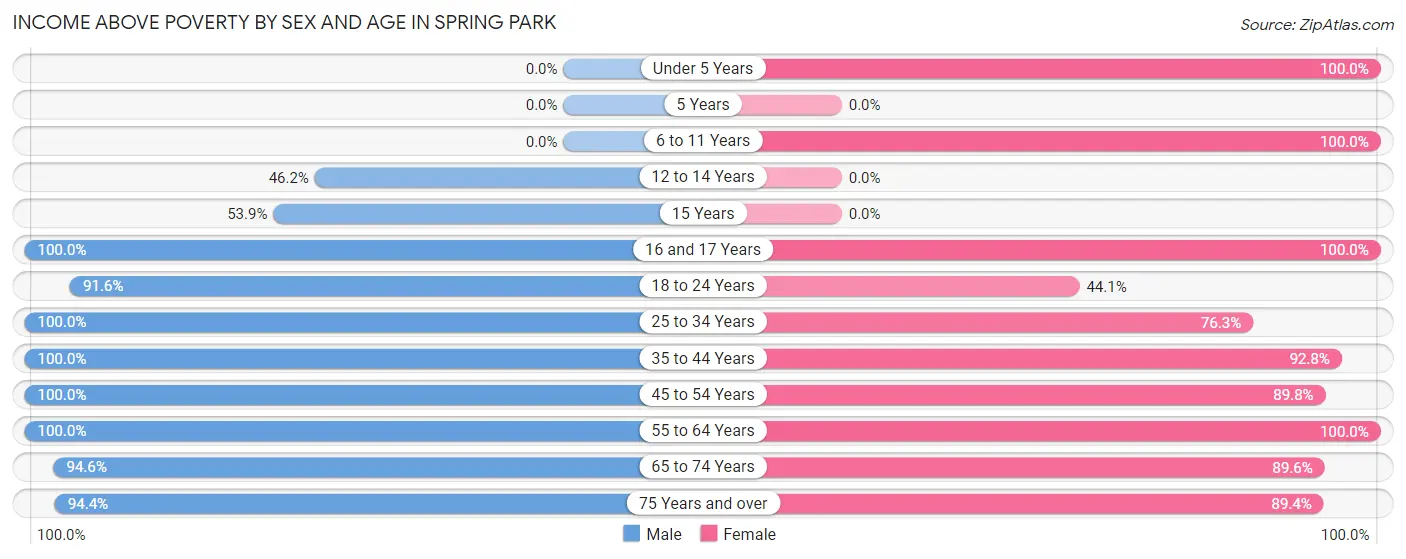
| Age Bracket | Male | Female |
| Under 5 Years | 0 (0.0%) | 15 (100.0%) |
| 5 Years | 0 (0.0%) | 0 (0.0%) |
| 6 to 11 Years | 0 (0.0%) | 48 (100.0%) |
| 12 to 14 Years | 6 (46.2%) | 0 (0.0%) |
| 15 Years | 7 (53.8%) | 0 (0.0%) |
| 16 and 17 Years | 38 (100.0%) | 12 (100.0%) |
| 18 to 24 Years | 65 (91.5%) | 15 (44.1%) |
| 25 to 34 Years | 78 (100.0%) | 100 (76.3%) |
| 35 to 44 Years | 187 (100.0%) | 90 (92.8%) |
| 45 to 54 Years | 54 (100.0%) | 114 (89.8%) |
| 55 to 64 Years | 135 (100.0%) | 164 (100.0%) |
| 65 to 74 Years | 88 (94.6%) | 69 (89.6%) |
| 75 Years and over | 134 (94.4%) | 220 (89.4%) |
| Total | 792 (93.8%) | 847 (89.1%) |
Income Below Poverty Among Married-Couple Families in Spring Park
The poverty statistics for married-couple families in Spring Park show that 3.9% or 8 of the total 207 families live below the poverty line. Families with no children have the highest poverty rate of 4.0%, comprising of 8 families. On the other hand, families with 3 or 4 children have the lowest poverty rate of 0.0%, which includes 0 families.
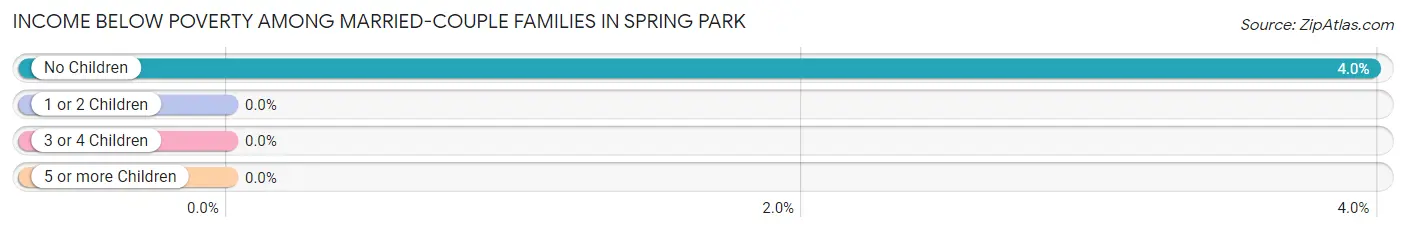
| Children | Above Poverty | Below Poverty |
| No Children | 193 (96.0%) | 8 (4.0%) |
| 1 or 2 Children | 0 (0.0%) | 0 (0.0%) |
| 3 or 4 Children | 6 (100.0%) | 0 (0.0%) |
| 5 or more Children | 0 (0.0%) | 0 (0.0%) |
| Total | 199 (96.1%) | 8 (3.9%) |
Income Below Poverty Among Single-Parent Households in Spring Park
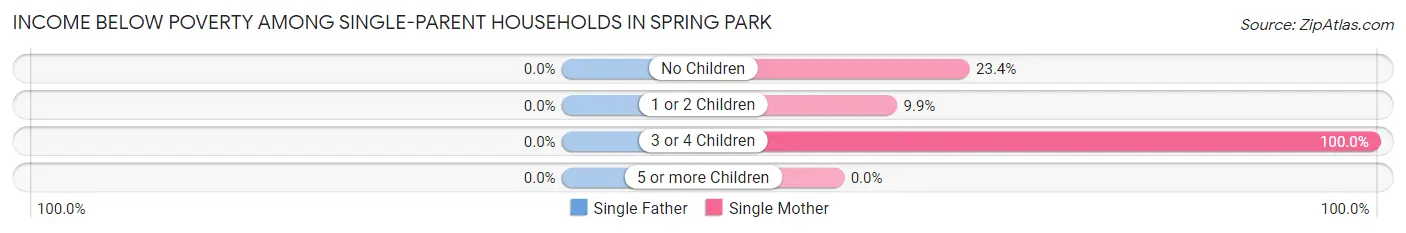
| Children | Single Father | Single Mother |
| No Children | 0 (0.0%) | 25 (23.4%) |
| 1 or 2 Children | 0 (0.0%) | 7 (9.9%) |
| 3 or 4 Children | 0 (0.0%) | 7 (100.0%) |
| 5 or more Children | 0 (0.0%) | 0 (0.0%) |
| Total | 0 (0.0%) | 39 (21.1%) |
Income Below Poverty Among Married-Couple vs Single-Parent Households in Spring Park
The poverty data for Spring Park shows that 8 of the married-couple family households (3.9%) and 39 of the single-parent households (21.1%) are living below the poverty level. Within the married-couple family households, those with no children have the highest poverty rate, with 8 households (4.0%) falling below the poverty line. Among the single-parent households, those with 3 or 4 children have the highest poverty rate, with 7 household (100.0%) living below poverty.
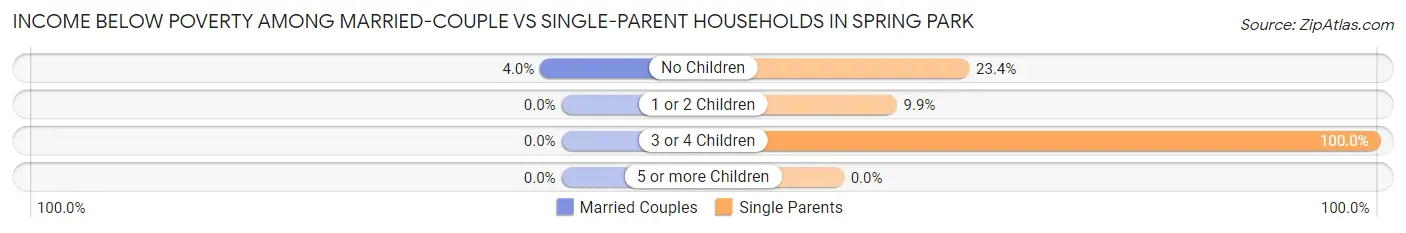
| Children | Married-Couple Families | Single-Parent Households |
| No Children | 8 (4.0%) | 25 (23.4%) |
| 1 or 2 Children | 0 (0.0%) | 7 (9.9%) |
| 3 or 4 Children | 0 (0.0%) | 7 (100.0%) |
| 5 or more Children | 0 (0.0%) | 0 (0.0%) |
| Total | 8 (3.9%) | 39 (21.1%) |
Race in Spring Park
The most populous races in Spring Park are White / Caucasian (1,608 | 83.8%), Black / African American (155 | 8.1%), and Native / Alaskan (50 | 2.6%).
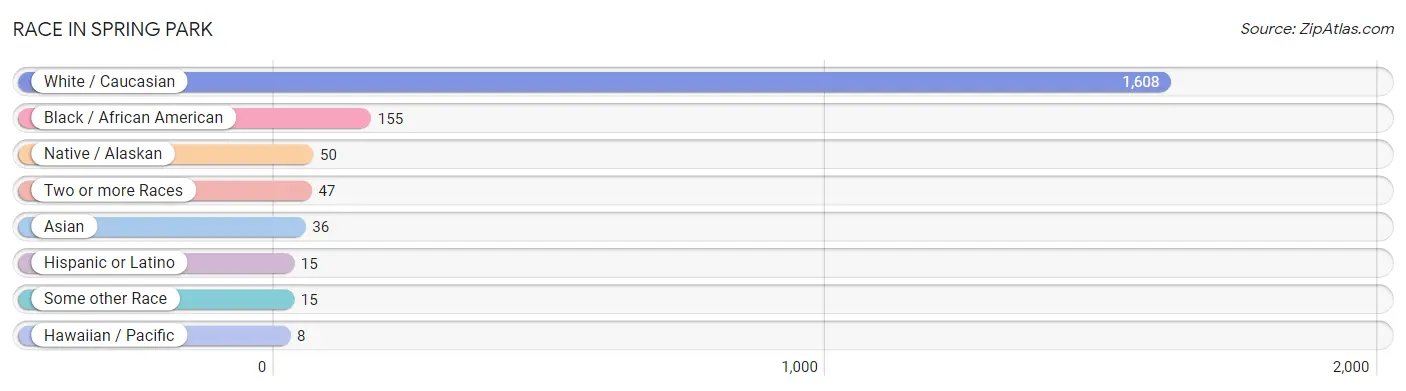
| Race | # Population | % Population |
| Asian | 36 | 1.9% |
| Black / African American | 155 | 8.1% |
| Hawaiian / Pacific | 8 | 0.4% |
| Hispanic or Latino | 15 | 0.8% |
| Native / Alaskan | 50 | 2.6% |
| White / Caucasian | 1,608 | 83.8% |
| Two or more Races | 47 | 2.5% |
| Some other Race | 15 | 0.8% |
| Total | 1,919 | 100.0% |
Ancestry in Spring Park
The most populous ancestries reported in Spring Park are German (439 | 22.9%), Norwegian (301 | 15.7%), Swedish (229 | 11.9%), English (199 | 10.4%), and Subsaharan African (139 | 7.2%), together accounting for 68.1% of all Spring Park residents.
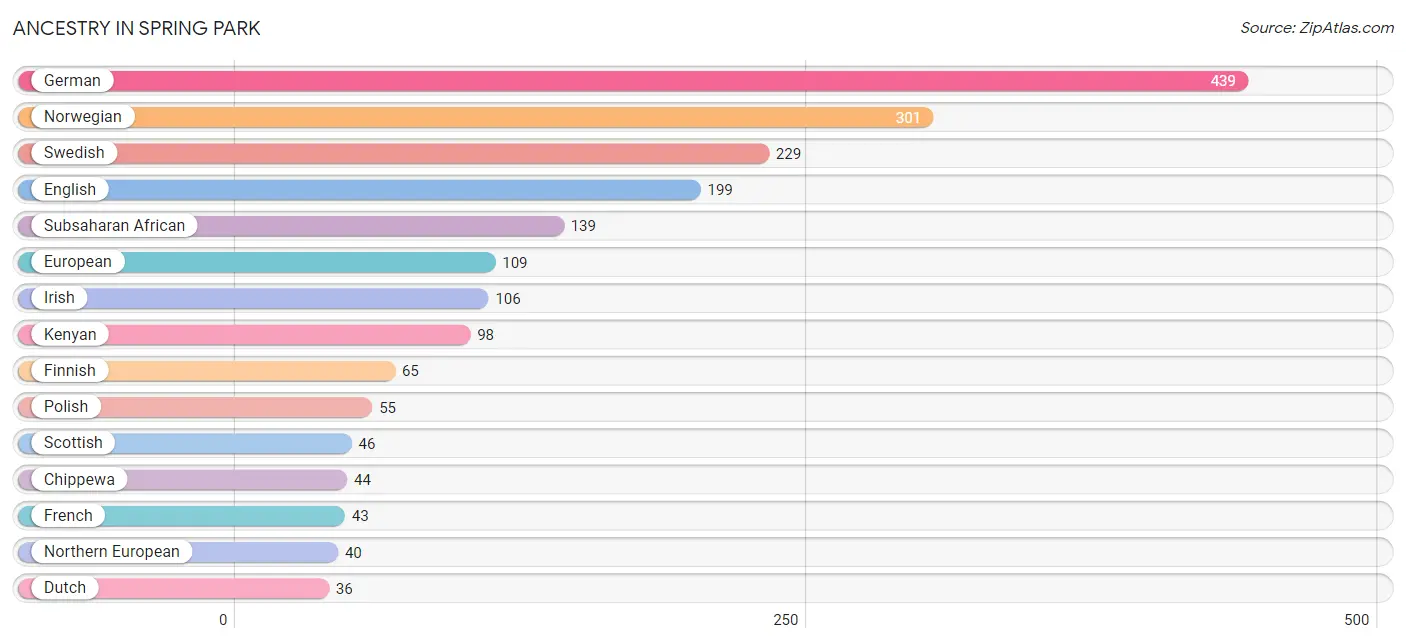
| Ancestry | # Population | % Population |
| African | 11 | 0.6% |
| American | 18 | 0.9% |
| Arab | 7 | 0.4% |
| Austrian | 5 | 0.3% |
| Bangladeshi | 9 | 0.5% |
| British | 18 | 0.9% |
| Chippewa | 44 | 2.3% |
| Czech | 8 | 0.4% |
| Danish | 22 | 1.1% |
| Dutch | 36 | 1.9% |
| English | 199 | 10.4% |
| Ethiopian | 8 | 0.4% |
| European | 109 | 5.7% |
| Finnish | 65 | 3.4% |
| French | 43 | 2.2% |
| French Canadian | 2 | 0.1% |
| German | 439 | 22.9% |
| Greek | 5 | 0.3% |
| Indian (Asian) | 2 | 0.1% |
| Irish | 106 | 5.5% |
| Italian | 14 | 0.7% |
| Kenyan | 98 | 5.1% |
| Korean | 10 | 0.5% |
| Lebanese | 7 | 0.4% |
| Mexican | 9 | 0.5% |
| Native Hawaiian | 8 | 0.4% |
| Northern European | 40 | 2.1% |
| Norwegian | 301 | 15.7% |
| Polish | 55 | 2.9% |
| Portuguese | 9 | 0.5% |
| Russian | 5 | 0.3% |
| Scandinavian | 22 | 1.1% |
| Scotch-Irish | 7 | 0.4% |
| Scottish | 46 | 2.4% |
| Somali | 22 | 1.1% |
| Spaniard | 6 | 0.3% |
| Sri Lankan | 7 | 0.4% |
| Subsaharan African | 139 | 7.2% |
| Swedish | 229 | 11.9% |
| Thai | 12 | 0.6% |
| Welsh | 5 | 0.3% | View All 41 Rows |
Immigrants in Spring Park
The most numerous immigrant groups reported in Spring Park came from Africa (124 | 6.5%), Eastern Africa (124 | 6.5%), Kenya (109 | 5.7%), Asia (24 | 1.3%), and Europe (17 | 0.9%), together accounting for 20.7% of all Spring Park residents.
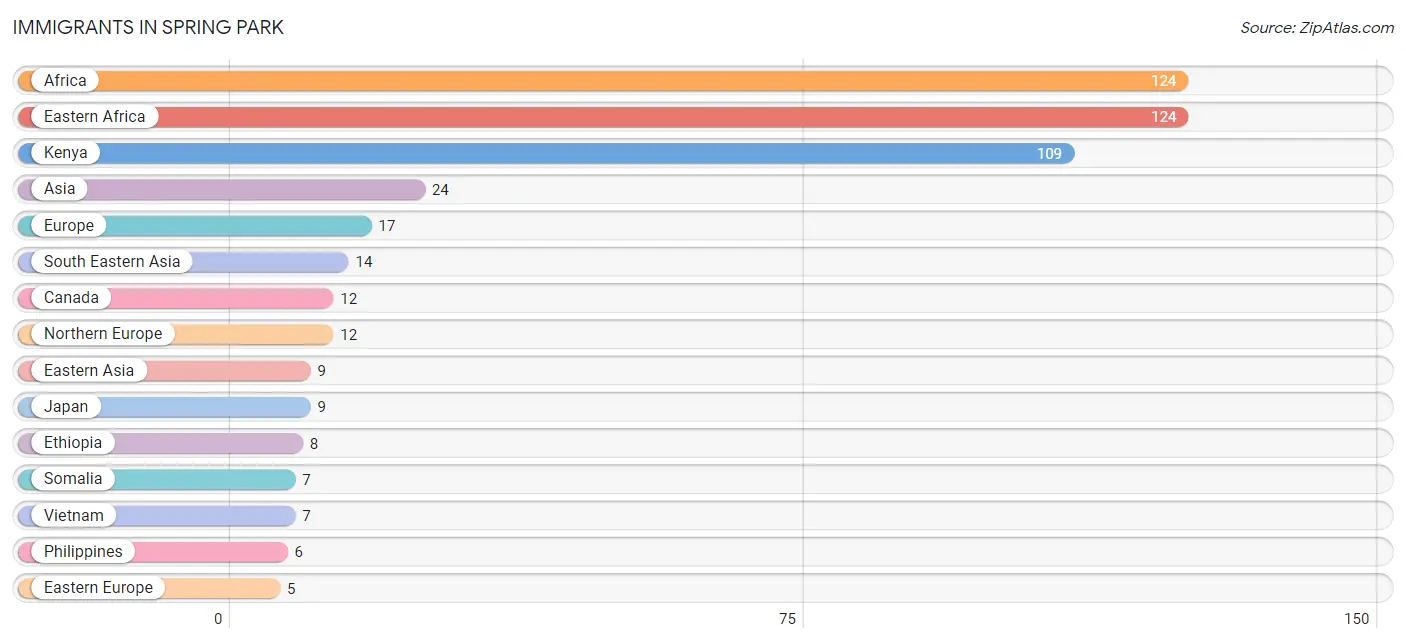
| Immigration Origin | # Population | % Population |
| Africa | 124 | 6.5% |
| Asia | 24 | 1.3% |
| Canada | 12 | 0.6% |
| Eastern Africa | 124 | 6.5% |
| Eastern Asia | 9 | 0.5% |
| Eastern Europe | 5 | 0.3% |
| Ethiopia | 8 | 0.4% |
| Europe | 17 | 0.9% |
| India | 1 | 0.1% |
| Japan | 9 | 0.5% |
| Kenya | 109 | 5.7% |
| Laos | 1 | 0.1% |
| Northern Europe | 12 | 0.6% |
| Philippines | 6 | 0.3% |
| Russia | 5 | 0.3% |
| Somalia | 7 | 0.4% |
| South Central Asia | 1 | 0.1% |
| South Eastern Asia | 14 | 0.7% |
| Vietnam | 7 | 0.4% | View All 19 Rows |
Sex and Age in Spring Park
Sex and Age in Spring Park
The most populous age groups in Spring Park are 40 to 44 Years (131 | 14.4%) for men and 85 Years and over (172 | 17.0%) for women.
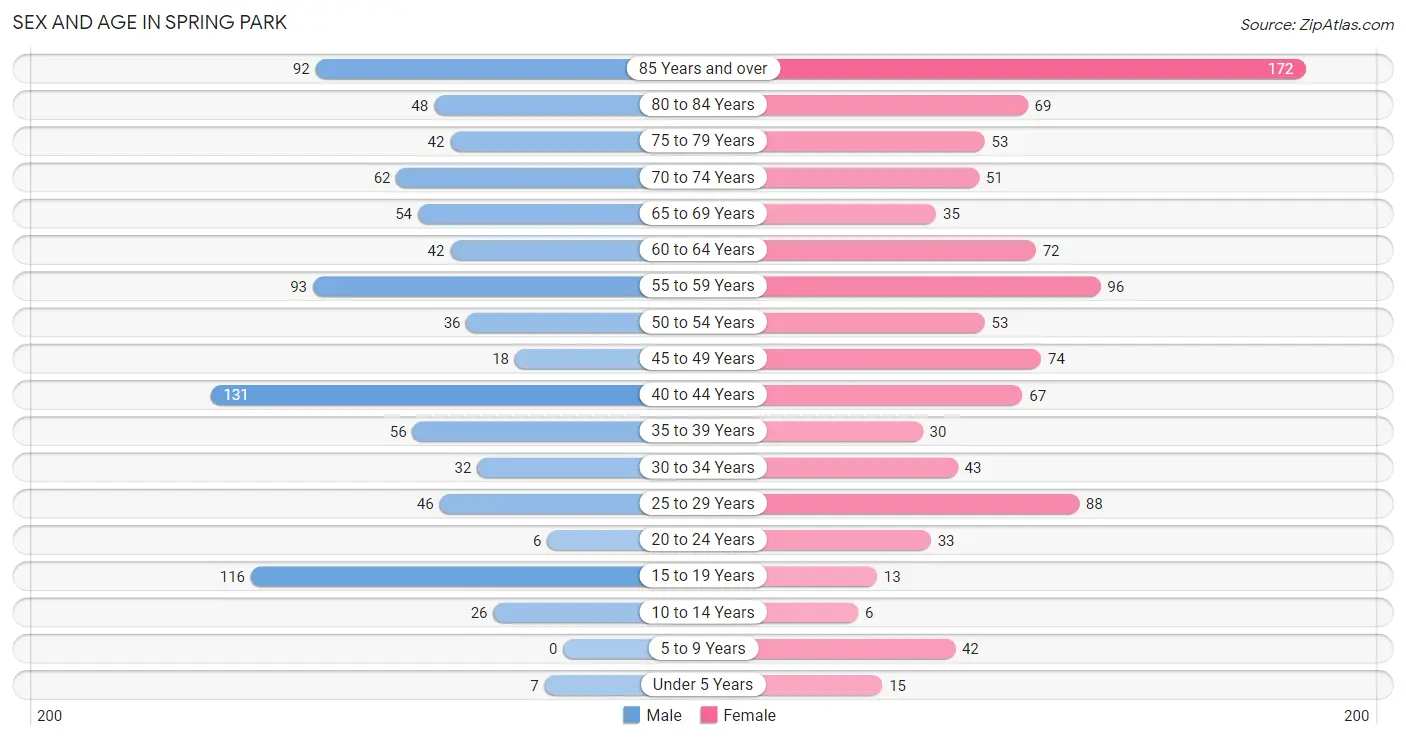
| Age Bracket | Male | Female |
| Under 5 Years | 7 (0.8%) | 15 (1.5%) |
| 5 to 9 Years | 0 (0.0%) | 42 (4.2%) |
| 10 to 14 Years | 26 (2.9%) | 6 (0.6%) |
| 15 to 19 Years | 116 (12.8%) | 13 (1.3%) |
| 20 to 24 Years | 6 (0.7%) | 33 (3.3%) |
| 25 to 29 Years | 46 (5.1%) | 88 (8.7%) |
| 30 to 34 Years | 32 (3.5%) | 43 (4.3%) |
| 35 to 39 Years | 56 (6.2%) | 30 (3.0%) |
| 40 to 44 Years | 131 (14.4%) | 67 (6.6%) |
| 45 to 49 Years | 18 (2.0%) | 74 (7.3%) |
| 50 to 54 Years | 36 (4.0%) | 53 (5.2%) |
| 55 to 59 Years | 93 (10.2%) | 96 (9.5%) |
| 60 to 64 Years | 42 (4.6%) | 72 (7.1%) |
| 65 to 69 Years | 54 (5.9%) | 35 (3.5%) |
| 70 to 74 Years | 62 (6.8%) | 51 (5.0%) |
| 75 to 79 Years | 42 (4.6%) | 53 (5.2%) |
| 80 to 84 Years | 48 (5.3%) | 69 (6.8%) |
| 85 Years and over | 92 (10.1%) | 172 (17.0%) |
| Total | 907 (100.0%) | 1,012 (100.0%) |
Families and Households in Spring Park
Median Family Size in Spring Park
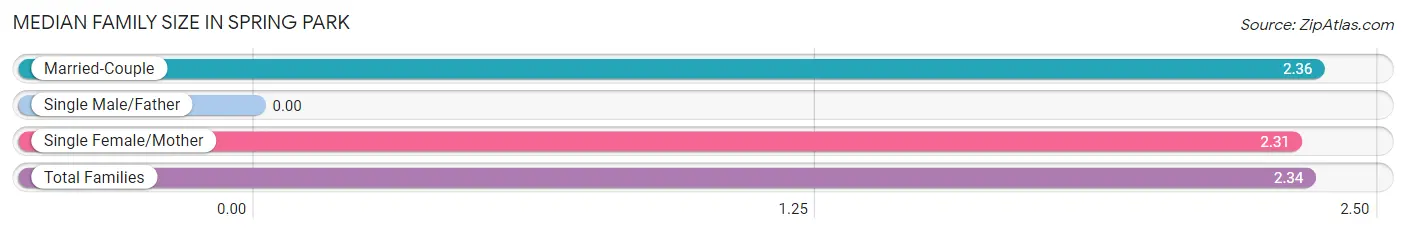
| Family Type | # Families | Family Size |
| Married-Couple | 207 (52.8%) | 2.36 |
| Single Male/Father | 0 (0.0%) | - |
| Single Female/Mother | 185 (47.2%) | 2.31 |
| Total Families | 392 (100.0%) | 2.34 |
Median Household Size in Spring Park
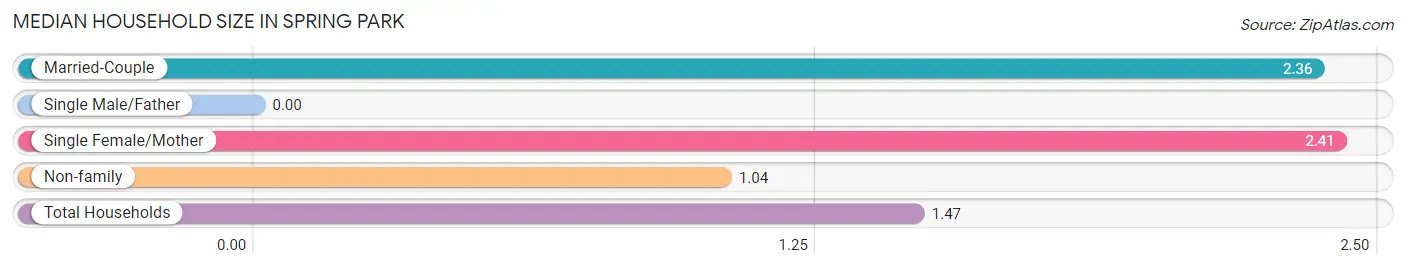
| Household Type | # Households | Household Size |
| Married-Couple | 207 (17.0%) | 2.36 |
| Single Male/Father | 0 (0.0%) | - |
| Single Female/Mother | 185 (15.2%) | 2.41 |
| Non-family | 828 (67.9%) | 1.04 |
| Total Households | 1,220 (100.0%) | 1.47 |
Household Size by Marriage Status in Spring Park
Out of a total of 1,220 households in Spring Park, 392 (32.1%) are family households, while 828 (67.9%) are nonfamily households. The most numerous type of family households are 2-person households, comprising 274, and the most common type of nonfamily households are 1-person households, comprising 795.
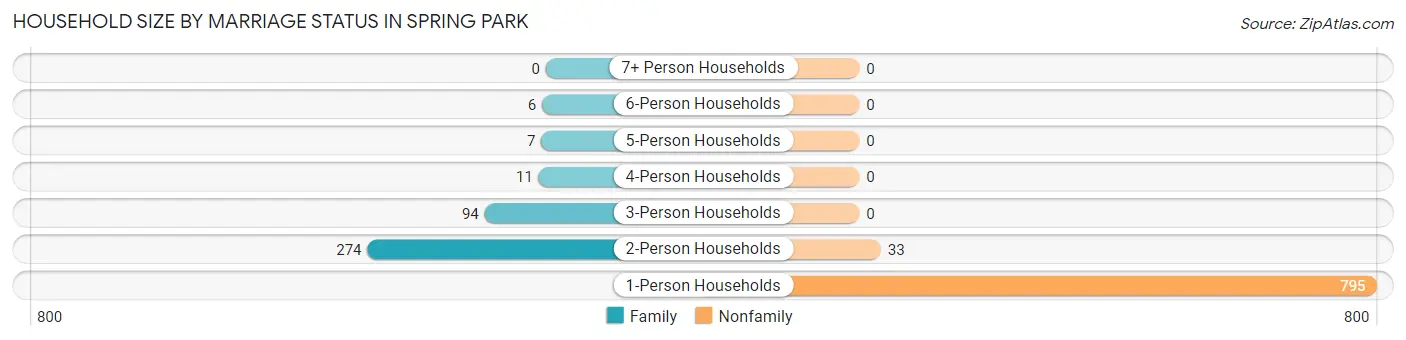
| Household Size | Family Households | Nonfamily Households |
| 1-Person Households | - | 795 (65.2%) |
| 2-Person Households | 274 (22.5%) | 33 (2.7%) |
| 3-Person Households | 94 (7.7%) | 0 (0.0%) |
| 4-Person Households | 11 (0.9%) | 0 (0.0%) |
| 5-Person Households | 7 (0.6%) | 0 (0.0%) |
| 6-Person Households | 6 (0.5%) | 0 (0.0%) |
| 7+ Person Households | 0 (0.0%) | 0 (0.0%) |
| Total | 392 (32.1%) | 828 (67.9%) |
Female Fertility in Spring Park
Fertility by Age in Spring Park
Average fertility rate in Spring Park is 20.0 births per 1,000 women. Women in the age bracket of 35 to 50 years have the highest fertility rate with 40.0 births per 1,000 women. Women in the age bracket of 35 to 50 years acount for 100.0% of all women with births.
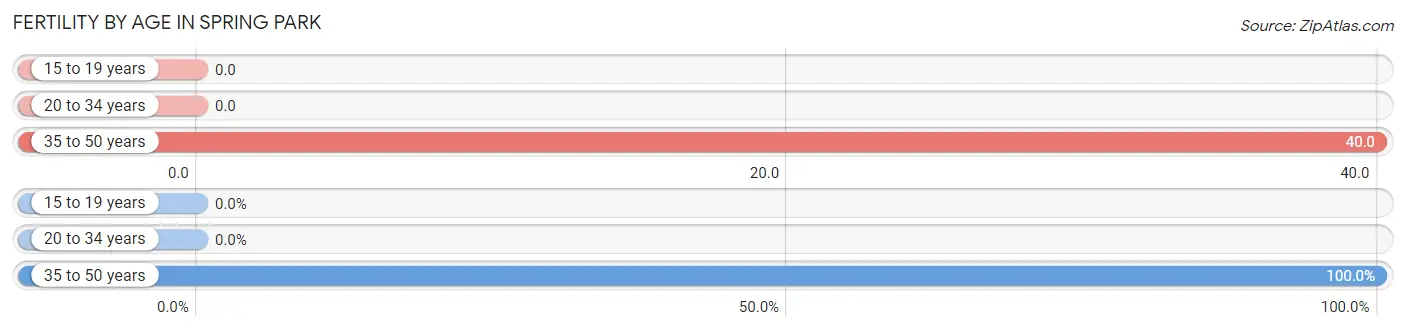
| Age Bracket | Women with Births | Births / 1,000 Women |
| 15 to 19 years | 0 (0.0%) | 0.0 |
| 20 to 34 years | 0 (0.0%) | 0.0 |
| 35 to 50 years | 7 (100.0%) | 40.0 |
| Total | 7 (100.0%) | 20.0 |
Fertility by Age by Marriage Status in Spring Park
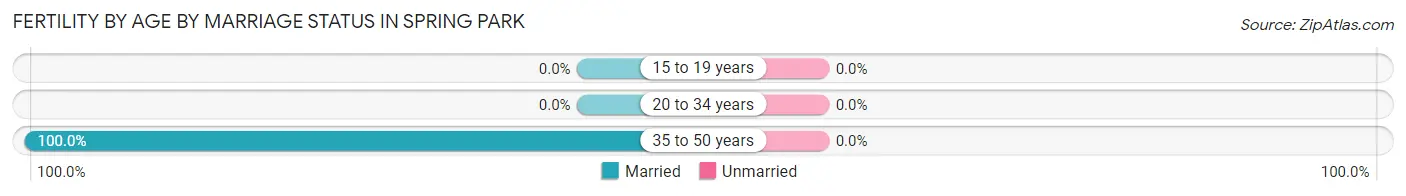
| Age Bracket | Married | Unmarried |
| 15 to 19 years | 0 (0.0%) | 0 (0.0%) |
| 20 to 34 years | 0 (0.0%) | 0 (0.0%) |
| 35 to 50 years | 7 (100.0%) | 0 (0.0%) |
| Total | 7 (100.0%) | 0 (0.0%) |
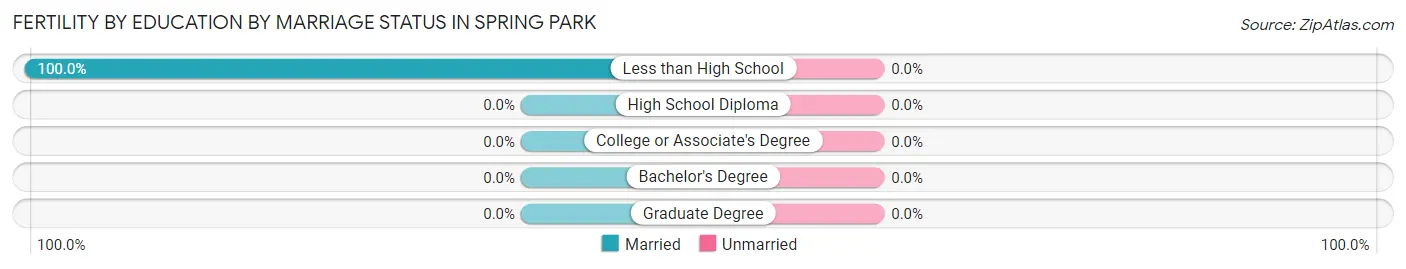
Fertility by Education in Spring Park
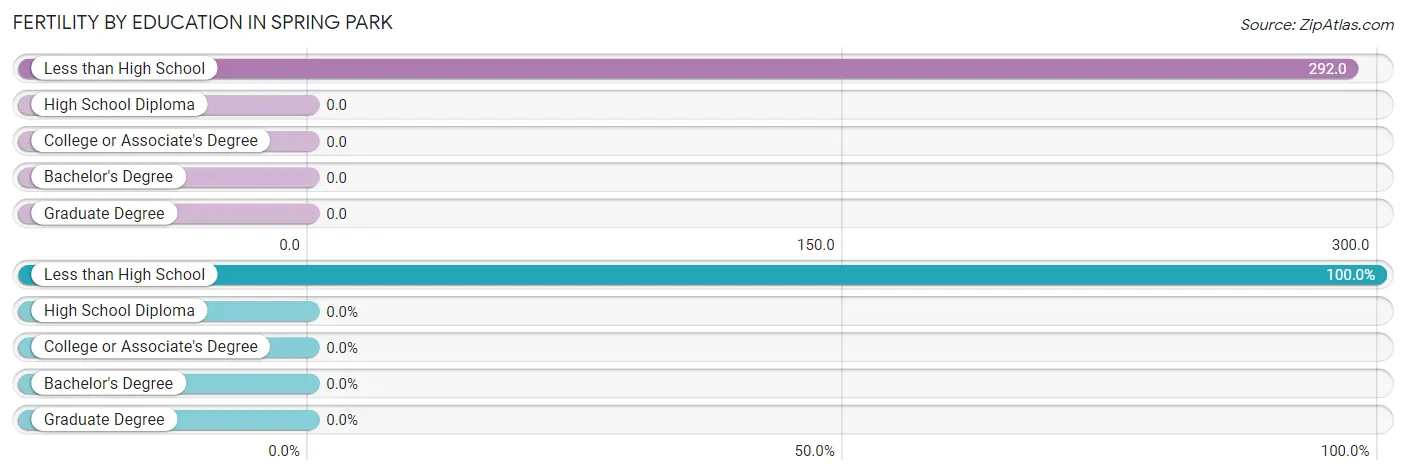
| Educational Attainment | Women with Births | Births / 1,000 Women |
| Less than High School | 7 (100.0%) | 292.0 |
| High School Diploma | 0 (0.0%) | 0.0 |
| College or Associate's Degree | 0 (0.0%) | 0.0 |
| Bachelor's Degree | 0 (0.0%) | 0.0 |
| Graduate Degree | 0 (0.0%) | 0.0 |
| Total | 7 (100.0%) | 20.0 |
Fertility by Education by Marriage Status in Spring Park
| Educational Attainment | Married | Unmarried |
| Less than High School | 7 (100.0%) | 0 (0.0%) |
| High School Diploma | 0 (0.0%) | 0 (0.0%) |
| College or Associate's Degree | 0 (0.0%) | 0 (0.0%) |
| Bachelor's Degree | 0 (0.0%) | 0 (0.0%) |
| Graduate Degree | 0 (0.0%) | 0 (0.0%) |
| Total | 7 (100.0%) | 0 (0.0%) |
Employment Characteristics in Spring Park
Employment by Class of Employer in Spring Park
Among the 947 employed individuals in Spring Park, private company employees (729 | 77.0%), not-for-profit organizations (63 | 6.7%), and self-employed (incorporated) (57 | 6.0%) make up the most common classes of employment.
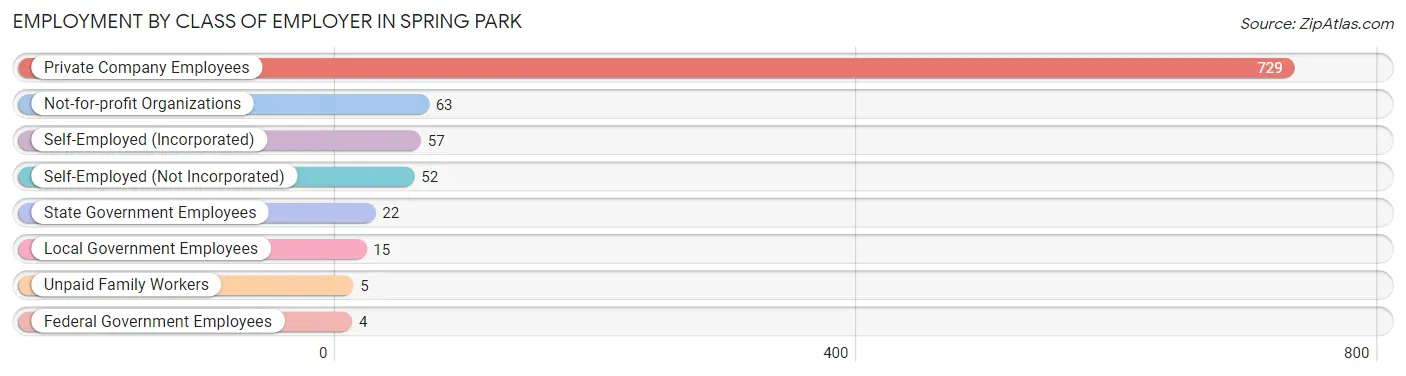
| Employer Class | # Employees | % Employees |
| Private Company Employees | 729 | 77.0% |
| Self-Employed (Incorporated) | 57 | 6.0% |
| Self-Employed (Not Incorporated) | 52 | 5.5% |
| Not-for-profit Organizations | 63 | 6.7% |
| Local Government Employees | 15 | 1.6% |
| State Government Employees | 22 | 2.3% |
| Federal Government Employees | 4 | 0.4% |
| Unpaid Family Workers | 5 | 0.5% |
| Total | 947 | 100.0% |
Employment Status by Age in Spring Park
According to the labor force statistics for Spring Park, out of the total population over 16 years of age (1,810), 56.6% or 1,024 individuals are in the labor force, with 3.5% or 36 of them unemployed. The age group with the highest labor force participation rate is 55 to 59 years, with 100.0% or 189 individuals in the labor force. Within the labor force, the 16 to 19 years age range has the highest percentage of unemployed individuals, with 21.4% or 6 of them being unemployed.
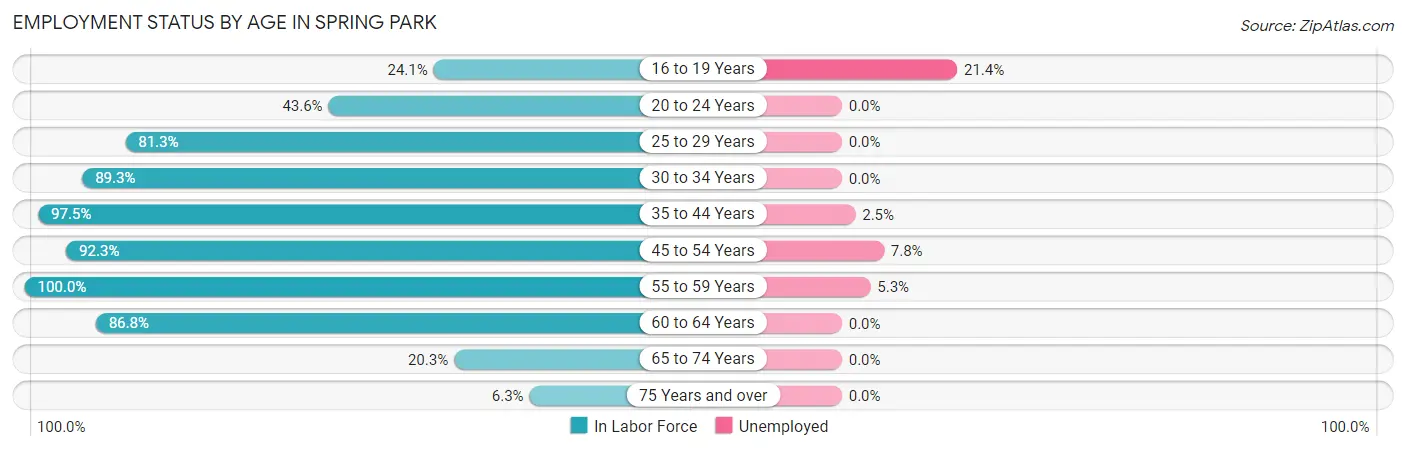
| Age Bracket | In Labor Force | Unemployed |
| 16 to 19 Years | 28 (24.1%) | 6 (21.4%) |
| 20 to 24 Years | 17 (43.6%) | 0 (0.0%) |
| 25 to 29 Years | 109 (81.3%) | 0 (0.0%) |
| 30 to 34 Years | 67 (89.3%) | 0 (0.0%) |
| 35 to 44 Years | 277 (97.5%) | 7 (2.5%) |
| 45 to 54 Years | 167 (92.3%) | 13 (7.8%) |
| 55 to 59 Years | 189 (100.0%) | 10 (5.3%) |
| 60 to 64 Years | 99 (86.8%) | 0 (0.0%) |
| 65 to 74 Years | 41 (20.3%) | 0 (0.0%) |
| 75 Years and over | 30 (6.3%) | 0 (0.0%) |
| Total | 1,024 (56.6%) | 36 (3.5%) |
Employment Status by Educational Attainment in Spring Park
According to labor force statistics for Spring Park, 92.9% of individuals (908) out of the total population between 25 and 64 years of age (977) are in the labor force, with 3.3% or 30 of them being unemployed. The group with the highest labor force participation rate are those with the educational attainment of bachelor's degree or higher, with 97.0% or 260 individuals in the labor force. Within the labor force, individuals with less than high school education have the highest percentage of unemployment, with 33.3% or 7 of them being unemployed.
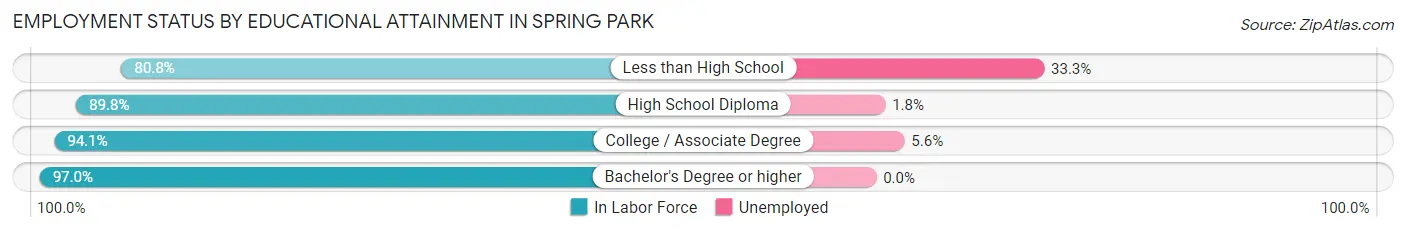
| Educational Attainment | In Labor Force | Unemployed |
| Less than High School | 21 (80.8%) | 9 (33.3%) |
| High School Diploma | 325 (89.8%) | 7 (1.8%) |
| College / Associate Degree | 302 (94.1%) | 18 (5.6%) |
| Bachelor's Degree or higher | 260 (97.0%) | 0 (0.0%) |
| Total | 908 (92.9%) | 32 (3.3%) |
Employment Occupations by Sex in Spring Park
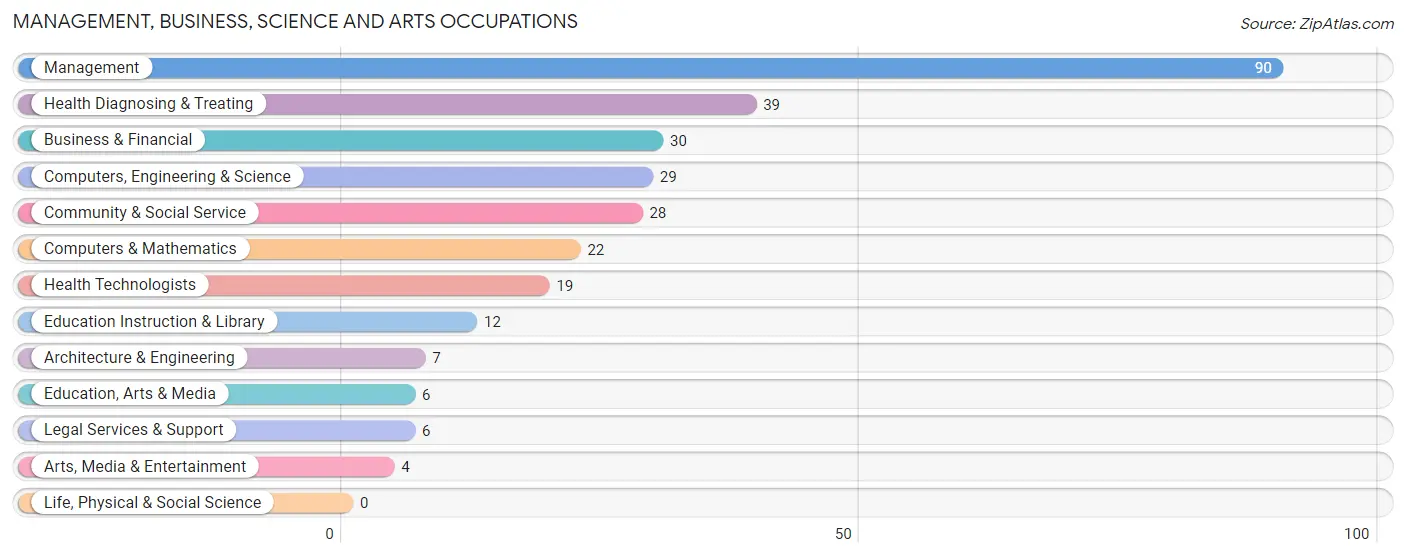
Management, Business, Science and Arts Occupations
The most common Management, Business, Science and Arts occupations in Spring Park are Management (90 | 9.1%), Health Diagnosing & Treating (39 | 4.0%), Business & Financial (30 | 3.0%), Computers, Engineering & Science (29 | 2.9%), and Community & Social Service (28 | 2.8%).
Management, Business, Science and Arts Occupations by Sex
Within the Management, Business, Science and Arts occupations in Spring Park, the most male-oriented occupations are Architecture & Engineering (100.0%), Legal Services & Support (100.0%), and Arts, Media & Entertainment (100.0%), while the most female-oriented occupations are Education, Arts & Media (100.0%), Education Instruction & Library (100.0%), and Health Technologists (100.0%).
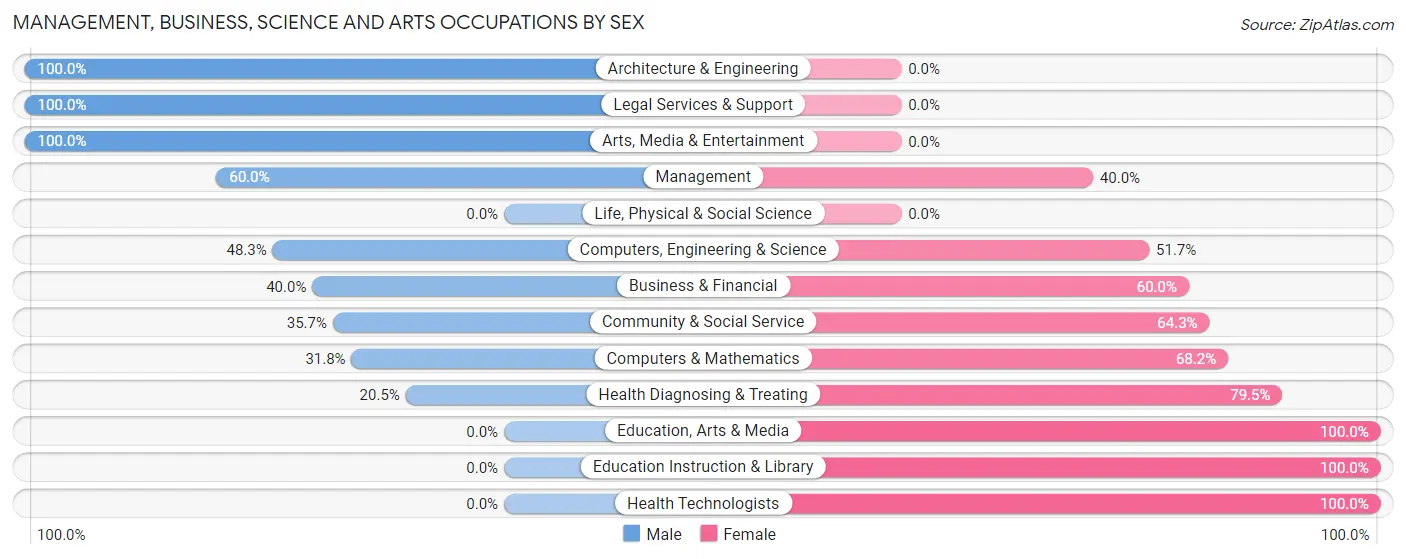
| Occupation | Male | Female |
| Management | 54 (60.0%) | 36 (40.0%) |
| Business & Financial | 12 (40.0%) | 18 (60.0%) |
| Computers, Engineering & Science | 14 (48.3%) | 15 (51.7%) |
| Computers & Mathematics | 7 (31.8%) | 15 (68.2%) |
| Architecture & Engineering | 7 (100.0%) | 0 (0.0%) |
| Life, Physical & Social Science | 0 (0.0%) | 0 (0.0%) |
| Community & Social Service | 10 (35.7%) | 18 (64.3%) |
| Education, Arts & Media | 0 (0.0%) | 6 (100.0%) |
| Legal Services & Support | 6 (100.0%) | 0 (0.0%) |
| Education Instruction & Library | 0 (0.0%) | 12 (100.0%) |
| Arts, Media & Entertainment | 4 (100.0%) | 0 (0.0%) |
| Health Diagnosing & Treating | 8 (20.5%) | 31 (79.5%) |
| Health Technologists | 0 (0.0%) | 19 (100.0%) |
| Total (Category) | 98 (45.4%) | 118 (54.6%) |
| Total (Overall) | 515 (52.1%) | 473 (47.9%) |
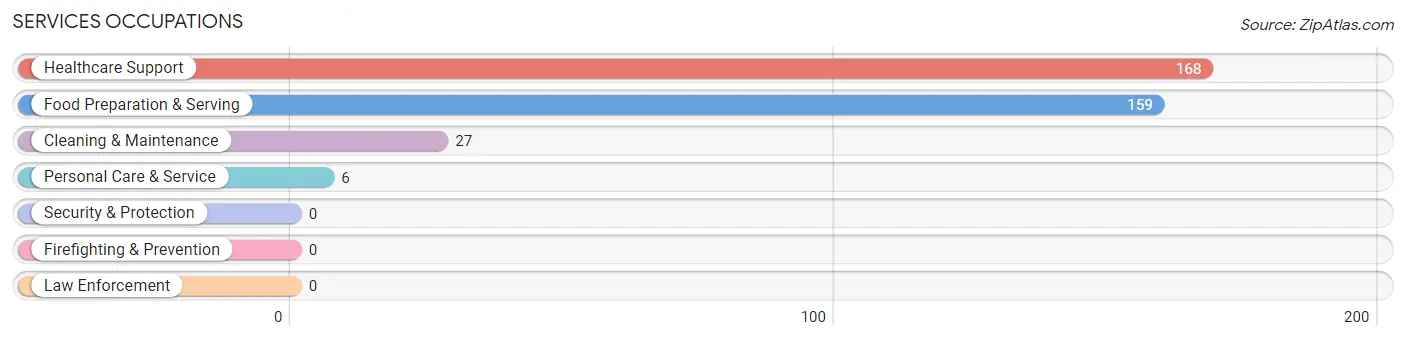
Services Occupations
The most common Services occupations in Spring Park are Healthcare Support (168 | 17.0%), Food Preparation & Serving (159 | 16.1%), Cleaning & Maintenance (27 | 2.7%), and Personal Care & Service (6 | 0.6%).
Services Occupations by Sex
Within the Services occupations in Spring Park, the most male-oriented occupations are Cleaning & Maintenance (81.5%), Healthcare Support (58.3%), and Food Preparation & Serving (32.1%), while the most female-oriented occupations are Personal Care & Service (100.0%), Food Preparation & Serving (67.9%), and Healthcare Support (41.7%).
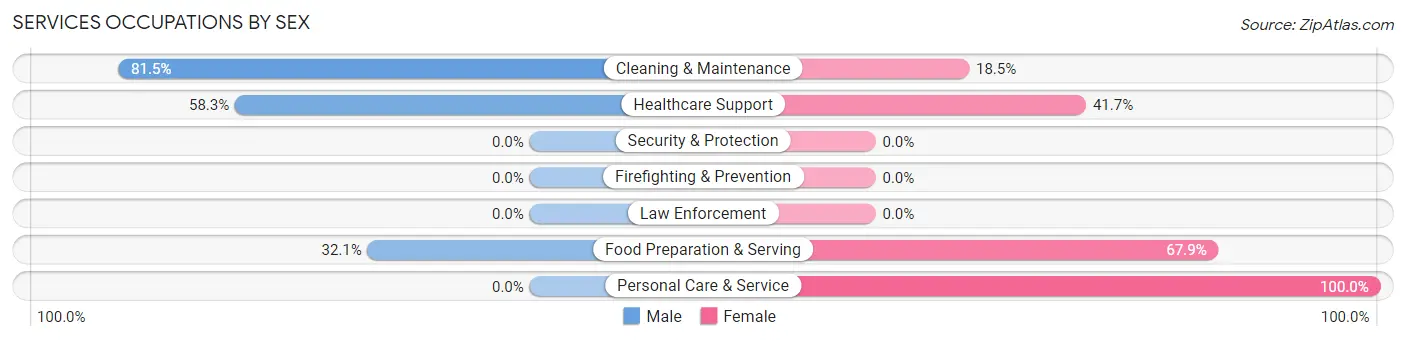
| Occupation | Male | Female |
| Healthcare Support | 98 (58.3%) | 70 (41.7%) |
| Security & Protection | 0 (0.0%) | 0 (0.0%) |
| Firefighting & Prevention | 0 (0.0%) | 0 (0.0%) |
| Law Enforcement | 0 (0.0%) | 0 (0.0%) |
| Food Preparation & Serving | 51 (32.1%) | 108 (67.9%) |
| Cleaning & Maintenance | 22 (81.5%) | 5 (18.5%) |
| Personal Care & Service | 0 (0.0%) | 6 (100.0%) |
| Total (Category) | 171 (47.5%) | 189 (52.5%) |
| Total (Overall) | 515 (52.1%) | 473 (47.9%) |
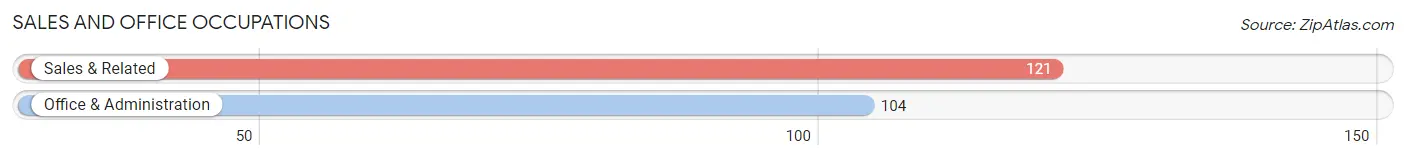
Sales and Office Occupations
The most common Sales and Office occupations in Spring Park are Sales & Related (121 | 12.2%), and Office & Administration (104 | 10.5%).
Sales and Office Occupations by Sex
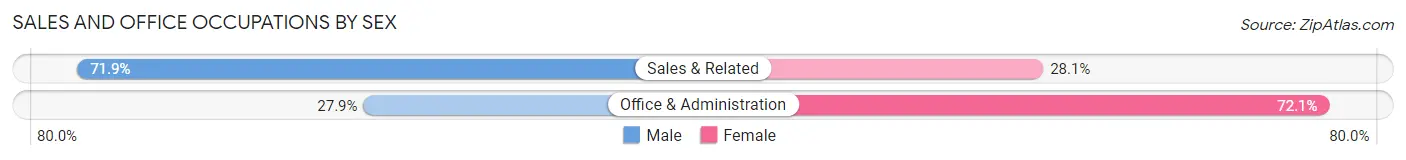
| Occupation | Male | Female |
| Sales & Related | 87 (71.9%) | 34 (28.1%) |
| Office & Administration | 29 (27.9%) | 75 (72.1%) |
| Total (Category) | 116 (51.6%) | 109 (48.4%) |
| Total (Overall) | 515 (52.1%) | 473 (47.9%) |
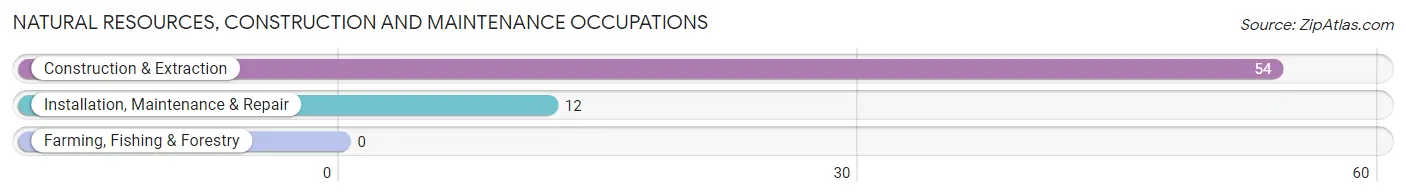
Natural Resources, Construction and Maintenance Occupations
The most common Natural Resources, Construction and Maintenance occupations in Spring Park are Construction & Extraction (54 | 5.5%), and Installation, Maintenance & Repair (12 | 1.2%).
Natural Resources, Construction and Maintenance Occupations by Sex
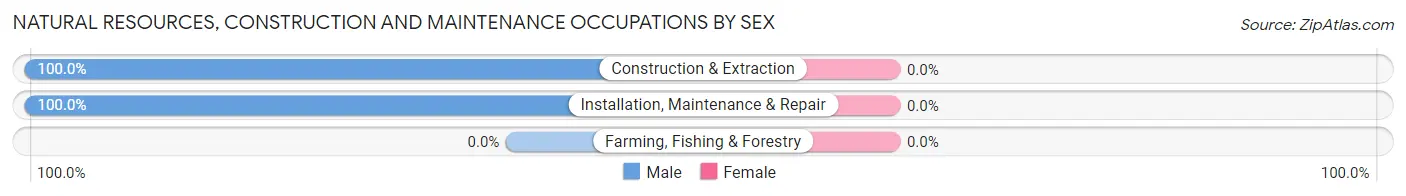
| Occupation | Male | Female |
| Farming, Fishing & Forestry | 0 (0.0%) | 0 (0.0%) |
| Construction & Extraction | 54 (100.0%) | 0 (0.0%) |
| Installation, Maintenance & Repair | 12 (100.0%) | 0 (0.0%) |
| Total (Category) | 66 (100.0%) | 0 (0.0%) |
| Total (Overall) | 515 (52.1%) | 473 (47.9%) |
Production, Transportation and Moving Occupations
The most common Production, Transportation and Moving occupations in Spring Park are Transportation (59 | 6.0%), Material Moving (37 | 3.7%), and Production (25 | 2.5%).
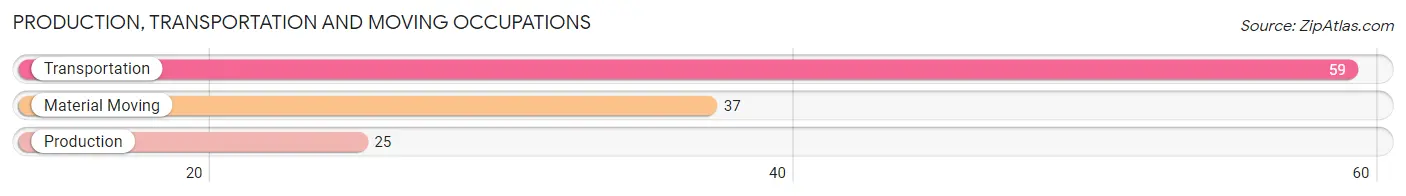
Production, Transportation and Moving Occupations by Sex
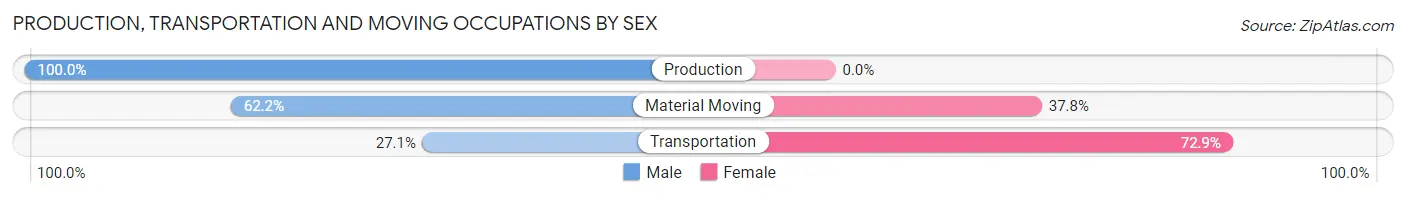
| Occupation | Male | Female |
| Production | 25 (100.0%) | 0 (0.0%) |
| Transportation | 16 (27.1%) | 43 (72.9%) |
| Material Moving | 23 (62.2%) | 14 (37.8%) |
| Total (Category) | 64 (52.9%) | 57 (47.1%) |
| Total (Overall) | 515 (52.1%) | 473 (47.9%) |
Employment Industries by Sex in Spring Park
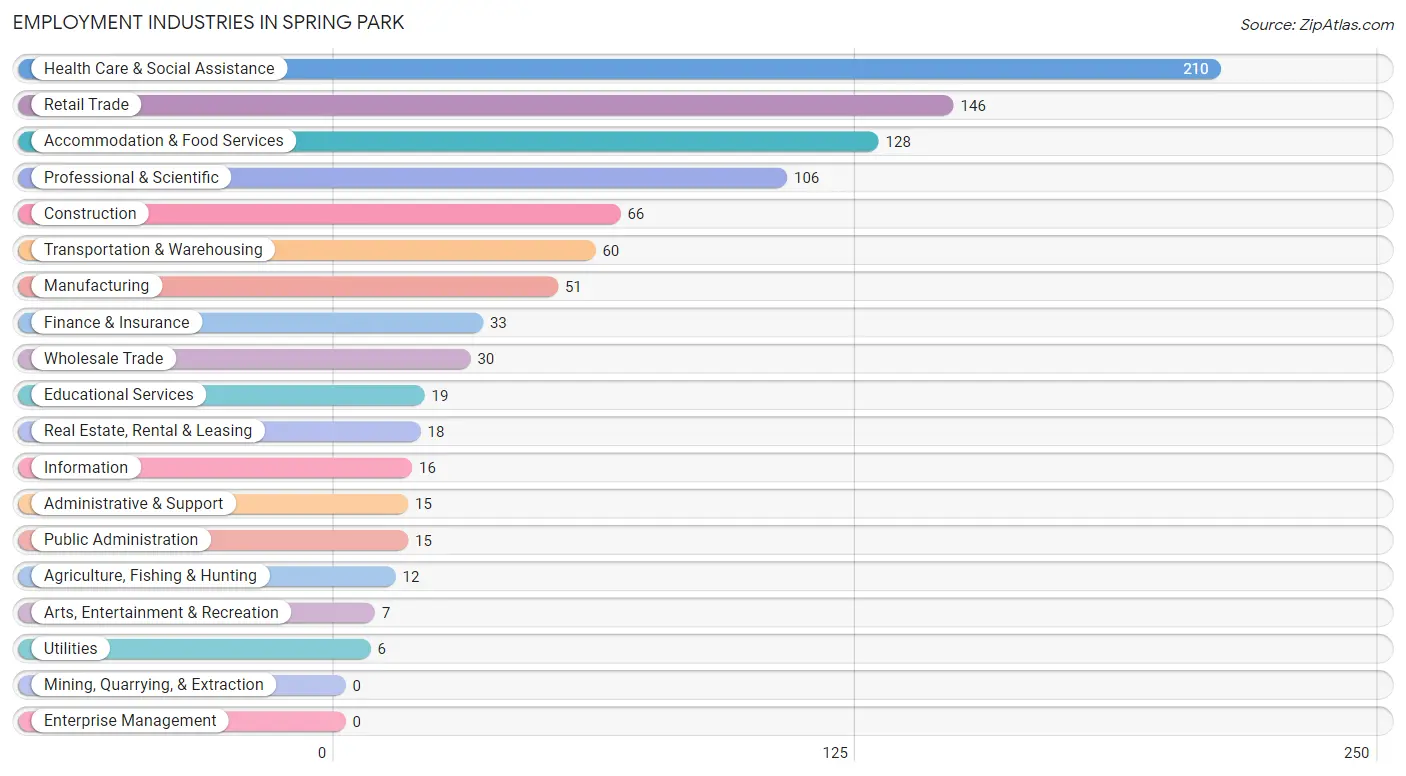
Employment Industries in Spring Park
The major employment industries in Spring Park include Health Care & Social Assistance (210 | 21.3%), Retail Trade (146 | 14.8%), Accommodation & Food Services (128 | 13.0%), Professional & Scientific (106 | 10.7%), and Construction (66 | 6.7%).
Employment Industries by Sex in Spring Park
The Spring Park industries that see more men than women are Manufacturing (100.0%), Information (100.0%), and Arts, Entertainment & Recreation (100.0%), whereas the industries that tend to have a higher number of women are Agriculture, Fishing & Hunting (100.0%), Utilities (100.0%), and Public Administration (100.0%).
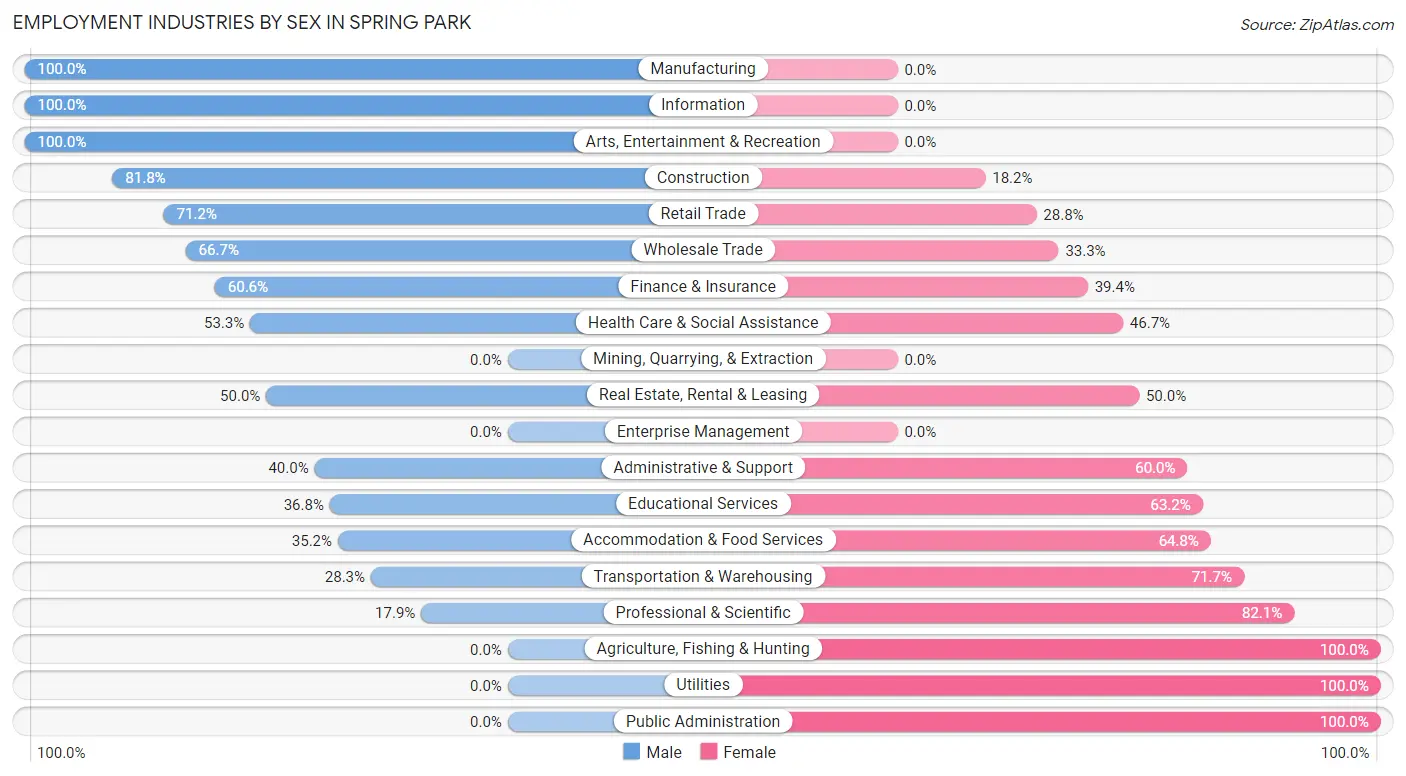
| Industry | Male | Female |
| Agriculture, Fishing & Hunting | 0 (0.0%) | 12 (100.0%) |
| Mining, Quarrying, & Extraction | 0 (0.0%) | 0 (0.0%) |
| Construction | 54 (81.8%) | 12 (18.2%) |
| Manufacturing | 51 (100.0%) | 0 (0.0%) |
| Wholesale Trade | 20 (66.7%) | 10 (33.3%) |
| Retail Trade | 104 (71.2%) | 42 (28.8%) |
| Transportation & Warehousing | 17 (28.3%) | 43 (71.7%) |
| Utilities | 0 (0.0%) | 6 (100.0%) |
| Information | 16 (100.0%) | 0 (0.0%) |
| Finance & Insurance | 20 (60.6%) | 13 (39.4%) |
| Real Estate, Rental & Leasing | 9 (50.0%) | 9 (50.0%) |
| Professional & Scientific | 19 (17.9%) | 87 (82.1%) |
| Enterprise Management | 0 (0.0%) | 0 (0.0%) |
| Administrative & Support | 6 (40.0%) | 9 (60.0%) |
| Educational Services | 7 (36.8%) | 12 (63.2%) |
| Health Care & Social Assistance | 112 (53.3%) | 98 (46.7%) |
| Arts, Entertainment & Recreation | 7 (100.0%) | 0 (0.0%) |
| Accommodation & Food Services | 45 (35.2%) | 83 (64.8%) |
| Public Administration | 0 (0.0%) | 15 (100.0%) |
| Total | 515 (52.1%) | 473 (47.9%) |
Education in Spring Park
School Enrollment in Spring Park
The most common levels of schooling among the 240 students in Spring Park are high school (134 | 55.8%), elementary school (55 | 22.9%), and college / undergraduate (28 | 11.7%).
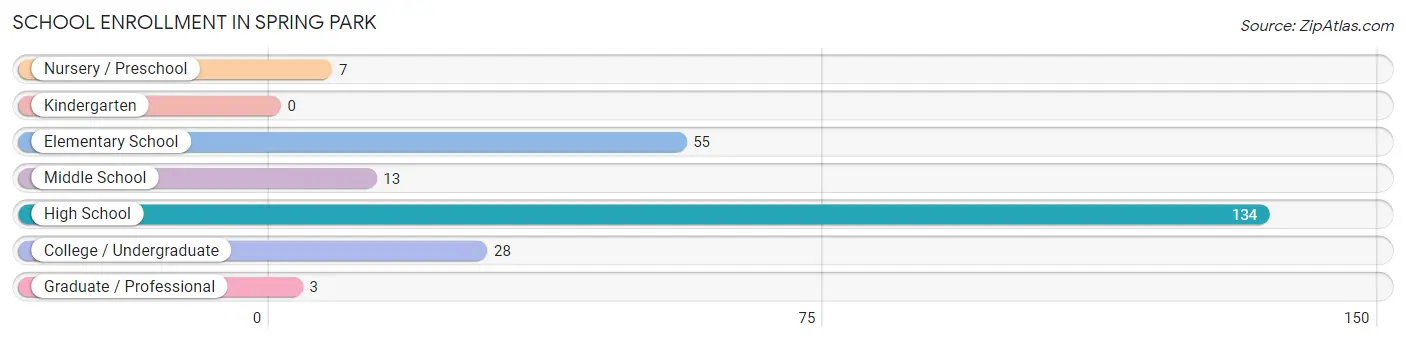
| School Level | # Students | % Students |
| Nursery / Preschool | 7 | 2.9% |
| Kindergarten | 0 | 0.0% |
| Elementary School | 55 | 22.9% |
| Middle School | 13 | 5.4% |
| High School | 134 | 55.8% |
| College / Undergraduate | 28 | 11.7% |
| Graduate / Professional | 3 | 1.3% |
| Total | 240 | 100.0% |
School Enrollment by Age by Funding Source in Spring Park
Out of a total of 240 students who are enrolled in schools in Spring Park, 27 (11.3%) attend a private institution, while the remaining 213 (88.7%) are enrolled in public schools. The age group of 10 to 14 year olds has the highest likelihood of being enrolled in private schools, with 12 (37.5% in the age bracket) enrolled. Conversely, the age group of 3 to 4 year olds has the lowest likelihood of being enrolled in a private school, with 7 (100.0% in the age bracket) attending a public institution.
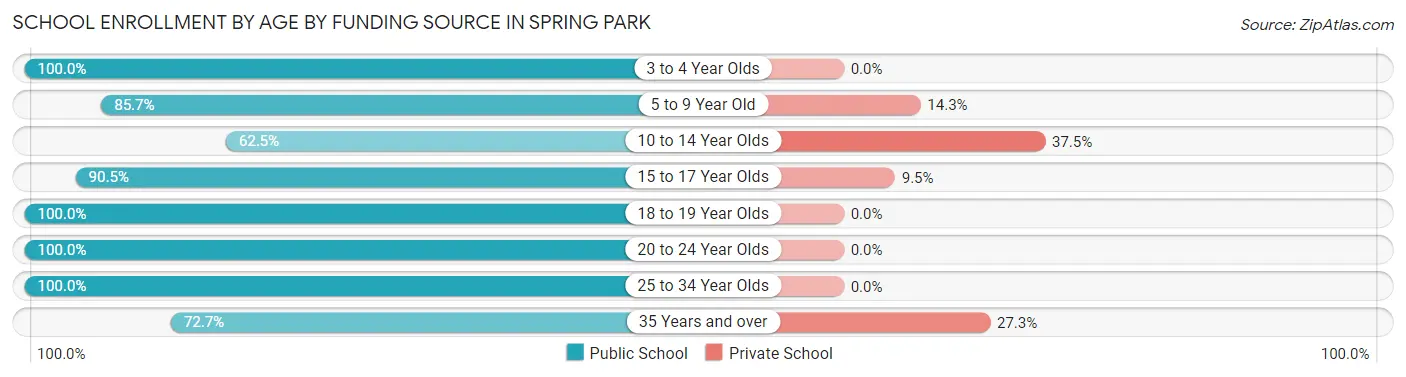
| Age Bracket | Public School | Private School |
| 3 to 4 Year Olds | 7 (100.0%) | 0 (0.0%) |
| 5 to 9 Year Old | 36 (85.7%) | 6 (14.3%) |
| 10 to 14 Year Olds | 20 (62.5%) | 12 (37.5%) |
| 15 to 17 Year Olds | 57 (90.5%) | 6 (9.5%) |
| 18 to 19 Year Olds | 65 (100.0%) | 0 (0.0%) |
| 20 to 24 Year Olds | 10 (100.0%) | 0 (0.0%) |
| 25 to 34 Year Olds | 10 (100.0%) | 0 (0.0%) |
| 35 Years and over | 8 (72.7%) | 3 (27.3%) |
| Total | 213 (88.8%) | 27 (11.3%) |
Educational Attainment by Field of Study in Spring Park
Business (102 | 19.1%), education (84 | 15.7%), visual & performing arts (64 | 12.0%), social sciences (61 | 11.4%), and engineering (47 | 8.8%) are the most common fields of study among 534 individuals in Spring Park who have obtained a bachelor's degree or higher.
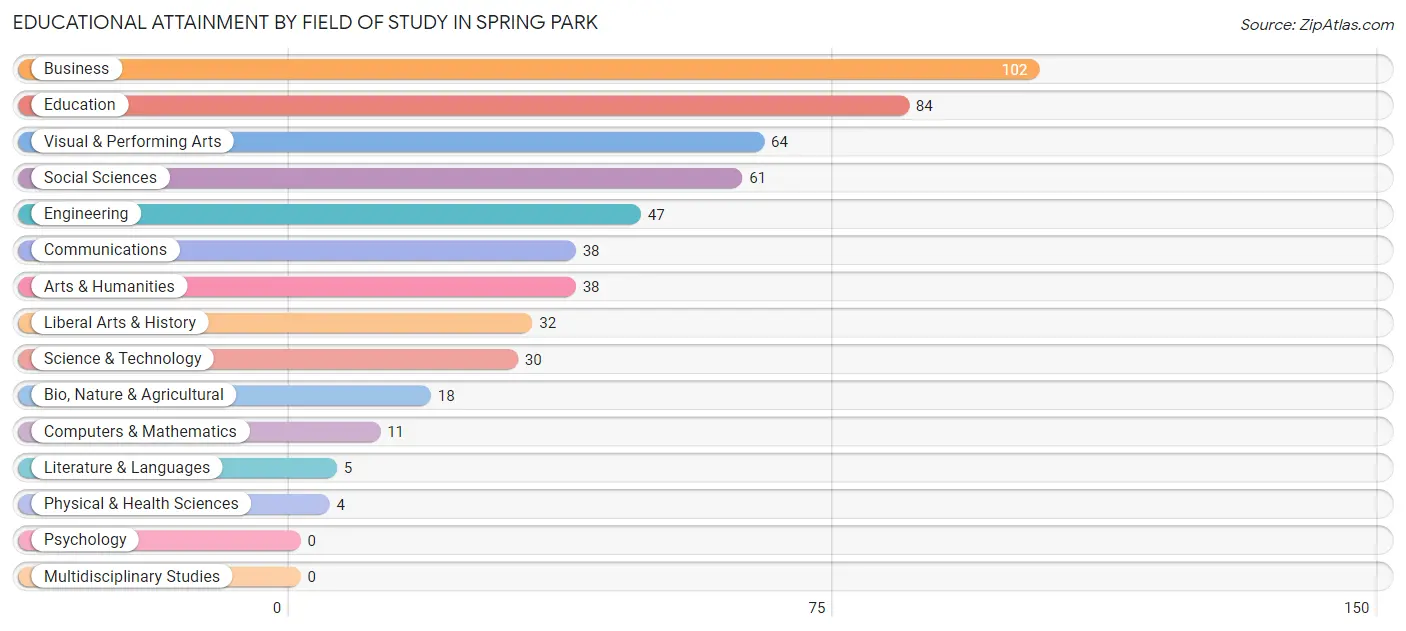
| Field of Study | # Graduates | % Graduates |
| Computers & Mathematics | 11 | 2.1% |
| Bio, Nature & Agricultural | 18 | 3.4% |
| Physical & Health Sciences | 4 | 0.7% |
| Psychology | 0 | 0.0% |
| Social Sciences | 61 | 11.4% |
| Engineering | 47 | 8.8% |
| Multidisciplinary Studies | 0 | 0.0% |
| Science & Technology | 30 | 5.6% |
| Business | 102 | 19.1% |
| Education | 84 | 15.7% |
| Literature & Languages | 5 | 0.9% |
| Liberal Arts & History | 32 | 6.0% |
| Visual & Performing Arts | 64 | 12.0% |
| Communications | 38 | 7.1% |
| Arts & Humanities | 38 | 7.1% |
| Total | 534 | 100.0% |
Transportation & Commute in Spring Park
Vehicle Availability by Sex in Spring Park
The most prevalent vehicle ownership categories in Spring Park are males with 1 vehicle (291, accounting for 57.2%) and females with 1 vehicle (242, making up 66.4%).
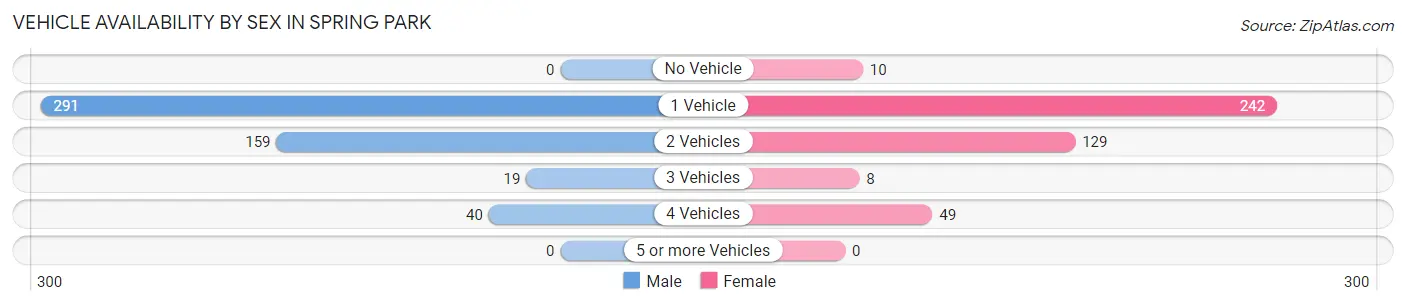
| Vehicles Available | Male | Female |
| No Vehicle | 0 (0.0%) | 10 (2.3%) |
| 1 Vehicle | 291 (57.2%) | 242 (55.2%) |
| 2 Vehicles | 159 (31.2%) | 129 (29.4%) |
| 3 Vehicles | 19 (3.7%) | 8 (1.8%) |
| 4 Vehicles | 40 (7.9%) | 49 (11.2%) |
| 5 or more Vehicles | 0 (0.0%) | 0 (0.0%) |
| Total | 509 (100.0%) | 438 (100.0%) |
Commute Time in Spring Park
The most frequently occuring commute durations in Spring Park are 5 to 9 minutes (217 commuters, 24.7%), 20 to 24 minutes (152 commuters, 17.3%), and 25 to 29 minutes (118 commuters, 13.4%).
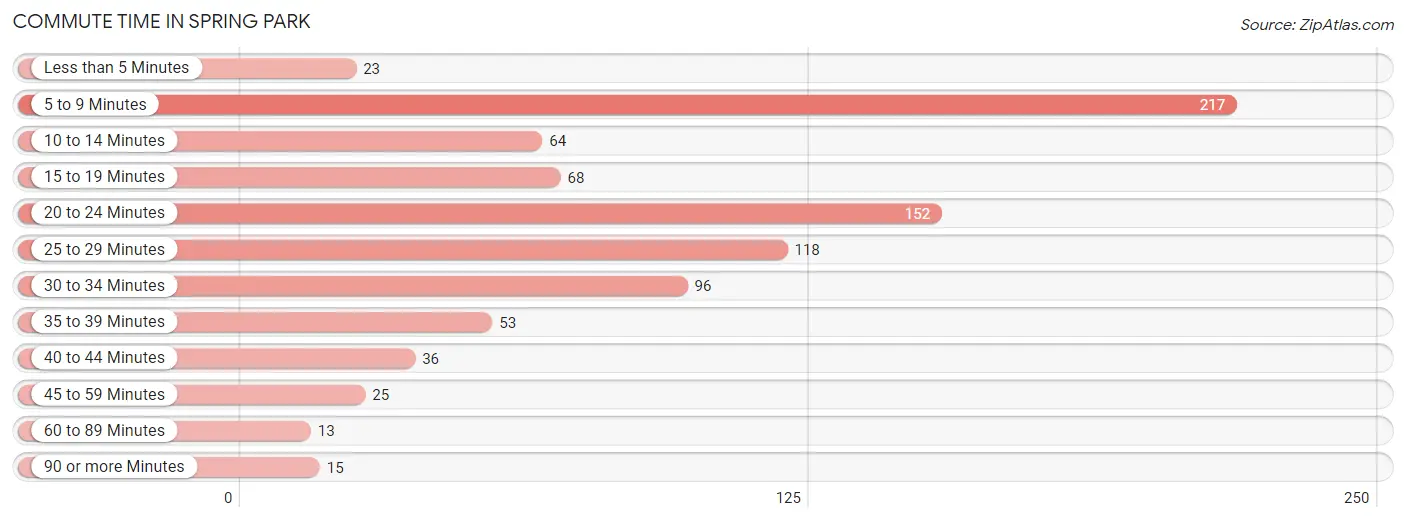
| Commute Time | # Commuters | % Commuters |
| Less than 5 Minutes | 23 | 2.6% |
| 5 to 9 Minutes | 217 | 24.7% |
| 10 to 14 Minutes | 64 | 7.3% |
| 15 to 19 Minutes | 68 | 7.7% |
| 20 to 24 Minutes | 152 | 17.3% |
| 25 to 29 Minutes | 118 | 13.4% |
| 30 to 34 Minutes | 96 | 10.9% |
| 35 to 39 Minutes | 53 | 6.0% |
| 40 to 44 Minutes | 36 | 4.1% |
| 45 to 59 Minutes | 25 | 2.8% |
| 60 to 89 Minutes | 13 | 1.5% |
| 90 or more Minutes | 15 | 1.7% |
Commute Time by Sex in Spring Park
The most common commute times in Spring Park are 5 to 9 minutes (123 commuters, 25.1%) for males and 20 to 24 minutes (114 commuters, 29.3%) for females.
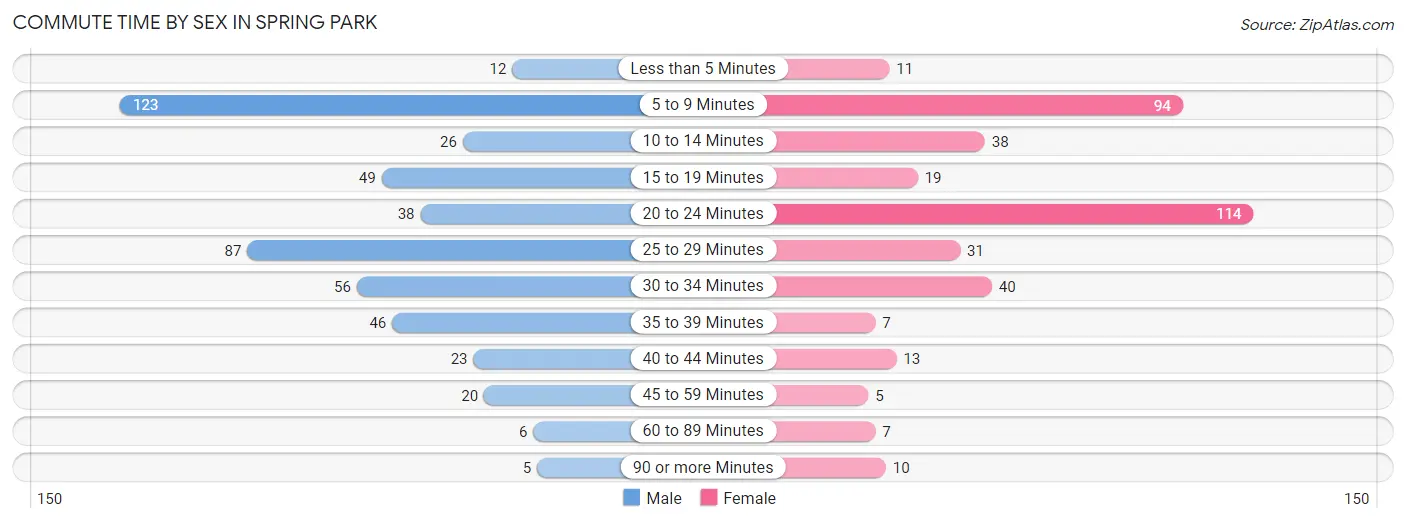
| Commute Time | Male | Female |
| Less than 5 Minutes | 12 (2.4%) | 11 (2.8%) |
| 5 to 9 Minutes | 123 (25.1%) | 94 (24.2%) |
| 10 to 14 Minutes | 26 (5.3%) | 38 (9.8%) |
| 15 to 19 Minutes | 49 (10.0%) | 19 (4.9%) |
| 20 to 24 Minutes | 38 (7.7%) | 114 (29.3%) |
| 25 to 29 Minutes | 87 (17.7%) | 31 (8.0%) |
| 30 to 34 Minutes | 56 (11.4%) | 40 (10.3%) |
| 35 to 39 Minutes | 46 (9.4%) | 7 (1.8%) |
| 40 to 44 Minutes | 23 (4.7%) | 13 (3.3%) |
| 45 to 59 Minutes | 20 (4.1%) | 5 (1.3%) |
| 60 to 89 Minutes | 6 (1.2%) | 7 (1.8%) |
| 90 or more Minutes | 5 (1.0%) | 10 (2.6%) |
Time of Departure to Work by Sex in Spring Park
The most frequent times of departure to work in Spring Park are 5:30 AM to 5:59 AM (120, 24.4%) for males and 12:00 PM to 3:59 PM (91, 23.4%) for females.
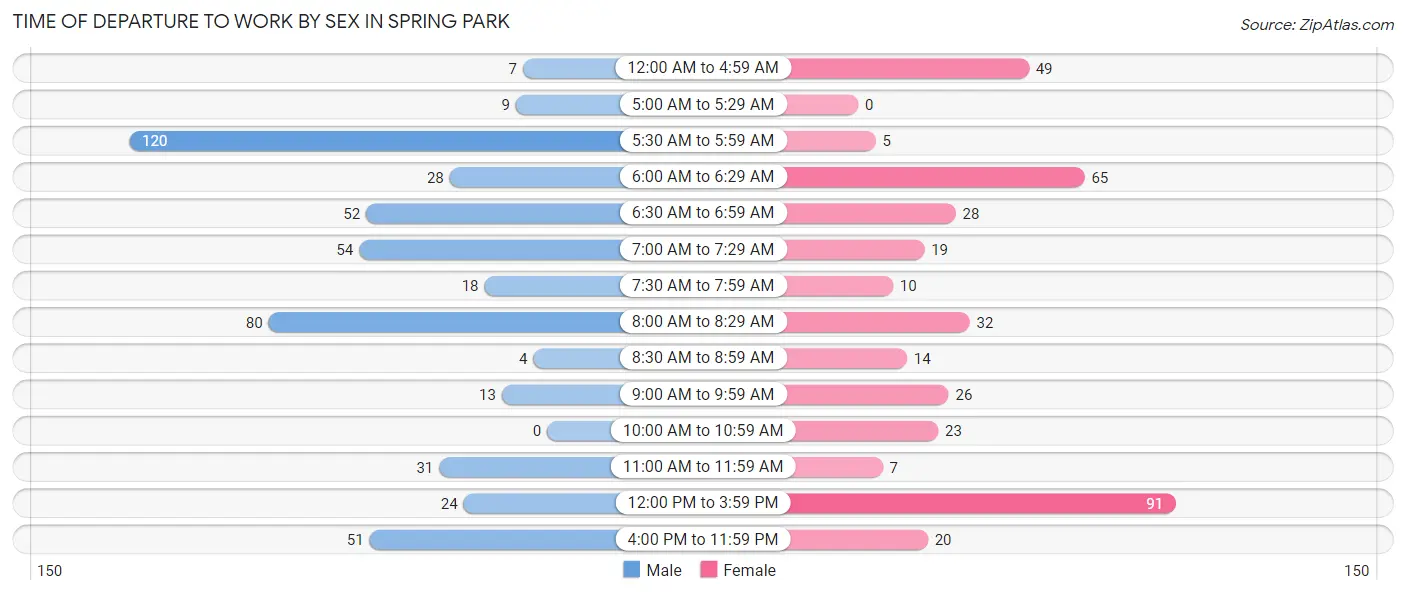
| Time of Departure | Male | Female |
| 12:00 AM to 4:59 AM | 7 (1.4%) | 49 (12.6%) |
| 5:00 AM to 5:29 AM | 9 (1.8%) | 0 (0.0%) |
| 5:30 AM to 5:59 AM | 120 (24.4%) | 5 (1.3%) |
| 6:00 AM to 6:29 AM | 28 (5.7%) | 65 (16.7%) |
| 6:30 AM to 6:59 AM | 52 (10.6%) | 28 (7.2%) |
| 7:00 AM to 7:29 AM | 54 (11.0%) | 19 (4.9%) |
| 7:30 AM to 7:59 AM | 18 (3.7%) | 10 (2.6%) |
| 8:00 AM to 8:29 AM | 80 (16.3%) | 32 (8.2%) |
| 8:30 AM to 8:59 AM | 4 (0.8%) | 14 (3.6%) |
| 9:00 AM to 9:59 AM | 13 (2.6%) | 26 (6.7%) |
| 10:00 AM to 10:59 AM | 0 (0.0%) | 23 (5.9%) |
| 11:00 AM to 11:59 AM | 31 (6.3%) | 7 (1.8%) |
| 12:00 PM to 3:59 PM | 24 (4.9%) | 91 (23.4%) |
| 4:00 PM to 11:59 PM | 51 (10.4%) | 20 (5.1%) |
| Total | 491 (100.0%) | 389 (100.0%) |
Housing Occupancy in Spring Park
Occupancy by Ownership in Spring Park
Of the total 1,220 dwellings in Spring Park, owner-occupied units account for 230 (18.9%), while renter-occupied units make up 990 (81.1%).
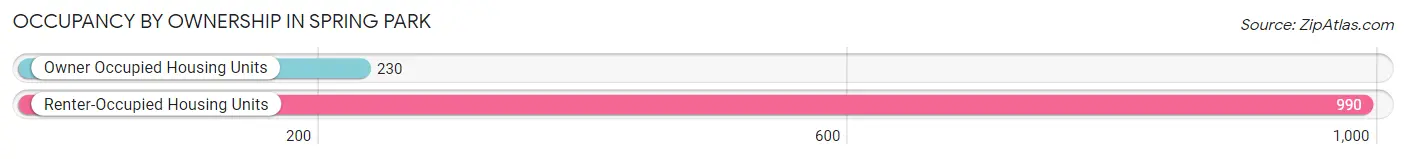
| Occupancy | # Housing Units | % Housing Units |
| Owner Occupied Housing Units | 230 | 18.9% |
| Renter-Occupied Housing Units | 990 | 81.1% |
| Total Occupied Housing Units | 1,220 | 100.0% |
Occupancy by Household Size in Spring Park
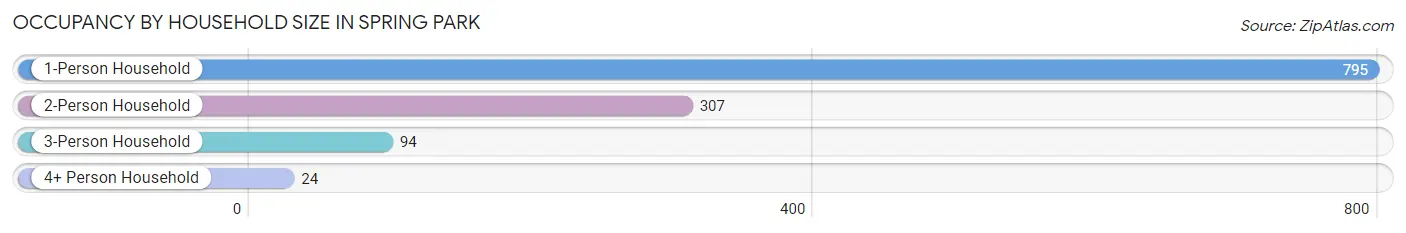
| Household Size | # Housing Units | % Housing Units |
| 1-Person Household | 795 | 65.2% |
| 2-Person Household | 307 | 25.2% |
| 3-Person Household | 94 | 7.7% |
| 4+ Person Household | 24 | 2.0% |
| Total Housing Units | 1,220 | 100.0% |
Occupancy by Ownership by Household Size in Spring Park
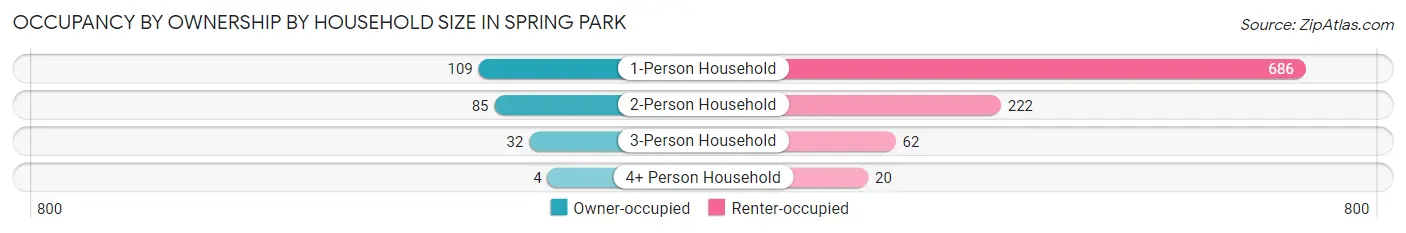
| Household Size | Owner-occupied | Renter-occupied |
| 1-Person Household | 109 (13.7%) | 686 (86.3%) |
| 2-Person Household | 85 (27.7%) | 222 (72.3%) |
| 3-Person Household | 32 (34.0%) | 62 (66.0%) |
| 4+ Person Household | 4 (16.7%) | 20 (83.3%) |
| Total Housing Units | 230 (18.9%) | 990 (81.1%) |
Occupancy by Educational Attainment in Spring Park
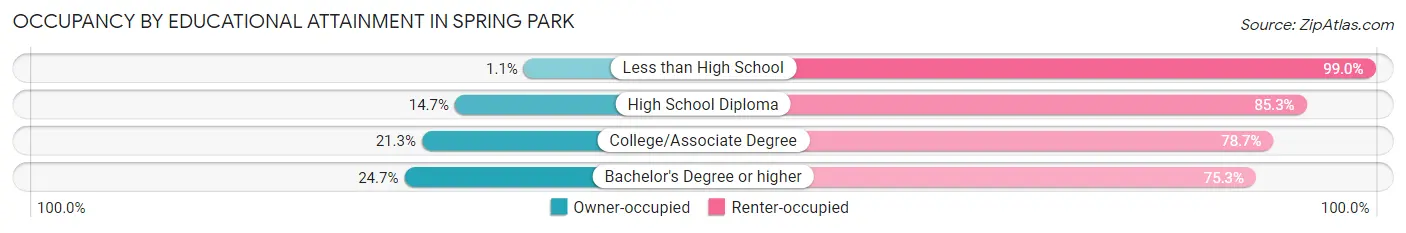
| Household Size | Owner-occupied | Renter-occupied |
| Less than High School | 1 (1.1%) | 94 (99.0%) |
| High School Diploma | 51 (14.7%) | 296 (85.3%) |
| College/Associate Degree | 88 (21.3%) | 326 (78.7%) |
| Bachelor's Degree or higher | 90 (24.7%) | 274 (75.3%) |
Occupancy by Age of Householder in Spring Park
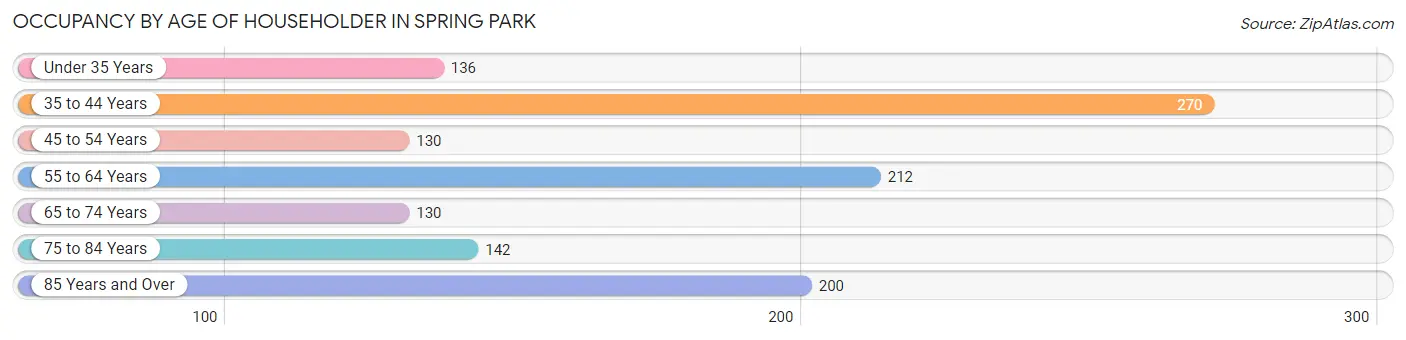
| Age Bracket | # Households | % Households |
| Under 35 Years | 136 | 11.2% |
| 35 to 44 Years | 270 | 22.1% |
| 45 to 54 Years | 130 | 10.7% |
| 55 to 64 Years | 212 | 17.4% |
| 65 to 74 Years | 130 | 10.7% |
| 75 to 84 Years | 142 | 11.6% |
| 85 Years and Over | 200 | 16.4% |
| Total | 1,220 | 100.0% |
Housing Finances in Spring Park
Median Income by Occupancy in Spring Park
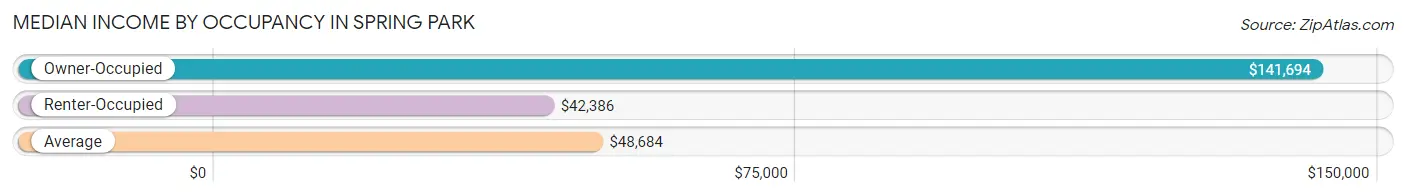
| Occupancy Type | # Households | Median Income |
| Owner-Occupied | 230 (18.9%) | $141,694 |
| Renter-Occupied | 990 (81.1%) | $42,386 |
| Average | 1,220 (100.0%) | $48,684 |
Occupancy by Householder Income Bracket in Spring Park
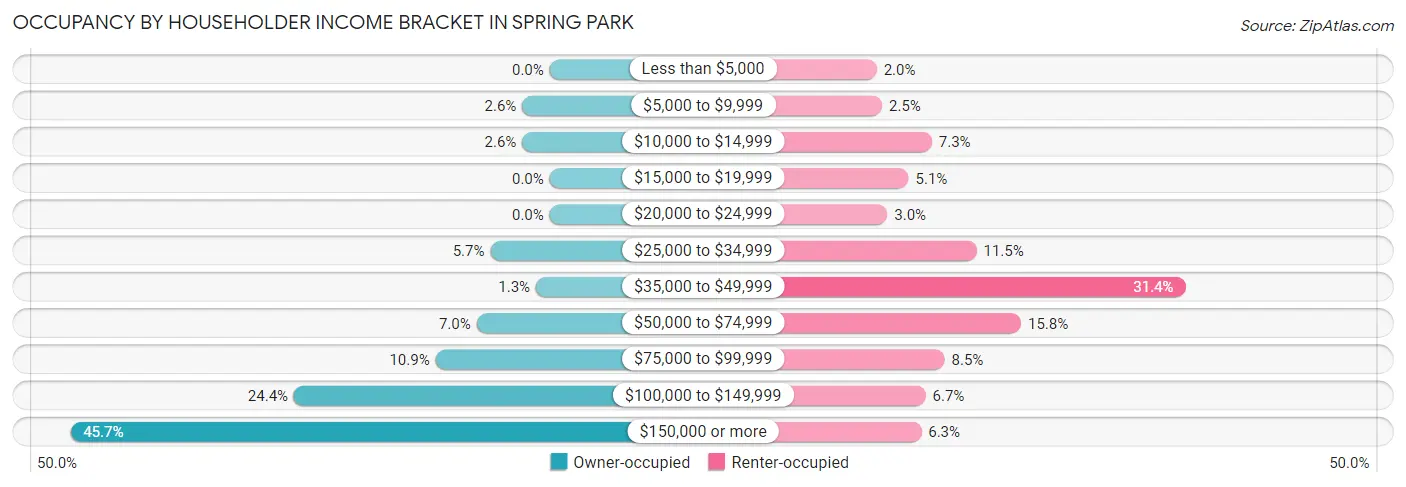
| Income Bracket | Owner-occupied | Renter-occupied |
| Less than $5,000 | 0 (0.0%) | 20 (2.0%) |
| $5,000 to $9,999 | 6 (2.6%) | 25 (2.5%) |
| $10,000 to $14,999 | 6 (2.6%) | 72 (7.3%) |
| $15,000 to $19,999 | 0 (0.0%) | 50 (5.1%) |
| $20,000 to $24,999 | 0 (0.0%) | 30 (3.0%) |
| $25,000 to $34,999 | 13 (5.7%) | 114 (11.5%) |
| $35,000 to $49,999 | 3 (1.3%) | 311 (31.4%) |
| $50,000 to $74,999 | 16 (7.0%) | 156 (15.8%) |
| $75,000 to $99,999 | 25 (10.9%) | 84 (8.5%) |
| $100,000 to $149,999 | 56 (24.3%) | 66 (6.7%) |
| $150,000 or more | 105 (45.7%) | 62 (6.3%) |
| Total | 230 (100.0%) | 990 (100.0%) |
Monthly Housing Cost Tiers in Spring Park
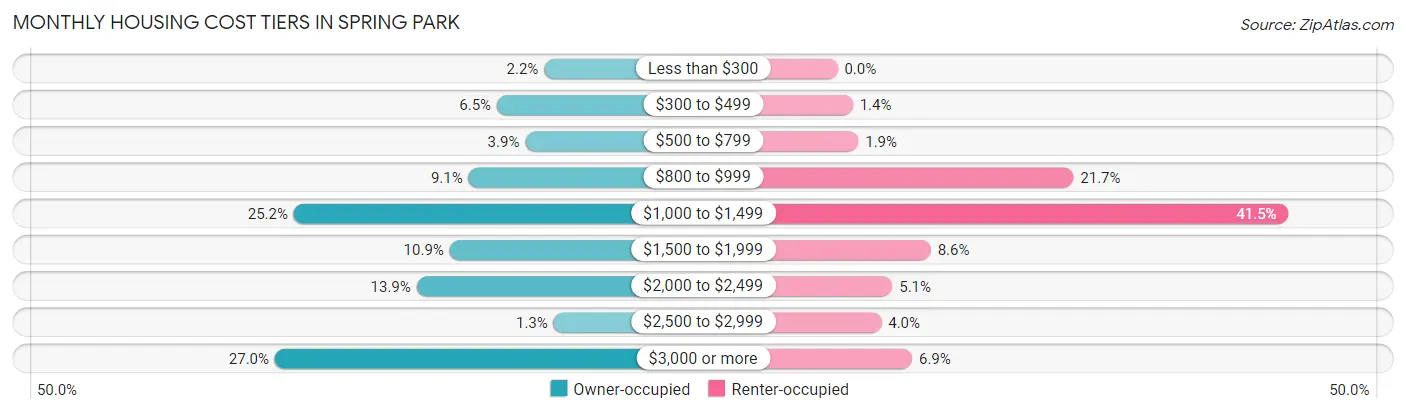
| Monthly Cost | Owner-occupied | Renter-occupied |
| Less than $300 | 5 (2.2%) | 0 (0.0%) |
| $300 to $499 | 15 (6.5%) | 14 (1.4%) |
| $500 to $799 | 9 (3.9%) | 19 (1.9%) |
| $800 to $999 | 21 (9.1%) | 215 (21.7%) |
| $1,000 to $1,499 | 58 (25.2%) | 411 (41.5%) |
| $1,500 to $1,999 | 25 (10.9%) | 85 (8.6%) |
| $2,000 to $2,499 | 32 (13.9%) | 50 (5.1%) |
| $2,500 to $2,999 | 3 (1.3%) | 40 (4.0%) |
| $3,000 or more | 62 (27.0%) | 68 (6.9%) |
| Total | 230 (100.0%) | 990 (100.0%) |
Physical Housing Characteristics in Spring Park
Housing Structures in Spring Park
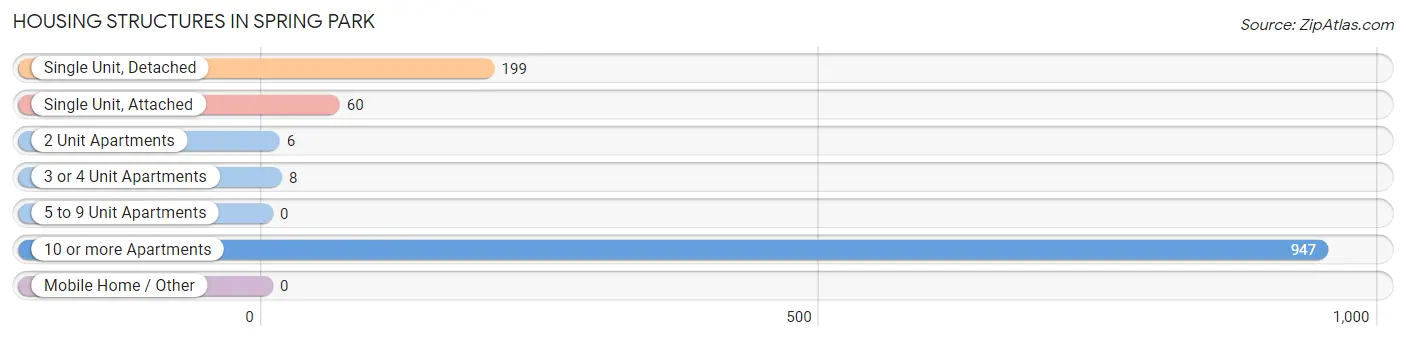
| Structure Type | # Housing Units | % Housing Units |
| Single Unit, Detached | 199 | 16.3% |
| Single Unit, Attached | 60 | 4.9% |
| 2 Unit Apartments | 6 | 0.5% |
| 3 or 4 Unit Apartments | 8 | 0.7% |
| 5 to 9 Unit Apartments | 0 | 0.0% |
| 10 or more Apartments | 947 | 77.6% |
| Mobile Home / Other | 0 | 0.0% |
| Total | 1,220 | 100.0% |
Housing Structures by Occupancy in Spring Park
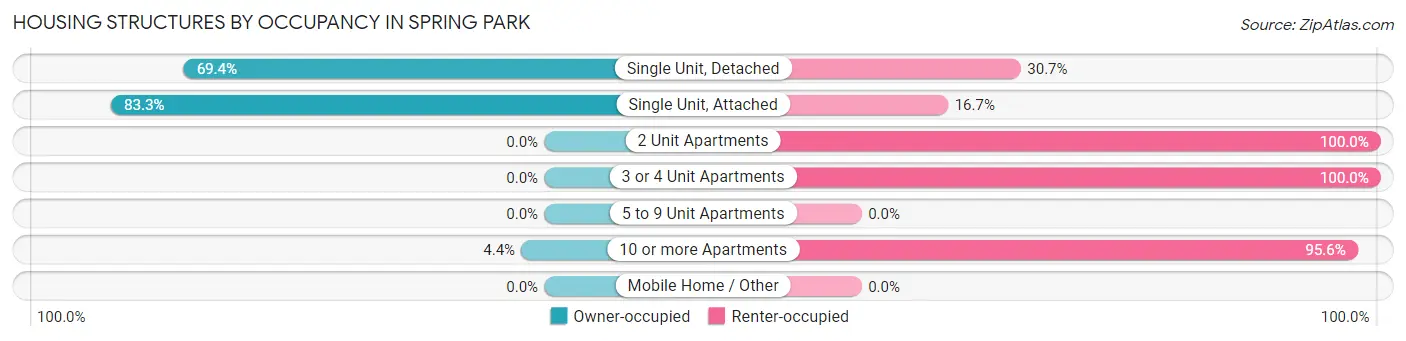
| Structure Type | Owner-occupied | Renter-occupied |
| Single Unit, Detached | 138 (69.4%) | 61 (30.6%) |
| Single Unit, Attached | 50 (83.3%) | 10 (16.7%) |
| 2 Unit Apartments | 0 (0.0%) | 6 (100.0%) |
| 3 or 4 Unit Apartments | 0 (0.0%) | 8 (100.0%) |
| 5 to 9 Unit Apartments | 0 (0.0%) | 0 (0.0%) |
| 10 or more Apartments | 42 (4.4%) | 905 (95.6%) |
| Mobile Home / Other | 0 (0.0%) | 0 (0.0%) |
| Total | 230 (18.9%) | 990 (81.1%) |
Housing Structures by Number of Rooms in Spring Park
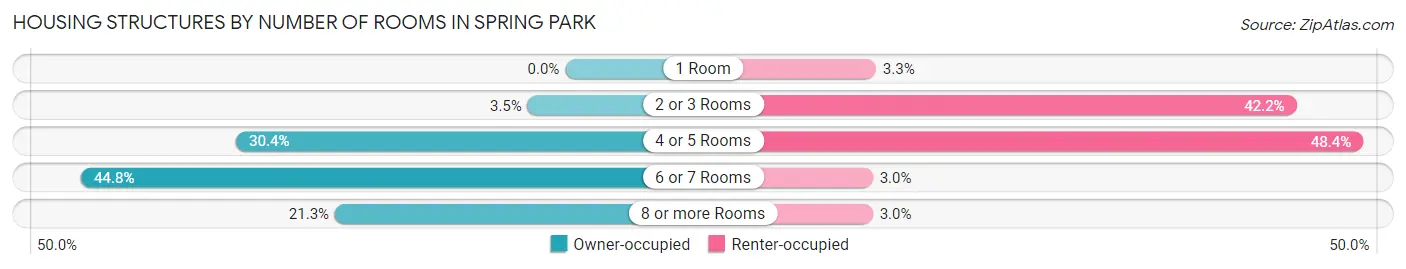
| Number of Rooms | Owner-occupied | Renter-occupied |
| 1 Room | 0 (0.0%) | 33 (3.3%) |
| 2 or 3 Rooms | 8 (3.5%) | 418 (42.2%) |
| 4 or 5 Rooms | 70 (30.4%) | 479 (48.4%) |
| 6 or 7 Rooms | 103 (44.8%) | 30 (3.0%) |
| 8 or more Rooms | 49 (21.3%) | 30 (3.0%) |
| Total | 230 (100.0%) | 990 (100.0%) |
Housing Structure by Heating Type in Spring Park
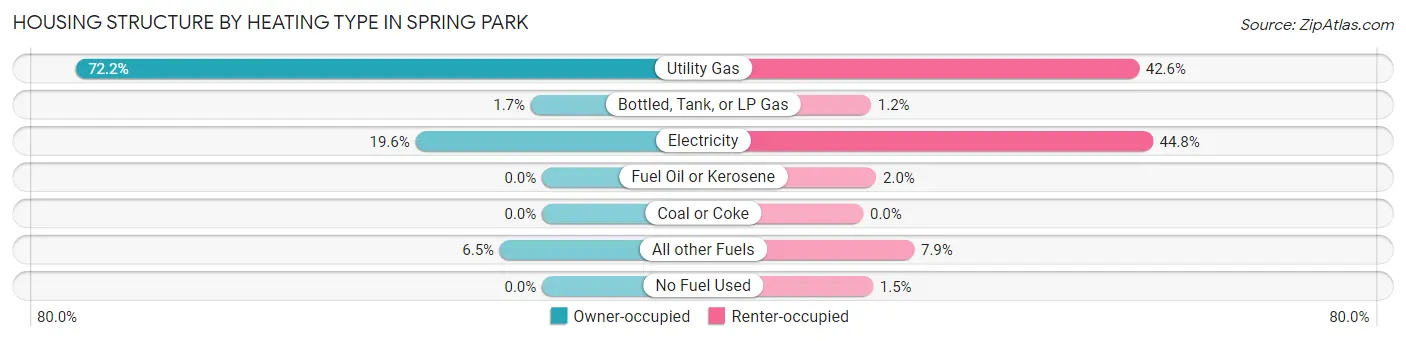
| Heating Type | Owner-occupied | Renter-occupied |
| Utility Gas | 166 (72.2%) | 422 (42.6%) |
| Bottled, Tank, or LP Gas | 4 (1.7%) | 12 (1.2%) |
| Electricity | 45 (19.6%) | 443 (44.8%) |
| Fuel Oil or Kerosene | 0 (0.0%) | 20 (2.0%) |
| Coal or Coke | 0 (0.0%) | 0 (0.0%) |
| All other Fuels | 15 (6.5%) | 78 (7.9%) |
| No Fuel Used | 0 (0.0%) | 15 (1.5%) |
| Total | 230 (100.0%) | 990 (100.0%) |
Household Vehicle Usage in Spring Park
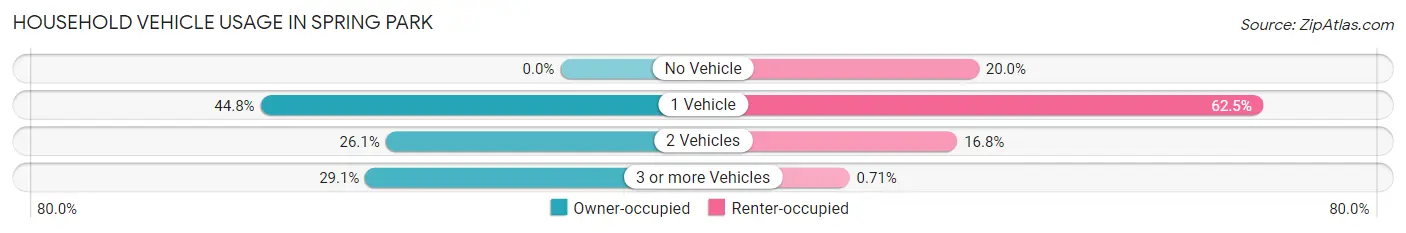
| Vehicles per Household | Owner-occupied | Renter-occupied |
| No Vehicle | 0 (0.0%) | 198 (20.0%) |
| 1 Vehicle | 103 (44.8%) | 619 (62.5%) |
| 2 Vehicles | 60 (26.1%) | 166 (16.8%) |
| 3 or more Vehicles | 67 (29.1%) | 7 (0.7%) |
| Total | 230 (100.0%) | 990 (100.0%) |
Real Estate & Mortgages in Spring Park
Real Estate and Mortgage Overview in Spring Park
| Characteristic | Without Mortgage | With Mortgage |
| Housing Units | 94 | 136 |
| Median Property Value | $564,100 | $0 |
| Median Household Income | $141,048 | $76 |
| Monthly Housing Costs | $1,009 | $62 |
| Real Estate Taxes | $5,726 | $0 |
Property Value by Mortgage Status in Spring Park
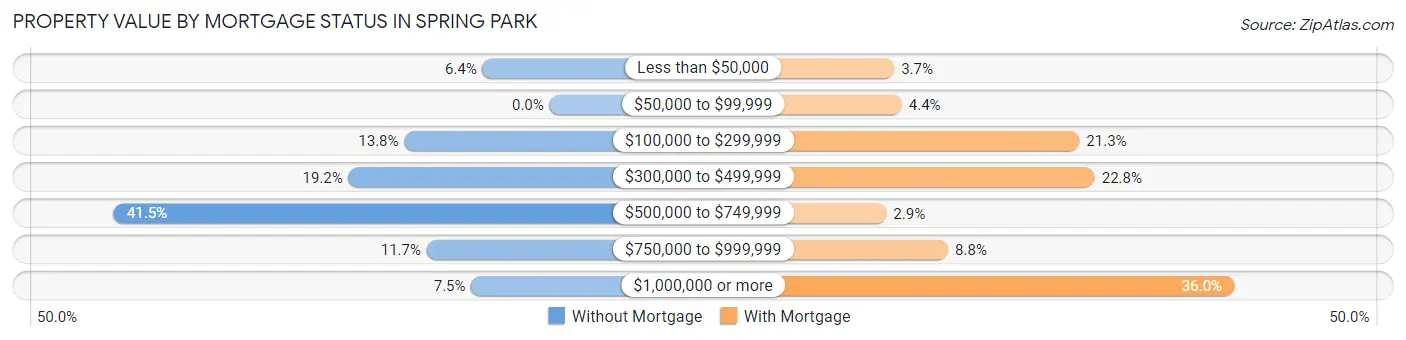
| Property Value | Without Mortgage | With Mortgage |
| Less than $50,000 | 6 (6.4%) | 5 (3.7%) |
| $50,000 to $99,999 | 0 (0.0%) | 6 (4.4%) |
| $100,000 to $299,999 | 13 (13.8%) | 29 (21.3%) |
| $300,000 to $499,999 | 18 (19.2%) | 31 (22.8%) |
| $500,000 to $749,999 | 39 (41.5%) | 4 (2.9%) |
| $750,000 to $999,999 | 11 (11.7%) | 12 (8.8%) |
| $1,000,000 or more | 7 (7.4%) | 49 (36.0%) |
| Total | 94 (100.0%) | 136 (100.0%) |
Household Income by Mortgage Status in Spring Park
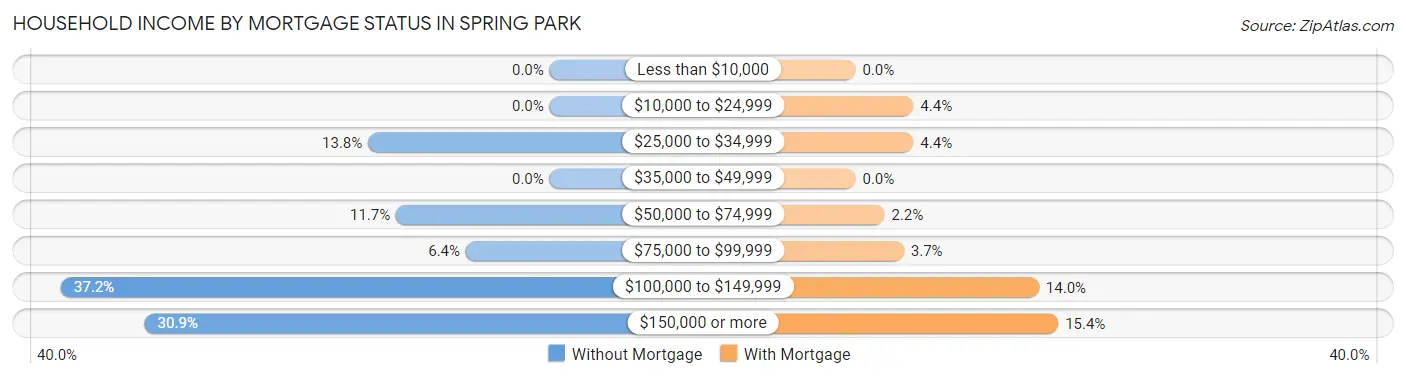
| Household Income | Without Mortgage | With Mortgage |
| Less than $10,000 | 0 (0.0%) | 0 (0.0%) |
| $10,000 to $24,999 | 0 (0.0%) | 6 (4.4%) |
| $25,000 to $34,999 | 13 (13.8%) | 6 (4.4%) |
| $35,000 to $49,999 | 0 (0.0%) | 0 (0.0%) |
| $50,000 to $74,999 | 11 (11.7%) | 3 (2.2%) |
| $75,000 to $99,999 | 6 (6.4%) | 5 (3.7%) |
| $100,000 to $149,999 | 35 (37.2%) | 19 (14.0%) |
| $150,000 or more | 29 (30.8%) | 21 (15.4%) |
| Total | 94 (100.0%) | 136 (100.0%) |
Property Value to Household Income Ratio in Spring Park
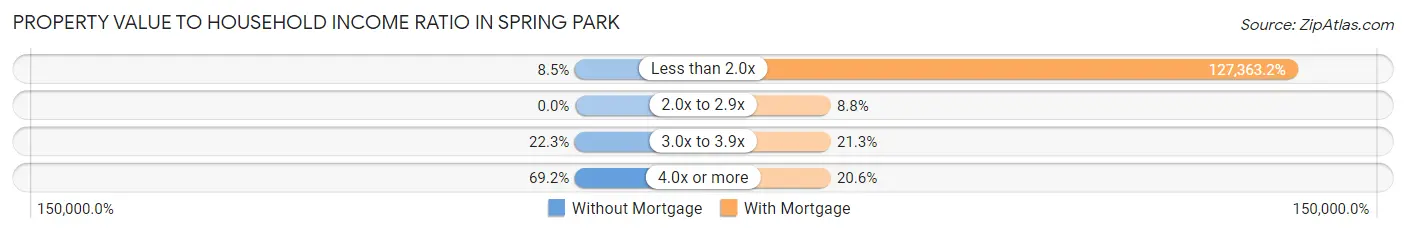
| Value-to-Income Ratio | Without Mortgage | With Mortgage |
| Less than 2.0x | 8 (8.5%) | 173,214 (127,363.2%) |
| 2.0x to 2.9x | 0 (0.0%) | 12 (8.8%) |
| 3.0x to 3.9x | 21 (22.3%) | 29 (21.3%) |
| 4.0x or more | 65 (69.2%) | 28 (20.6%) |
| Total | 94 (100.0%) | 136 (100.0%) |
Real Estate Taxes by Mortgage Status in Spring Park
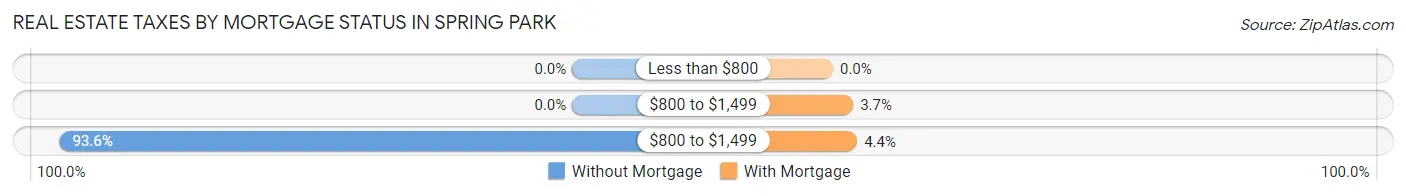
| Property Taxes | Without Mortgage | With Mortgage |
| Less than $800 | 0 (0.0%) | 0 (0.0%) |
| $800 to $1,499 | 0 (0.0%) | 5 (3.7%) |
| $800 to $1,499 | 88 (93.6%) | 6 (4.4%) |
| Total | 94 (100.0%) | 136 (100.0%) |
Health & Disability in Spring Park
Health Insurance Coverage by Age in Spring Park
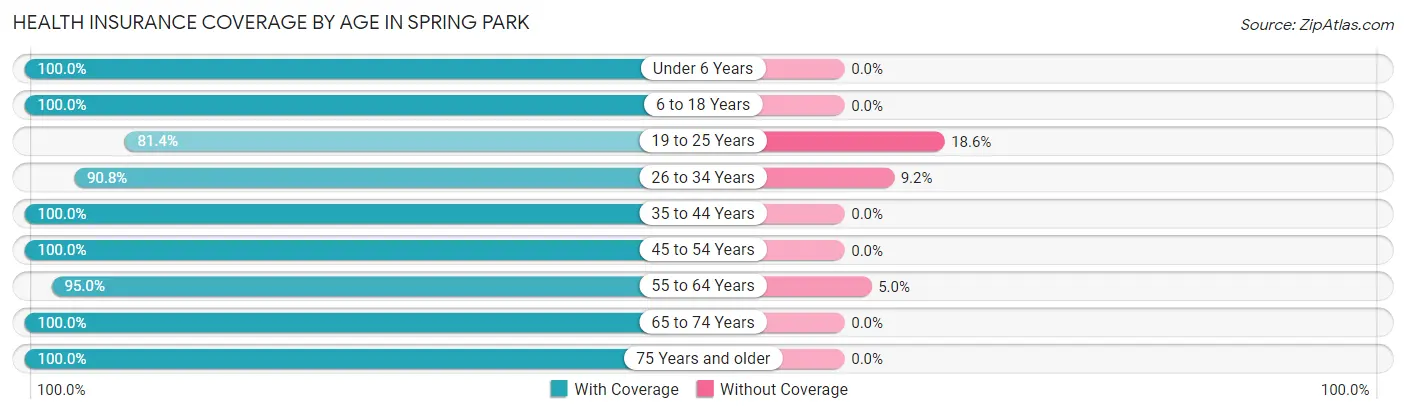
| Age Bracket | With Coverage | Without Coverage |
| Under 6 Years | 22 (100.0%) | 0 (0.0%) |
| 6 to 18 Years | 197 (100.0%) | 0 (0.0%) |
| 19 to 25 Years | 83 (81.4%) | 19 (18.6%) |
| 26 to 34 Years | 138 (90.8%) | 14 (9.2%) |
| 35 to 44 Years | 284 (100.0%) | 0 (0.0%) |
| 45 to 54 Years | 181 (100.0%) | 0 (0.0%) |
| 55 to 64 Years | 284 (95.0%) | 15 (5.0%) |
| 65 to 74 Years | 170 (100.0%) | 0 (0.0%) |
| 75 Years and older | 388 (100.0%) | 0 (0.0%) |
| Total | 1,747 (97.3%) | 48 (2.7%) |
Health Insurance Coverage by Citizenship Status in Spring Park
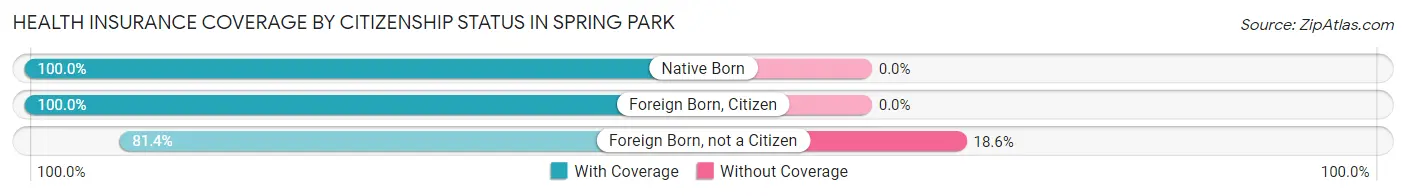
| Citizenship Status | With Coverage | Without Coverage |
| Native Born | 22 (100.0%) | 0 (0.0%) |
| Foreign Born, Citizen | 197 (100.0%) | 0 (0.0%) |
| Foreign Born, not a Citizen | 83 (81.4%) | 19 (18.6%) |
Health Insurance Coverage by Household Income in Spring Park
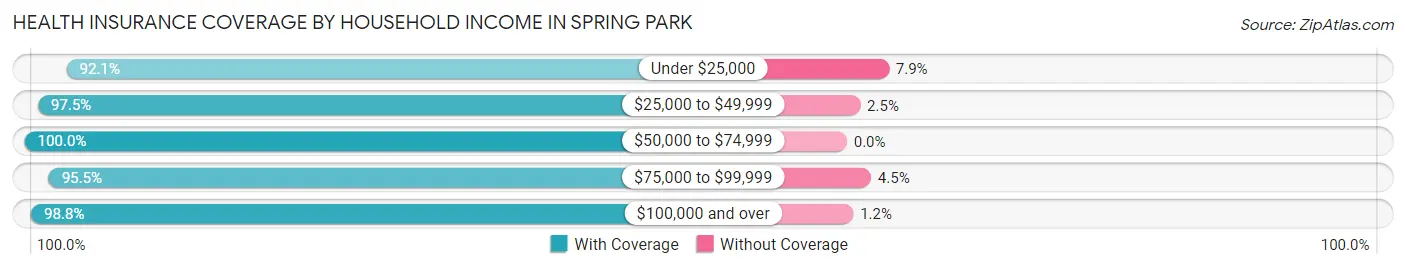
| Household Income | With Coverage | Without Coverage |
| Under $25,000 | 222 (92.1%) | 19 (7.9%) |
| $25,000 to $49,999 | 585 (97.5%) | 15 (2.5%) |
| $50,000 to $74,999 | 283 (100.0%) | 0 (0.0%) |
| $75,000 to $99,999 | 169 (95.5%) | 8 (4.5%) |
| $100,000 and over | 488 (98.8%) | 6 (1.2%) |
Public vs Private Health Insurance Coverage by Age in Spring Park
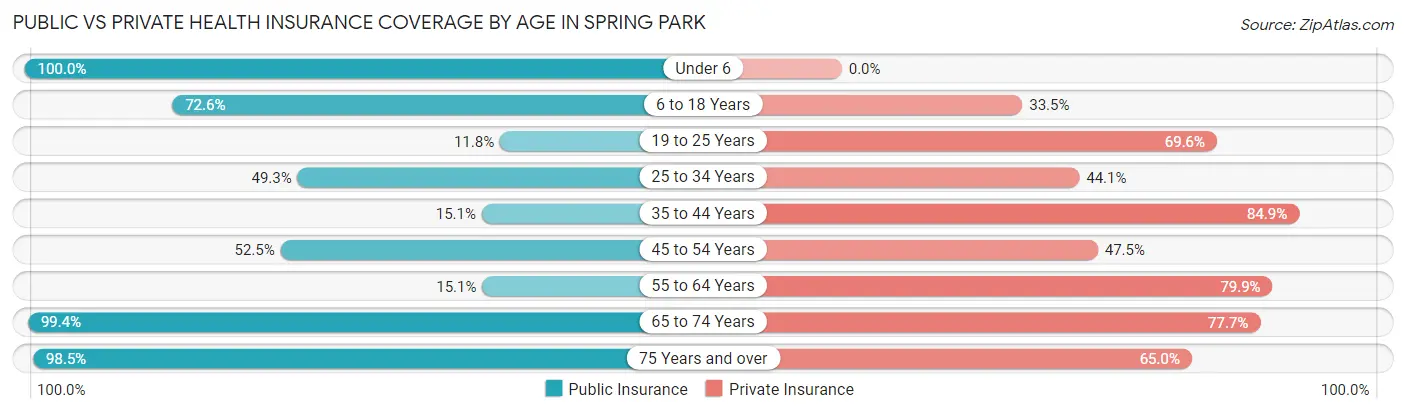
| Age Bracket | Public Insurance | Private Insurance |
| Under 6 | 22 (100.0%) | 0 (0.0%) |
| 6 to 18 Years | 143 (72.6%) | 66 (33.5%) |
| 19 to 25 Years | 12 (11.8%) | 71 (69.6%) |
| 25 to 34 Years | 75 (49.3%) | 67 (44.1%) |
| 35 to 44 Years | 43 (15.1%) | 241 (84.9%) |
| 45 to 54 Years | 95 (52.5%) | 86 (47.5%) |
| 55 to 64 Years | 45 (15.0%) | 239 (79.9%) |
| 65 to 74 Years | 169 (99.4%) | 132 (77.6%) |
| 75 Years and over | 382 (98.5%) | 252 (64.9%) |
| Total | 986 (54.9%) | 1,154 (64.3%) |
Disability Status by Sex by Age in Spring Park
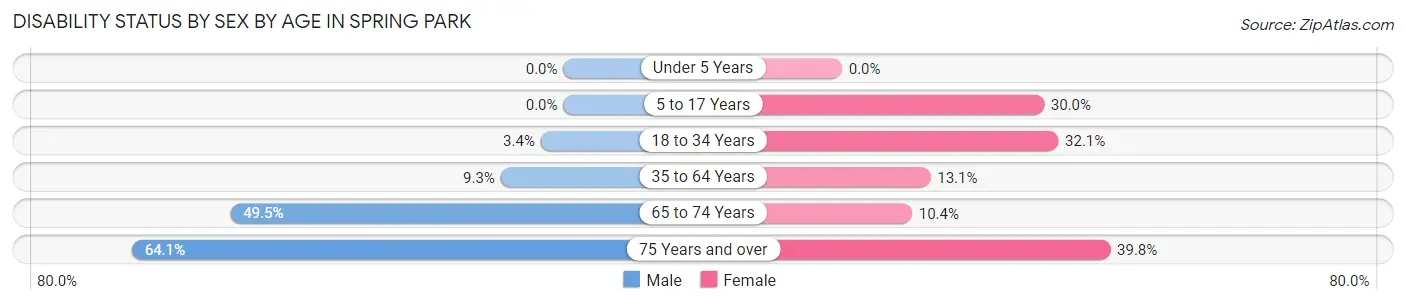
| Age Bracket | Male | Female |
| Under 5 Years | 0 (0.0%) | 0 (0.0%) |
| 5 to 17 Years | 0 (0.0%) | 18 (30.0%) |
| 18 to 34 Years | 5 (3.4%) | 53 (32.1%) |
| 35 to 64 Years | 35 (9.3%) | 51 (13.1%) |
| 65 to 74 Years | 46 (49.5%) | 8 (10.4%) |
| 75 Years and over | 91 (64.1%) | 98 (39.8%) |
Disability Class by Sex by Age in Spring Park
Disability Class: Hearing Difficulty
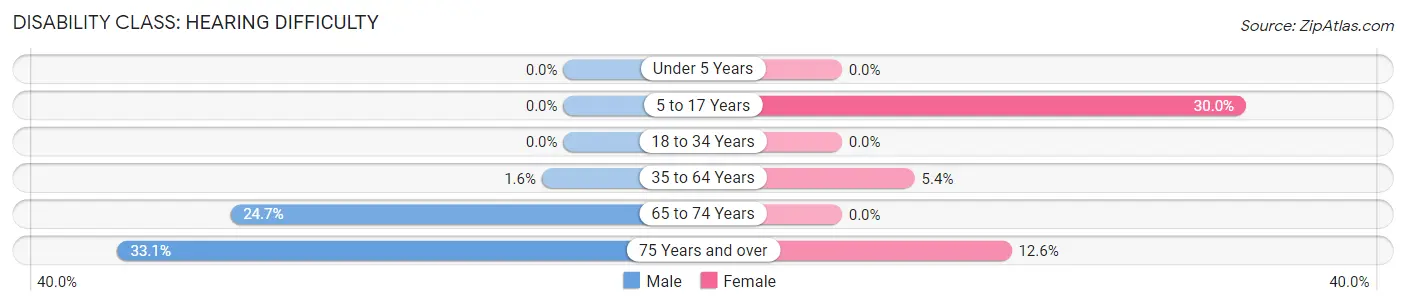
| Age Bracket | Male | Female |
| Under 5 Years | 0 (0.0%) | 0 (0.0%) |
| 5 to 17 Years | 0 (0.0%) | 18 (30.0%) |
| 18 to 34 Years | 0 (0.0%) | 0 (0.0%) |
| 35 to 64 Years | 6 (1.6%) | 21 (5.4%) |
| 65 to 74 Years | 23 (24.7%) | 0 (0.0%) |
| 75 Years and over | 47 (33.1%) | 31 (12.6%) |
Disability Class: Vision Difficulty
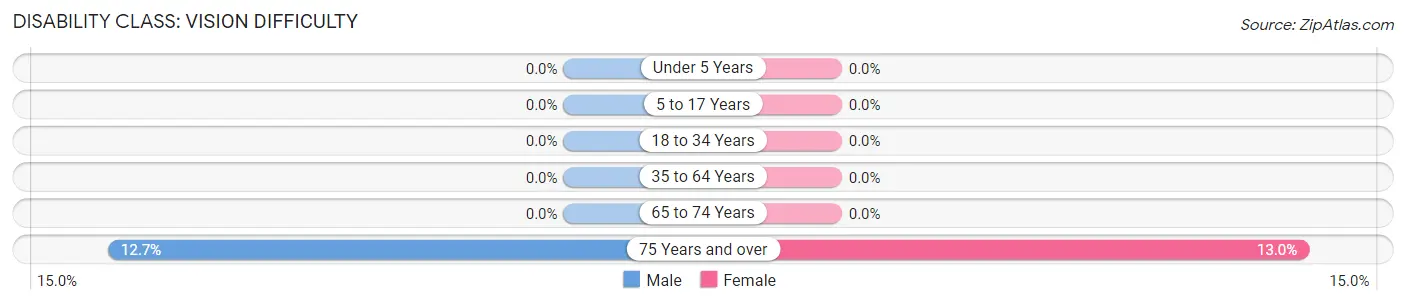
| Age Bracket | Male | Female |
| Under 5 Years | 0 (0.0%) | 0 (0.0%) |
| 5 to 17 Years | 0 (0.0%) | 0 (0.0%) |
| 18 to 34 Years | 0 (0.0%) | 0 (0.0%) |
| 35 to 64 Years | 0 (0.0%) | 0 (0.0%) |
| 65 to 74 Years | 0 (0.0%) | 0 (0.0%) |
| 75 Years and over | 18 (12.7%) | 32 (13.0%) |
Disability Class: Cognitive Difficulty
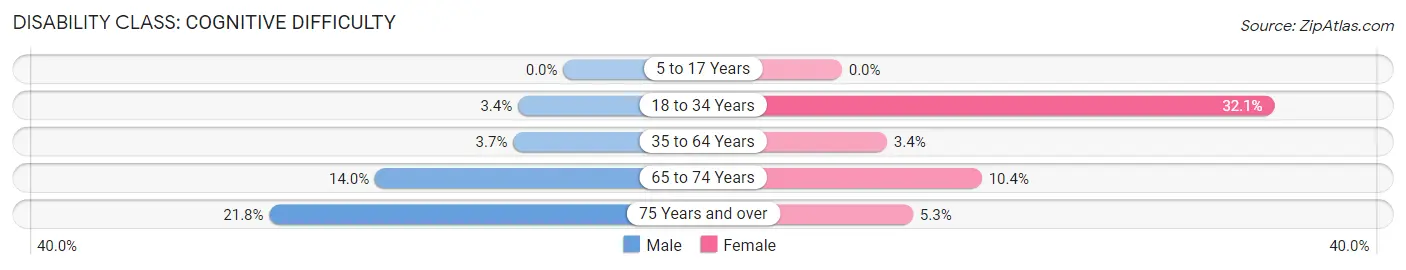
| Age Bracket | Male | Female |
| 5 to 17 Years | 0 (0.0%) | 0 (0.0%) |
| 18 to 34 Years | 5 (3.4%) | 53 (32.1%) |
| 35 to 64 Years | 14 (3.7%) | 13 (3.4%) |
| 65 to 74 Years | 13 (14.0%) | 8 (10.4%) |
| 75 Years and over | 31 (21.8%) | 13 (5.3%) |
Disability Class: Ambulatory Difficulty
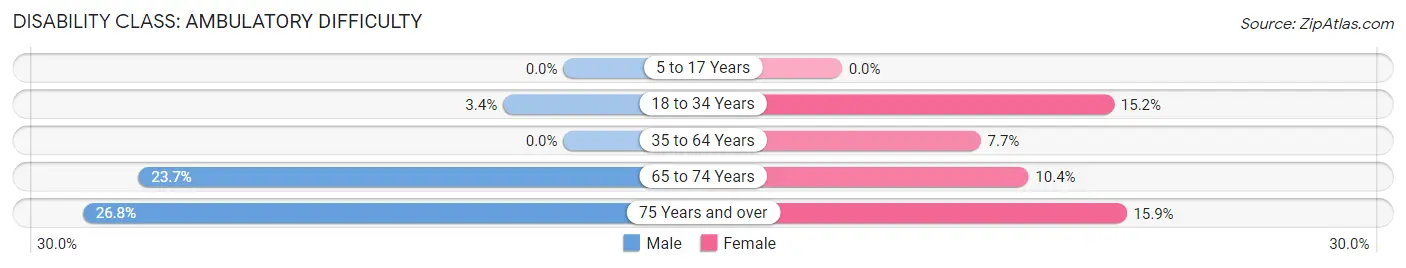
| Age Bracket | Male | Female |
| 5 to 17 Years | 0 (0.0%) | 0 (0.0%) |
| 18 to 34 Years | 5 (3.4%) | 25 (15.1%) |
| 35 to 64 Years | 0 (0.0%) | 30 (7.7%) |
| 65 to 74 Years | 22 (23.7%) | 8 (10.4%) |
| 75 Years and over | 38 (26.8%) | 39 (15.9%) |
Disability Class: Self-Care Difficulty
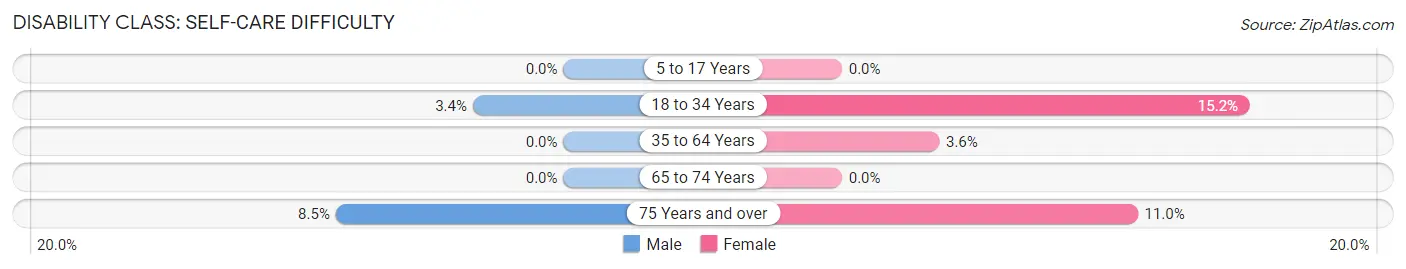
| Age Bracket | Male | Female |
| 5 to 17 Years | 0 (0.0%) | 0 (0.0%) |
| 18 to 34 Years | 5 (3.4%) | 25 (15.1%) |
| 35 to 64 Years | 0 (0.0%) | 14 (3.6%) |
| 65 to 74 Years | 0 (0.0%) | 0 (0.0%) |
| 75 Years and over | 12 (8.5%) | 27 (11.0%) |
Technology Access in Spring Park
Computing Device Access in Spring Park
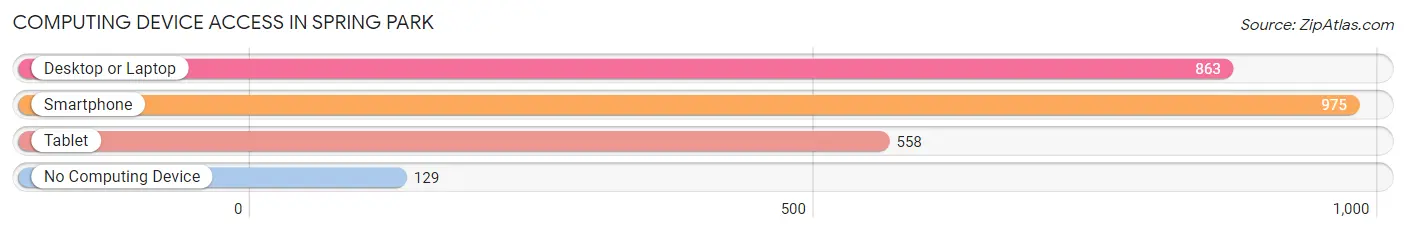
| Device Type | # Households | % Households |
| Desktop or Laptop | 863 | 70.7% |
| Smartphone | 975 | 79.9% |
| Tablet | 558 | 45.7% |
| No Computing Device | 129 | 10.6% |
| Total | 1,220 | 100.0% |
Internet Access in Spring Park
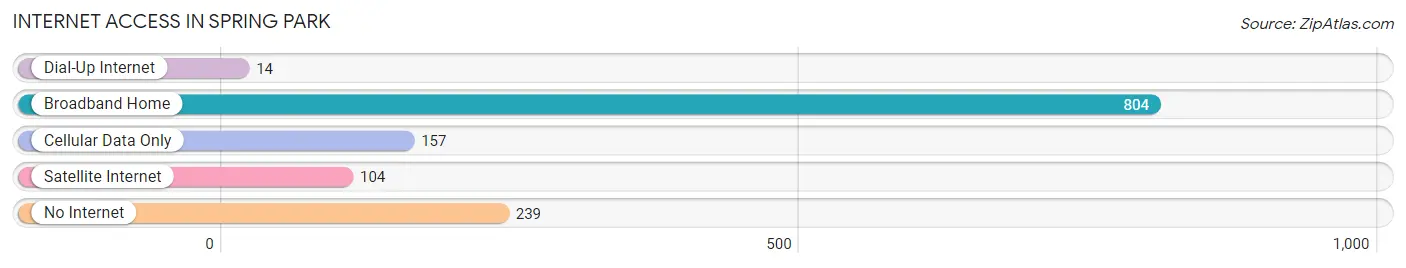
| Internet Type | # Households | % Households |
| Dial-Up Internet | 14 | 1.1% |
| Broadband Home | 804 | 65.9% |
| Cellular Data Only | 157 | 12.9% |
| Satellite Internet | 104 | 8.5% |
| No Internet | 239 | 19.6% |
| Total | 1,220 | 100.0% |
Spring Park Summary
Park History
Spring Park is a small city located in Hennepin County, Minnesota. It is situated on the western shore of Lake Minnetonka, about 25 miles west of Minneapolis. The city was founded in 1856 by a group of settlers from Wisconsin. The settlers named the area Spring Park because of the many springs that were found in the area.
The first settlers in Spring Park were mostly farmers and fishermen. They built small cabins and began to farm the land. The area was also known for its excellent fishing, and the settlers would often take advantage of the lake’s bounty.
In the late 1800s, the area began to grow and develop. The first hotel was built in 1887, and the first school was built in 1889. The city was officially incorporated in 1895.
In the early 1900s, the city began to attract more visitors. The area was known for its beautiful scenery and its excellent fishing. The city also became a popular destination for vacationers.
In the 1950s, the city began to experience a population boom. Many people moved to the area to take advantage of the city’s natural beauty and its proximity to Minneapolis. The population of Spring Park has continued to grow since then, and the city now has a population of over 5,000 people.
Geography
Spring Park is located in Hennepin County, Minnesota. It is situated on the western shore of Lake Minnetonka, about 25 miles west of Minneapolis. The city is bordered by the cities of Minnetonka, Wayzata, and Orono.
The city has a total area of 4.2 square miles, all of which is land. The terrain of the city is mostly flat, with some rolling hills. The city is located in a temperate climate zone, with hot summers and cold winters.
Economy
The economy of Spring Park is largely based on tourism. The city is a popular destination for vacationers, and it is known for its beautiful scenery and excellent fishing. The city also has a number of small businesses, including restaurants, shops, and other services.
The city also has a number of large employers, including the Minnetonka Corporation, the Orono Corporation, and the Wayzata Corporation. These companies provide jobs for many of the city’s residents.
Demographics
As of the 2010 census, the population of Spring Park was 5,072. The racial makeup of the city was 94.3% White, 1.2% African American, 0.3% Native American, 1.7% Asian, 0.1% Pacific Islander, 0.9% from other races, and 1.7% from two or more races. Hispanic or Latino of any race were 2.7% of the population.
The median income for a household in the city was $63,958, and the median income for a family was $76,958. The per capita income for the city was $31,958. About 4.3% of families and 5.7% of the population were below the poverty line, including 6.3% of those under age 18 and 4.3% of those age 65 or over.
Conclusion
Spring Park is a small city located in Hennepin County, Minnesota. It is situated on the western shore of Lake Minnetonka, about 25 miles west of Minneapolis. The city was founded in 1856 by a group of settlers from Wisconsin. The city has a population of over 5,000 people and is known for its beautiful scenery and excellent fishing. The economy of the city is largely based on tourism, and it also has a number of large employers. The racial makeup of the city is mostly White, with a small percentage of African American, Native American, Asian, and Pacific Islander residents. The median income for a household in the city is $63,958, and the per capita income is $31,958.
Common Questions
What is Per Capita Income in Spring Park?
Per Capita income in Spring Park is $52,346.
What is the Median Family Income in Spring Park?
Median Family Income in Spring Park is $63,958.
What is the Median Household income in Spring Park?
Median Household Income in Spring Park is $48,684.
What is Income or Wage Gap in Spring Park?
Income or Wage Gap in Spring Park is 4.3%.
Women in Spring Park earn 95.7 cents for every dollar earned by a man.
What is Inequality or Gini Index in Spring Park?
Inequality or Gini Index in Spring Park is 0.49.
What is the Total Population of Spring Park?
Total Population of Spring Park is 1,919.
What is the Total Male Population of Spring Park?
Total Male Population of Spring Park is 907.
What is the Total Female Population of Spring Park?
Total Female Population of Spring Park is 1,012.
What is the Ratio of Males per 100 Females in Spring Park?
There are 89.62 Males per 100 Females in Spring Park.
What is the Ratio of Females per 100 Males in Spring Park?
There are 111.58 Females per 100 Males in Spring Park.
What is the Median Population Age in Spring Park?
Median Population Age in Spring Park is 55.5 Years.
What is the Average Family Size in Spring Park
Average Family Size in Spring Park is 2.3 People.
What is the Average Household Size in Spring Park
Average Household Size in Spring Park is 1.5 People.
How Large is the Labor Force in Spring Park?
There are 1,024 People in the Labor Forcein in Spring Park.
What is the Percentage of People in the Labor Force in Spring Park?
56.6% of People are in the Labor Force in Spring Park.
What is the Unemployment Rate in Spring Park?
Unemployment Rate in Spring Park is 3.5%.