Fort Riley, KS Map & Demographics
Fort Riley Map
Fort Riley Overview
$24,851
PER CAPITA INCOME
$52,083
AVG FAMILY INCOME
$48,497
AVG HOUSEHOLD INCOME
24.3%
WAGE / INCOME GAP [ % ]
75.7¢/ $1
WAGE / INCOME GAP [ $ ]
$14,908
FAMILY INCOME DEFICIT
0.36
INEQUALITY / GINI INDEX
8,623
TOTAL POPULATION
5,864
MALE POPULATION
2,759
FEMALE POPULATION
212.54
MALES / 100 FEMALES
47.05
FEMALES / 100 MALES
22.7
MEDIAN AGE
3.1
AVG FAMILY SIZE
2.9
AVG HOUSEHOLD SIZE
6,205
LABOR FORCE [ PEOPLE ]
87.0%
PERCENT IN LABOR FORCE
19.4%
UNEMPLOYMENT RATE
Fort Riley Zip Codes
Fort Riley Area Codes
Income in Fort Riley
Income Overview in Fort Riley
Per Capita Income in Fort Riley is $24,851, while median incomes of families and households are $52,083 and $48,497 respectively.
| Characteristic | Number | Measure |
| Per Capita Income | 8,623 | $24,851 |
| Median Family Income | 1,412 | $52,083 |
| Mean Family Income | 1,412 | $54,297 |
| Median Household Income | 1,654 | $48,497 |
| Mean Household Income | 1,654 | $51,418 |
| Income Deficit | 1,412 | $14,908 |
| Wage / Income Gap (%) | 8,623 | 24.31% |
| Wage / Income Gap ($) | 8,623 | 75.69¢ per $1 |
| Gini / Inequality Index | 8,623 | 0.36 |
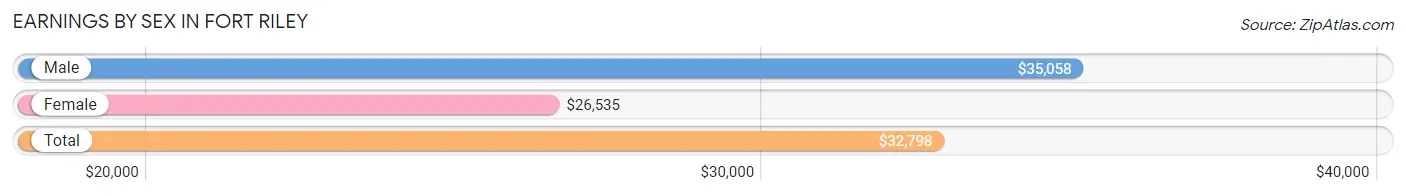
Earnings by Sex in Fort Riley
Average Earnings in Fort Riley are $32,798, $35,058 for men and $26,535 for women, a difference of 24.3%.
| Sex | Number | Average Earnings |
| Male | 5,062 (81.2%) | $35,058 |
| Female | 1,172 (18.8%) | $26,535 |
| Total | 6,234 (100.0%) | $32,798 |
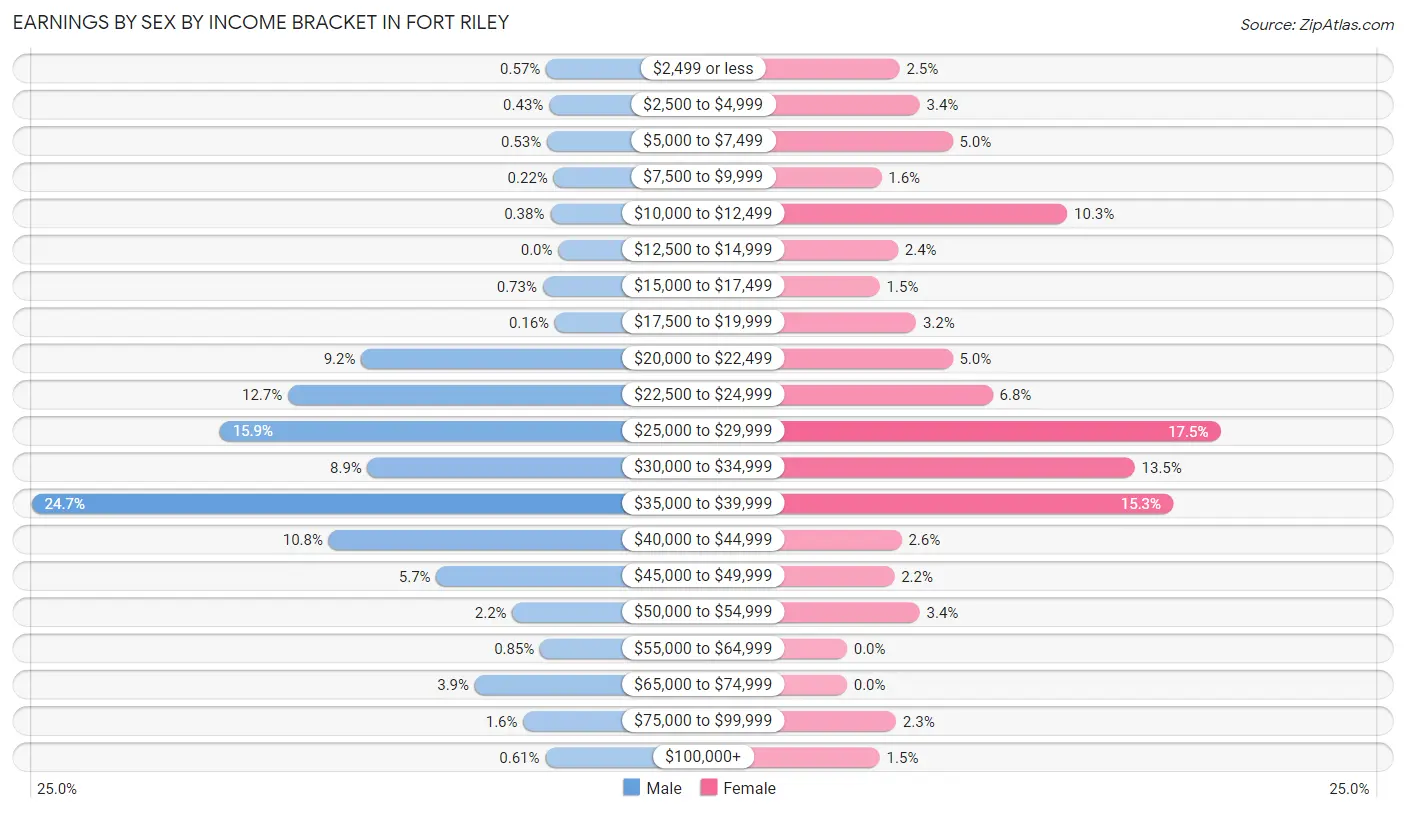
Earnings by Sex by Income Bracket in Fort Riley
The most common earnings brackets in Fort Riley are $35,000 to $39,999 for men (1,249 | 24.7%) and $25,000 to $29,999 for women (205 | 17.5%).
| Income | Male | Female |
| $2,499 or less | 29 (0.6%) | 29 (2.5%) |
| $2,500 to $4,999 | 22 (0.4%) | 40 (3.4%) |
| $5,000 to $7,499 | 27 (0.5%) | 58 (5.0%) |
| $7,500 to $9,999 | 11 (0.2%) | 19 (1.6%) |
| $10,000 to $12,499 | 19 (0.4%) | 121 (10.3%) |
| $12,500 to $14,999 | 0 (0.0%) | 28 (2.4%) |
| $15,000 to $17,499 | 37 (0.7%) | 18 (1.5%) |
| $17,500 to $19,999 | 8 (0.2%) | 38 (3.2%) |
| $20,000 to $22,499 | 467 (9.2%) | 58 (5.0%) |
| $22,500 to $24,999 | 641 (12.7%) | 80 (6.8%) |
| $25,000 to $29,999 | 803 (15.9%) | 205 (17.5%) |
| $30,000 to $34,999 | 452 (8.9%) | 158 (13.5%) |
| $35,000 to $39,999 | 1,249 (24.7%) | 179 (15.3%) |
| $40,000 to $44,999 | 544 (10.7%) | 30 (2.6%) |
| $45,000 to $49,999 | 289 (5.7%) | 26 (2.2%) |
| $50,000 to $54,999 | 109 (2.1%) | 40 (3.4%) |
| $55,000 to $64,999 | 43 (0.9%) | 0 (0.0%) |
| $65,000 to $74,999 | 198 (3.9%) | 0 (0.0%) |
| $75,000 to $99,999 | 83 (1.6%) | 27 (2.3%) |
| $100,000+ | 31 (0.6%) | 18 (1.5%) |
| Total | 5,062 (100.0%) | 1,172 (100.0%) |
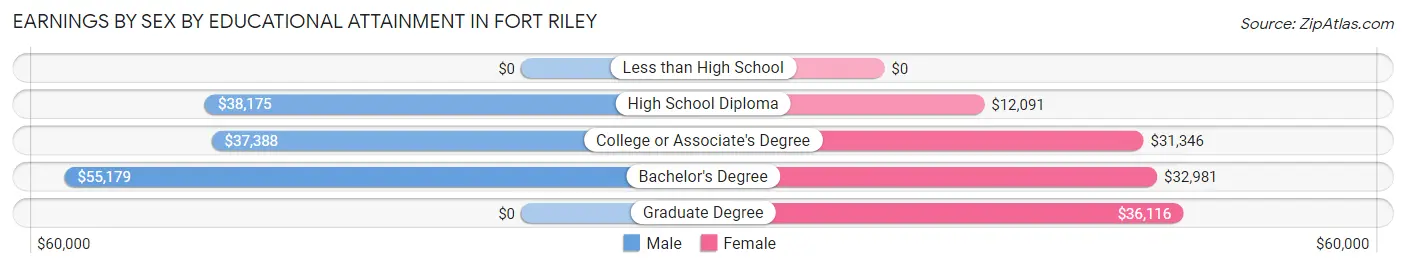
Earnings by Sex by Educational Attainment in Fort Riley
Average earnings in Fort Riley are $38,804 for men and $26,696 for women, a difference of 31.2%. Men with an educational attainment of bachelor's degree enjoy the highest average annual earnings of $55,179, while those with college or associate's degree education earn the least with $37,388. Women with an educational attainment of graduate degree earn the most with the average annual earnings of $36,116, while those with high school diploma education have the smallest earnings of $12,091.
| Educational Attainment | Male Income | Female Income |
| Less than High School | - | - |
| High School Diploma | $38,175 | $12,091 |
| College or Associate's Degree | $37,388 | $31,346 |
| Bachelor's Degree | $55,179 | $32,981 |
| Graduate Degree | - | - |
| Total | $38,804 | $26,696 |
Family Income in Fort Riley
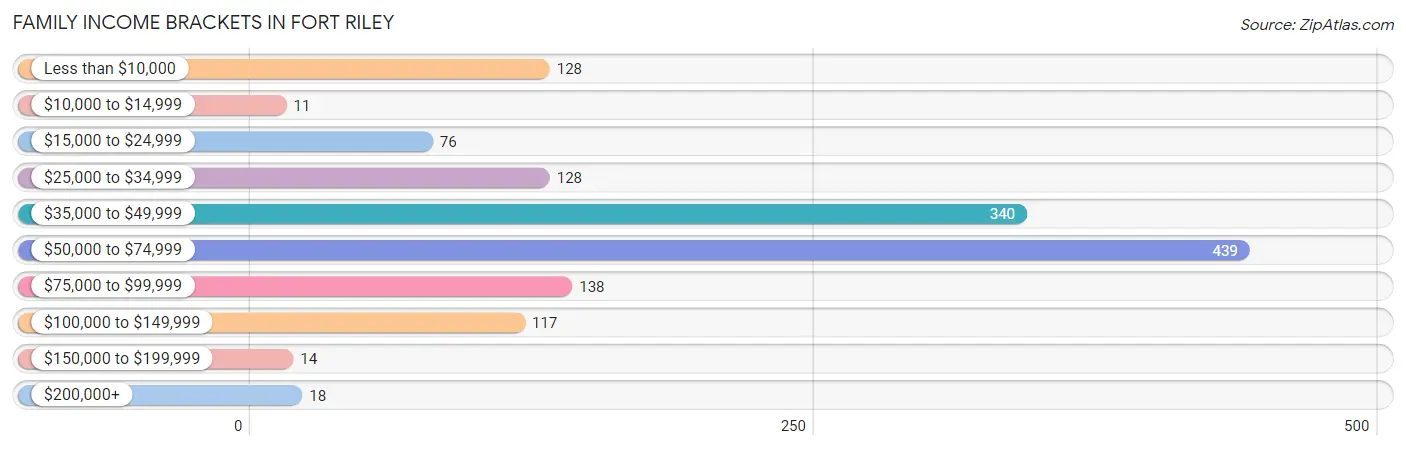
Family Income Brackets in Fort Riley
According to the Fort Riley family income data, there are 439 families falling into the $50,000 to $74,999 income range, which is the most common income bracket and makes up 31.1% of all families. Conversely, the $10,000 to $14,999 income bracket is the least frequent group with only 11 families (0.8%) belonging to this category.
| Income Bracket | # Families | % Families |
| Less than $10,000 | 128 | 9.1% |
| $10,000 to $14,999 | 11 | 0.8% |
| $15,000 to $24,999 | 76 | 5.4% |
| $25,000 to $34,999 | 128 | 9.1% |
| $35,000 to $49,999 | 340 | 24.1% |
| $50,000 to $74,999 | 439 | 31.1% |
| $75,000 to $99,999 | 138 | 9.8% |
| $100,000 to $149,999 | 117 | 8.3% |
| $150,000 to $199,999 | 14 | 1.0% |
| $200,000+ | 18 | 1.3% |
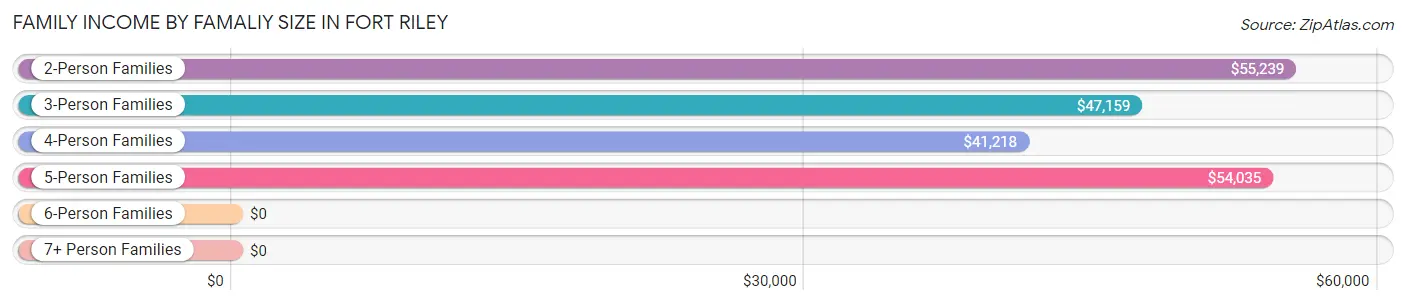
Family Income by Famaliy Size in Fort Riley
2-person families (541 | 38.3%) account for the highest median family income in Fort Riley with $55,239 per family, while 2-person families (541 | 38.3%) have the highest median income of $27,620 per family member.
| Income Bracket | # Families | Median Income |
| 2-Person Families | 541 (38.3%) | $55,239 |
| 3-Person Families | 399 (28.3%) | $47,159 |
| 4-Person Families | 284 (20.1%) | $41,218 |
| 5-Person Families | 181 (12.8%) | $54,035 |
| 6-Person Families | 7 (0.5%) | $0 |
| 7+ Person Families | 0 (0.0%) | $0 |
| Total | 1,412 (100.0%) | $52,083 |
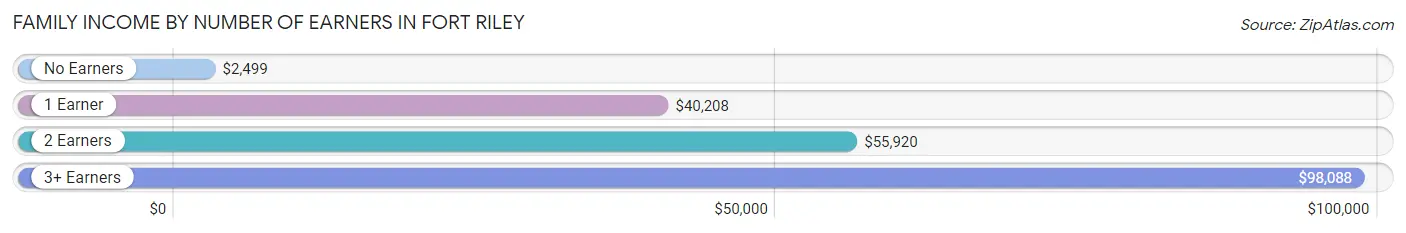
Family Income by Number of Earners in Fort Riley
The median family income in Fort Riley is $52,083, with families comprising 3+ earners (40) having the highest median family income of $98,088, while families with no earners (129) have the lowest median family income of $2,499, accounting for 2.8% and 9.1% of families, respectively.
| Number of Earners | # Families | Median Income |
| No Earners | 129 (9.1%) | $2,499 |
| 1 Earner | 530 (37.5%) | $40,208 |
| 2 Earners | 713 (50.5%) | $55,920 |
| 3+ Earners | 40 (2.8%) | $98,088 |
| Total | 1,412 (100.0%) | $52,083 |
Household Income in Fort Riley
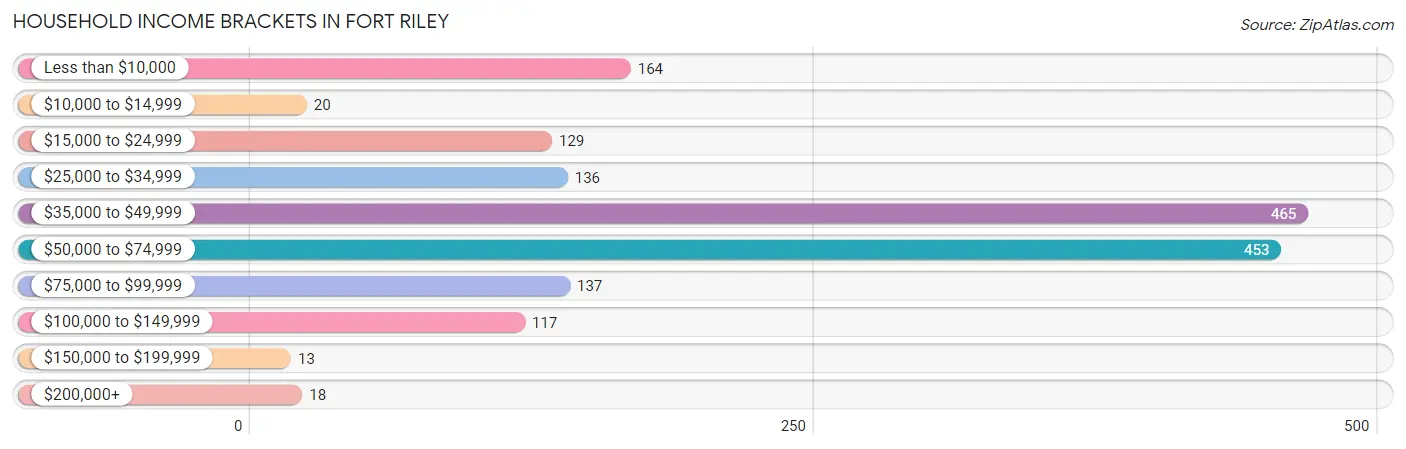
Household Income Brackets in Fort Riley
With 465 households falling in the category, the $35,000 to $49,999 income range is the most frequent in Fort Riley, accounting for 28.1% of all households. In contrast, only 13 households (0.8%) fall into the $150,000 to $199,999 income bracket, making it the least populous group.
| Income Bracket | # Households | % Households |
| Less than $10,000 | 164 | 9.9% |
| $10,000 to $14,999 | 20 | 1.2% |
| $15,000 to $24,999 | 129 | 7.8% |
| $25,000 to $34,999 | 136 | 8.2% |
| $35,000 to $49,999 | 465 | 28.1% |
| $50,000 to $74,999 | 453 | 27.4% |
| $75,000 to $99,999 | 137 | 8.3% |
| $100,000 to $149,999 | 117 | 7.1% |
| $150,000 to $199,999 | 13 | 0.8% |
| $200,000+ | 18 | 1.1% |
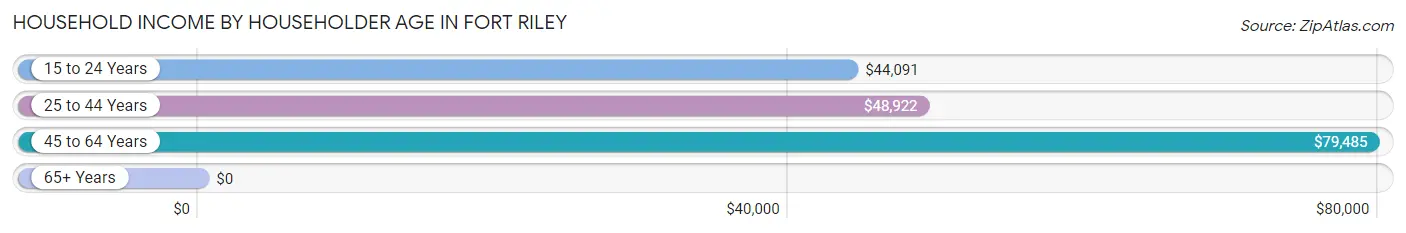
Household Income by Householder Age in Fort Riley
The median household income in Fort Riley is $48,497, with the highest median household income of $79,485 found in the 45 to 64 years age bracket for the primary householder. A total of 53 households (3.2%) fall into this category.
| Income Bracket | # Households | Median Income |
| 15 to 24 Years | 580 (35.1%) | $44,091 |
| 25 to 44 Years | 1,021 (61.7%) | $48,922 |
| 45 to 64 Years | 53 (3.2%) | $79,485 |
| 65+ Years | 0 (0.0%) | $0 |
| Total | 1,654 (100.0%) | $48,497 |
Poverty in Fort Riley
Income Below Poverty by Sex and Age in Fort Riley
With 13.1% poverty level for males and 16.6% for females among the residents of Fort Riley, 5 year old males and 25 to 34 year old females are the most vulnerable to poverty, with 23 males (63.9%) and 207 females (28.7%) in their respective age groups living below the poverty level.
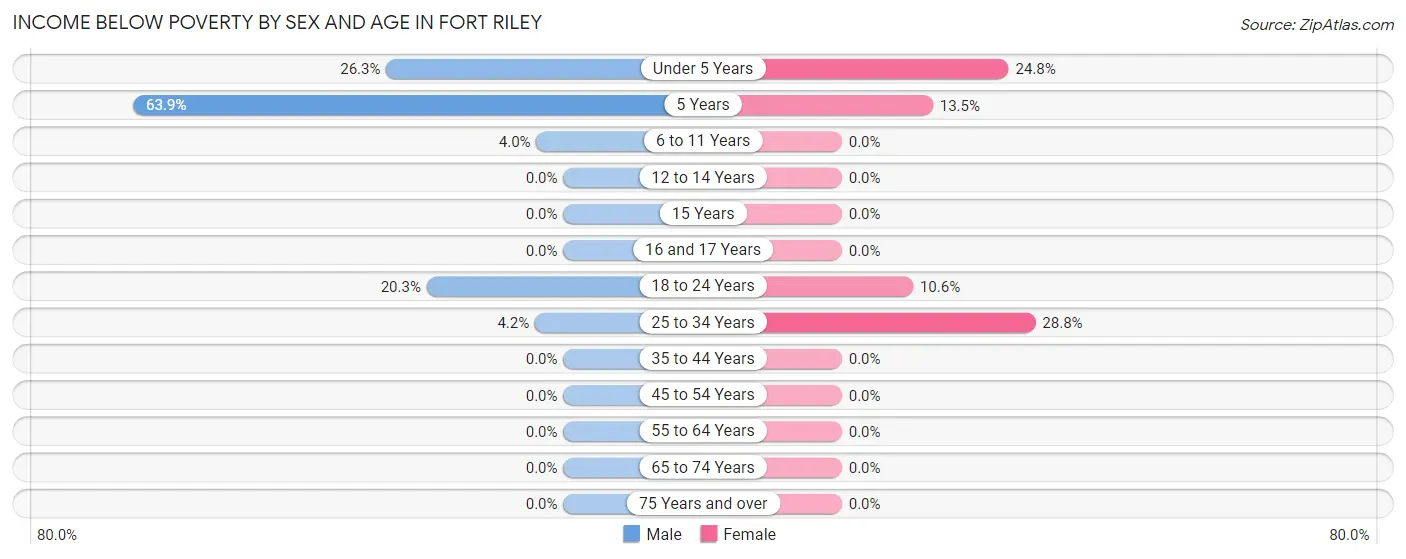
| Age Bracket | Male | Female |
| Under 5 Years | 117 (26.3%) | 127 (24.8%) |
| 5 Years | 23 (63.9%) | 5 (13.5%) |
| 6 to 11 Years | 5 (4.0%) | 0 (0.0%) |
| 12 to 14 Years | 0 (0.0%) | 0 (0.0%) |
| 15 Years | 0 (0.0%) | 0 (0.0%) |
| 16 and 17 Years | 0 (0.0%) | 0 (0.0%) |
| 18 to 24 Years | 125 (20.3%) | 76 (10.6%) |
| 25 to 34 Years | 24 (4.2%) | 207 (28.7%) |
| 35 to 44 Years | 0 (0.0%) | 0 (0.0%) |
| 45 to 54 Years | 0 (0.0%) | 0 (0.0%) |
| 55 to 64 Years | 0 (0.0%) | 0 (0.0%) |
| 65 to 74 Years | 0 (0.0%) | 0 (0.0%) |
| 75 Years and over | 0 (0.0%) | 0 (0.0%) |
| Total | 294 (13.1%) | 415 (16.6%) |
Income Above Poverty by Sex and Age in Fort Riley
According to the poverty statistics in Fort Riley, males aged 12 to 14 years and females aged 6 to 11 years are the age groups that are most secure financially, with 100.0% of males and 100.0% of females in these age groups living above the poverty line.
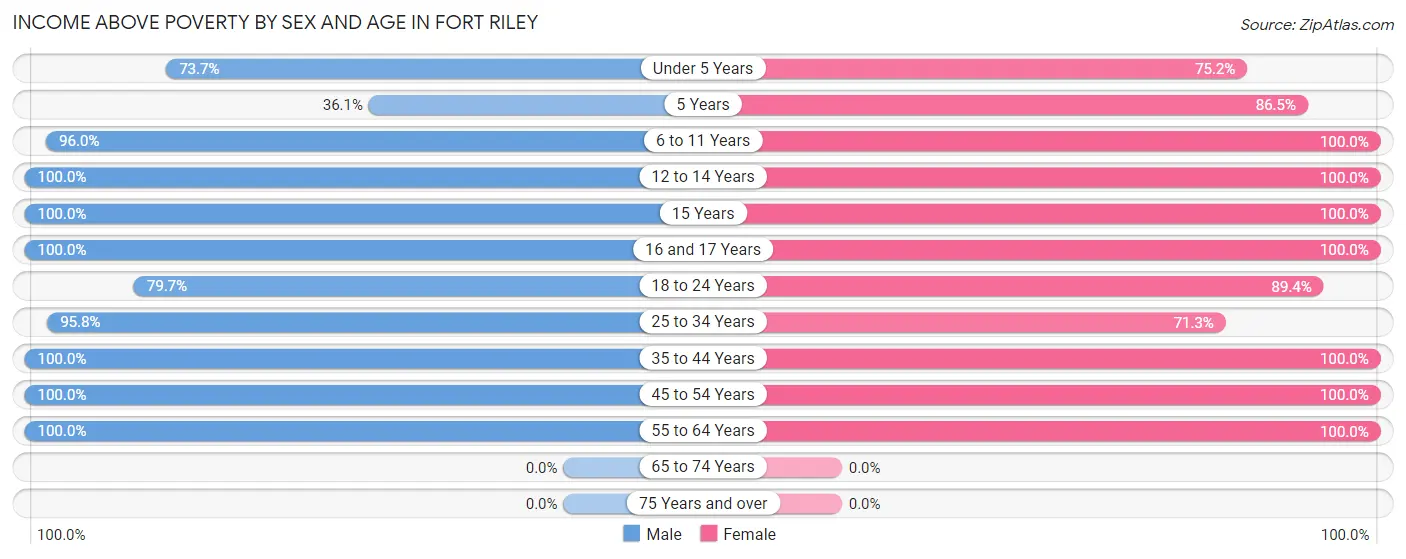
| Age Bracket | Male | Female |
| Under 5 Years | 328 (73.7%) | 386 (75.2%) |
| 5 Years | 13 (36.1%) | 32 (86.5%) |
| 6 to 11 Years | 120 (96.0%) | 183 (100.0%) |
| 12 to 14 Years | 81 (100.0%) | 41 (100.0%) |
| 15 Years | 17 (100.0%) | 13 (100.0%) |
| 16 and 17 Years | 18 (100.0%) | 27 (100.0%) |
| 18 to 24 Years | 491 (79.7%) | 643 (89.4%) |
| 25 to 34 Years | 548 (95.8%) | 513 (71.3%) |
| 35 to 44 Years | 291 (100.0%) | 199 (100.0%) |
| 45 to 54 Years | 40 (100.0%) | 14 (100.0%) |
| 55 to 64 Years | 3 (100.0%) | 29 (100.0%) |
| 65 to 74 Years | 0 (0.0%) | 0 (0.0%) |
| 75 Years and over | 0 (0.0%) | 0 (0.0%) |
| Total | 1,950 (86.9%) | 2,080 (83.4%) |
Income Below Poverty Among Married-Couple Families in Fort Riley
The poverty statistics for married-couple families in Fort Riley show that 8.1% or 101 of the total 1,246 families live below the poverty line. Families with 3 or 4 children have the highest poverty rate of 26.8%, comprising of 42 families. On the other hand, families with no children have the lowest poverty rate of 3.0%, which includes 15 families.
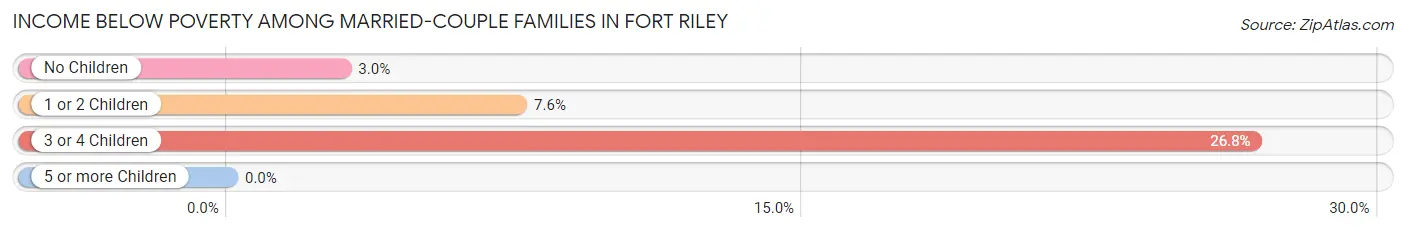
| Children | Above Poverty | Below Poverty |
| No Children | 491 (97.0%) | 15 (3.0%) |
| 1 or 2 Children | 539 (92.4%) | 44 (7.5%) |
| 3 or 4 Children | 115 (73.3%) | 42 (26.8%) |
| 5 or more Children | 0 (0.0%) | 0 (0.0%) |
| Total | 1,145 (91.9%) | 101 (8.1%) |
Income Below Poverty Among Single-Parent Households in Fort Riley
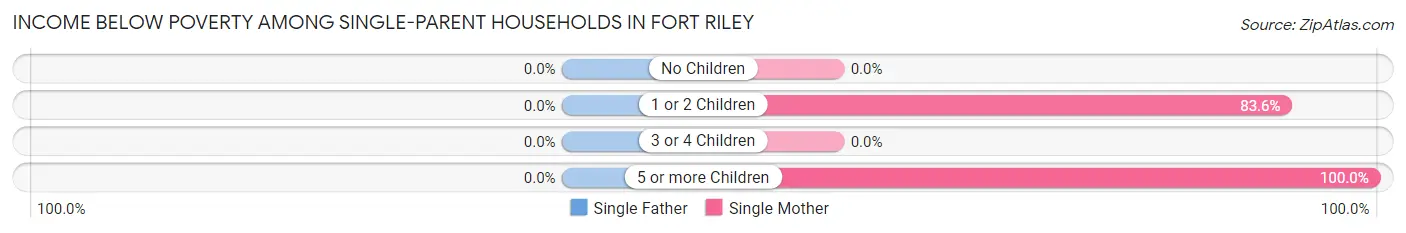
| Children | Single Father | Single Mother |
| No Children | 0 (0.0%) | 0 (0.0%) |
| 1 or 2 Children | 0 (0.0%) | 122 (83.6%) |
| 3 or 4 Children | 0 (0.0%) | 0 (0.0%) |
| 5 or more Children | 0 (0.0%) | 7 (100.0%) |
| Total | 0 (0.0%) | 129 (84.3%) |
Income Below Poverty Among Married-Couple vs Single-Parent Households in Fort Riley
The poverty data for Fort Riley shows that 101 of the married-couple family households (8.1%) and 129 of the single-parent households (77.7%) are living below the poverty level. Within the married-couple family households, those with 3 or 4 children have the highest poverty rate, with 42 households (26.8%) falling below the poverty line. Among the single-parent households, those with 5 or more children have the highest poverty rate, with 7 household (100.0%) living below poverty.
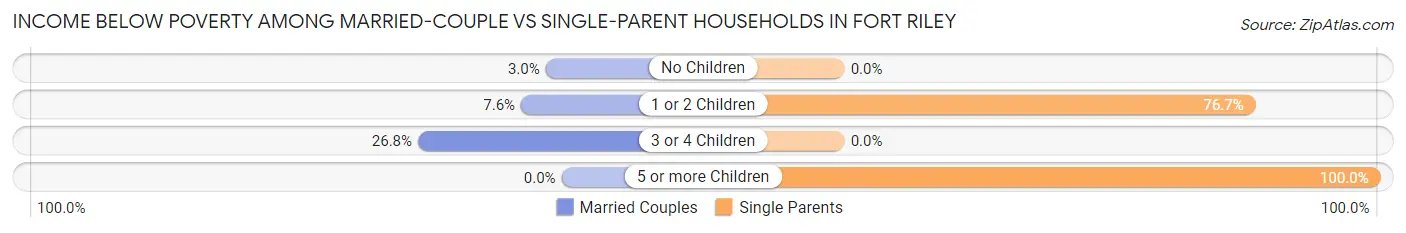
| Children | Married-Couple Families | Single-Parent Households |
| No Children | 15 (3.0%) | 0 (0.0%) |
| 1 or 2 Children | 44 (7.5%) | 122 (76.7%) |
| 3 or 4 Children | 42 (26.8%) | 0 (0.0%) |
| 5 or more Children | 0 (0.0%) | 7 (100.0%) |
| Total | 101 (8.1%) | 129 (77.7%) |
Race in Fort Riley
The most populous races in Fort Riley are White / Caucasian (5,582 | 64.7%), Hispanic or Latino (1,663 | 19.3%), and Black / African American (1,645 | 19.1%).
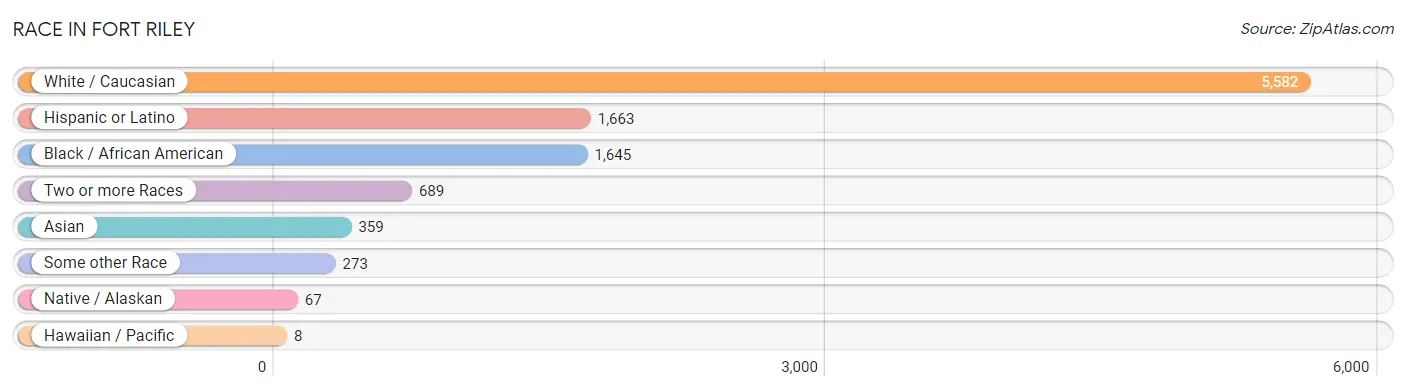
| Race | # Population | % Population |
| Asian | 359 | 4.2% |
| Black / African American | 1,645 | 19.1% |
| Hawaiian / Pacific | 8 | 0.1% |
| Hispanic or Latino | 1,663 | 19.3% |
| Native / Alaskan | 67 | 0.8% |
| White / Caucasian | 5,582 | 64.7% |
| Two or more Races | 689 | 8.0% |
| Some other Race | 273 | 3.2% |
| Total | 8,623 | 100.0% |
Ancestry in Fort Riley
The most populous ancestries reported in Fort Riley are American (2,043 | 23.7%), Mexican (1,314 | 15.2%), German (985 | 11.4%), Irish (511 | 5.9%), and English (371 | 4.3%), together accounting for 60.6% of all Fort Riley residents.
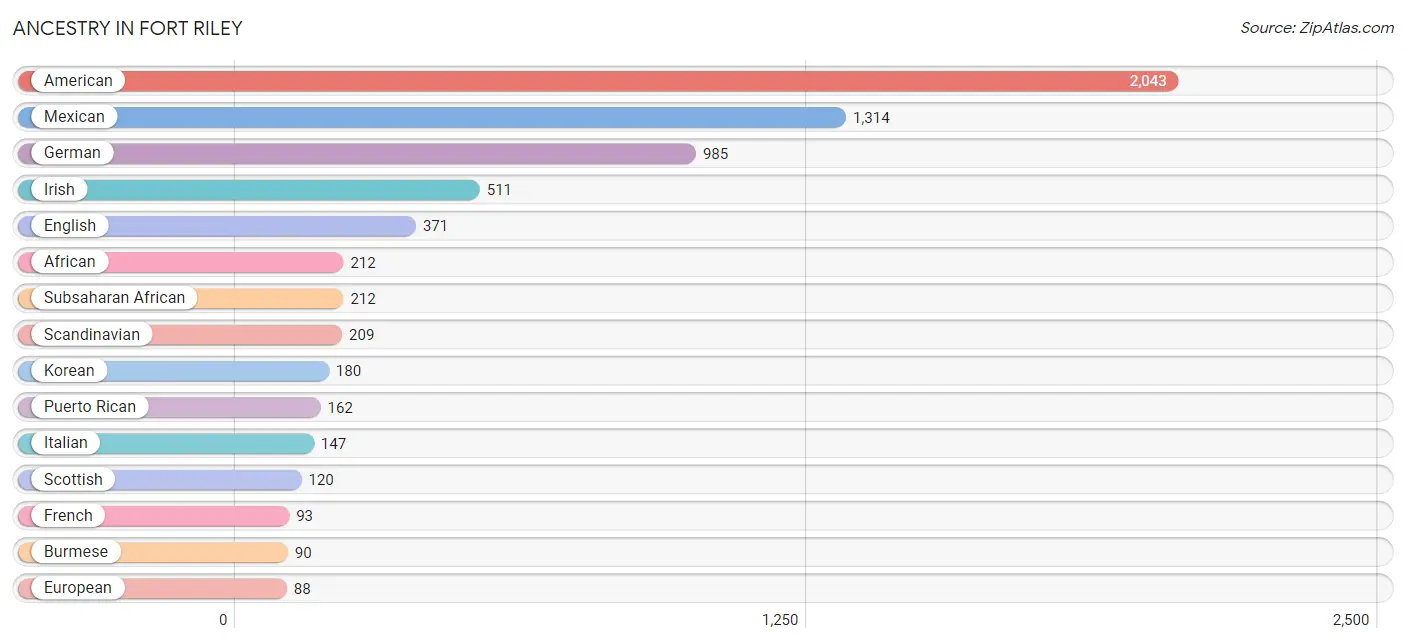
| Ancestry | # Population | % Population |
| African | 212 | 2.5% |
| American | 2,043 | 23.7% |
| Apache | 53 | 0.6% |
| Arab | 26 | 0.3% |
| Bhutanese | 4 | 0.1% |
| Blackfeet | 11 | 0.1% |
| Brazilian | 10 | 0.1% |
| British | 20 | 0.2% |
| Burmese | 90 | 1.0% |
| Canadian | 26 | 0.3% |
| Central American | 71 | 0.8% |
| Cherokee | 35 | 0.4% |
| Chippewa | 5 | 0.1% |
| Colombian | 24 | 0.3% |
| Creek | 8 | 0.1% |
| Cuban | 26 | 0.3% |
| Dominican | 16 | 0.2% |
| English | 371 | 4.3% |
| European | 88 | 1.0% |
| French | 93 | 1.1% |
| French Canadian | 8 | 0.1% |
| German | 985 | 11.4% |
| German Russian | 43 | 0.5% |
| Guatemalan | 33 | 0.4% |
| Honduran | 7 | 0.1% |
| Indian (Asian) | 26 | 0.3% |
| Irish | 511 | 5.9% |
| Iroquois | 8 | 0.1% |
| Italian | 147 | 1.7% |
| Jamaican | 5 | 0.1% |
| Japanese | 65 | 0.7% |
| Korean | 180 | 2.1% |
| Lebanese | 26 | 0.3% |
| Malaysian | 28 | 0.3% |
| Mexican | 1,314 | 15.2% |
| Native Hawaiian | 42 | 0.5% |
| Navajo | 11 | 0.1% |
| Norwegian | 57 | 0.7% |
| Pakistani | 29 | 0.3% |
| Polish | 85 | 1.0% |
| Puerto Rican | 162 | 1.9% |
| Russian | 17 | 0.2% |
| Salvadoran | 31 | 0.4% |
| Scandinavian | 209 | 2.4% |
| Scottish | 120 | 1.4% |
| Sioux | 33 | 0.4% |
| South American | 24 | 0.3% |
| Spaniard | 11 | 0.1% |
| Spanish | 16 | 0.2% |
| Sri Lankan | 61 | 0.7% |
| Subsaharan African | 212 | 2.5% |
| Thai | 86 | 1.0% |
| Ukrainian | 14 | 0.2% |
| Welsh | 21 | 0.2% | View All 54 Rows |
Immigrants in Fort Riley
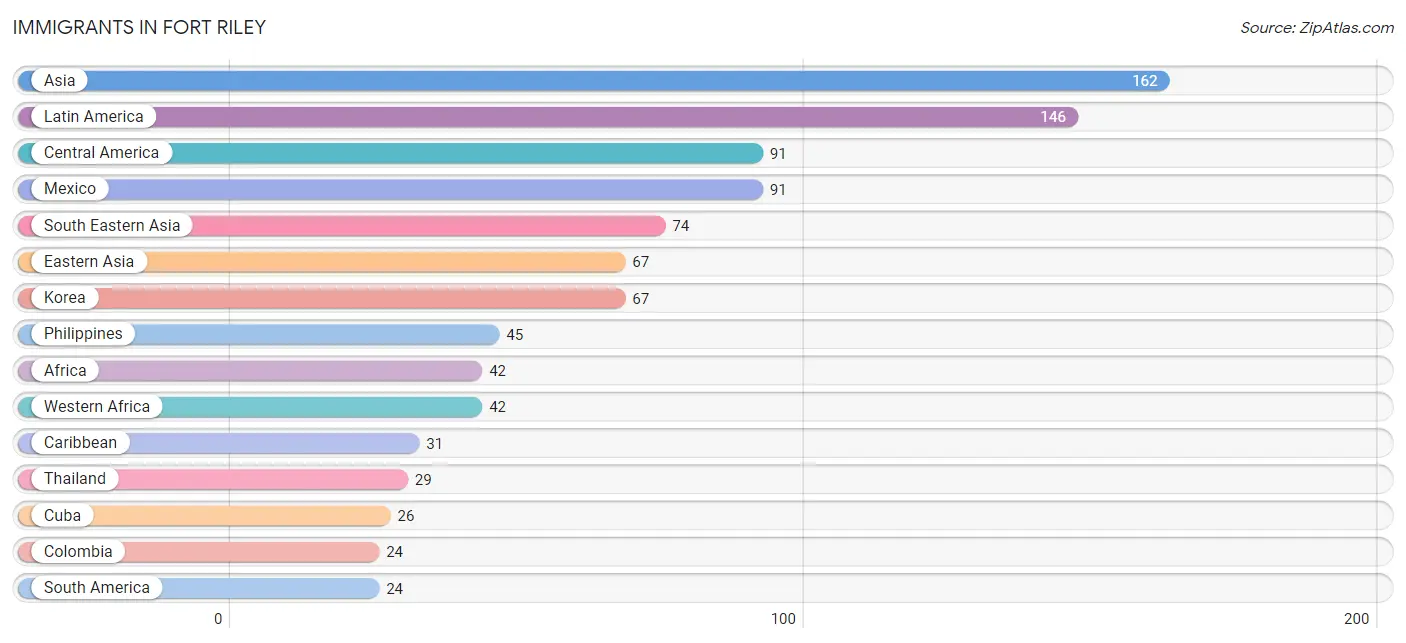
The most numerous immigrant groups reported in Fort Riley came from Asia (162 | 1.9%), Latin America (146 | 1.7%), Central America (91 | 1.1%), Mexico (91 | 1.1%), and South Eastern Asia (74 | 0.9%), together accounting for 6.5% of all Fort Riley residents.
| Immigration Origin | # Population | % Population |
| Africa | 42 | 0.5% |
| Asia | 162 | 1.9% |
| Caribbean | 31 | 0.4% |
| Central America | 91 | 1.1% |
| Colombia | 24 | 0.3% |
| Cuba | 26 | 0.3% |
| Eastern Asia | 67 | 0.8% |
| India | 21 | 0.2% |
| Jamaica | 5 | 0.1% |
| Korea | 67 | 0.8% |
| Latin America | 146 | 1.7% |
| Mexico | 91 | 1.1% |
| Micronesia | 18 | 0.2% |
| Oceania | 18 | 0.2% |
| Philippines | 45 | 0.5% |
| South America | 24 | 0.3% |
| South Central Asia | 21 | 0.2% |
| South Eastern Asia | 74 | 0.9% |
| Thailand | 29 | 0.3% |
| Western Africa | 42 | 0.5% | View All 20 Rows |
Sex and Age in Fort Riley
Sex and Age in Fort Riley
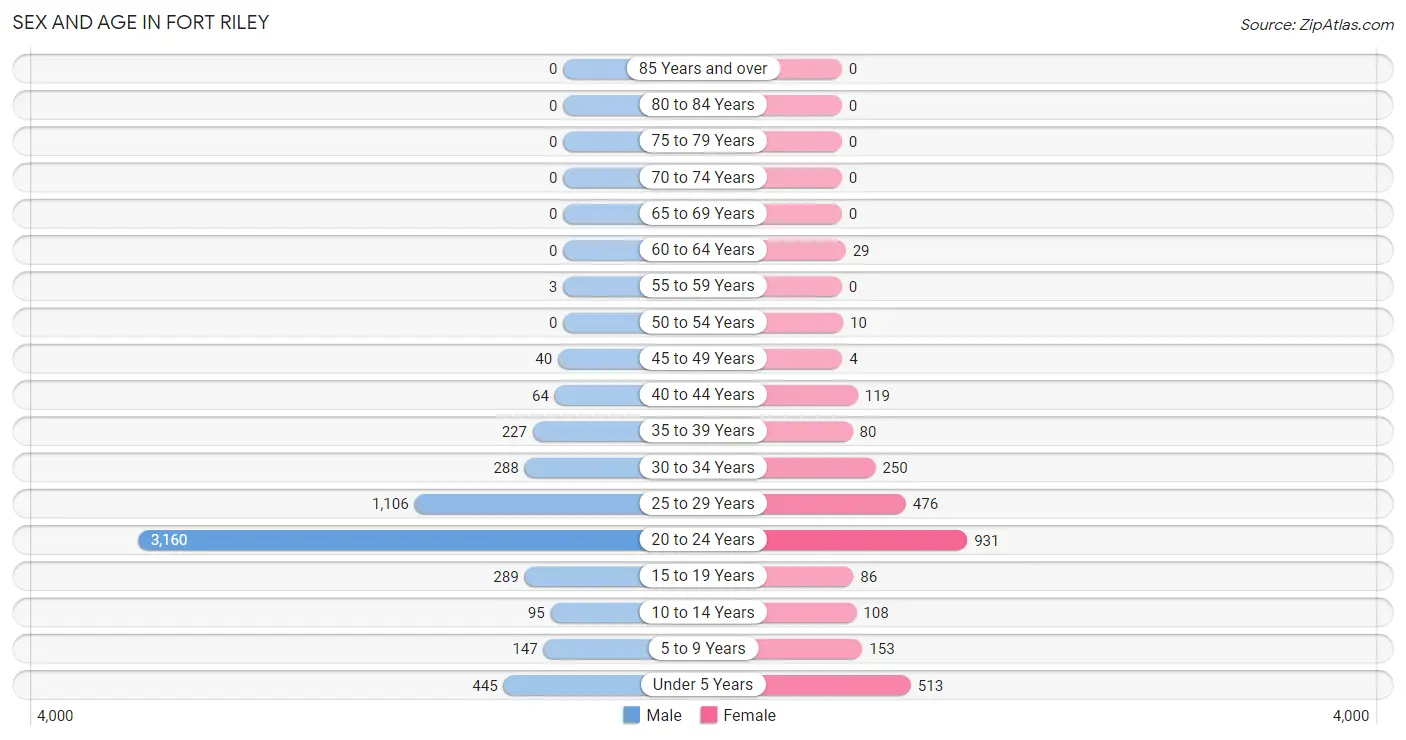
The most populous age groups in Fort Riley are 20 to 24 Years (3,160 | 53.9%) for men and 20 to 24 Years (931 | 33.7%) for women.
| Age Bracket | Male | Female |
| Under 5 Years | 445 (7.6%) | 513 (18.6%) |
| 5 to 9 Years | 147 (2.5%) | 153 (5.6%) |
| 10 to 14 Years | 95 (1.6%) | 108 (3.9%) |
| 15 to 19 Years | 289 (4.9%) | 86 (3.1%) |
| 20 to 24 Years | 3,160 (53.9%) | 931 (33.7%) |
| 25 to 29 Years | 1,106 (18.9%) | 476 (17.2%) |
| 30 to 34 Years | 288 (4.9%) | 250 (9.1%) |
| 35 to 39 Years | 227 (3.9%) | 80 (2.9%) |
| 40 to 44 Years | 64 (1.1%) | 119 (4.3%) |
| 45 to 49 Years | 40 (0.7%) | 4 (0.1%) |
| 50 to 54 Years | 0 (0.0%) | 10 (0.4%) |
| 55 to 59 Years | 3 (0.1%) | 0 (0.0%) |
| 60 to 64 Years | 0 (0.0%) | 29 (1.1%) |
| 65 to 69 Years | 0 (0.0%) | 0 (0.0%) |
| 70 to 74 Years | 0 (0.0%) | 0 (0.0%) |
| 75 to 79 Years | 0 (0.0%) | 0 (0.0%) |
| 80 to 84 Years | 0 (0.0%) | 0 (0.0%) |
| 85 Years and over | 0 (0.0%) | 0 (0.0%) |
| Total | 5,864 (100.0%) | 2,759 (100.0%) |
Families and Households in Fort Riley
Median Family Size in Fort Riley
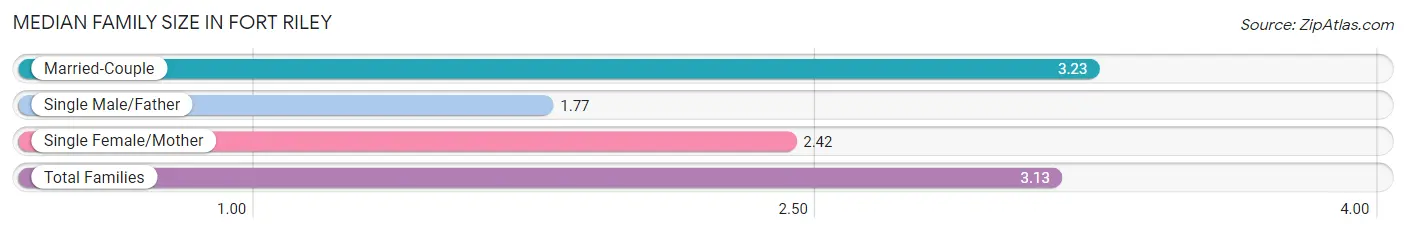
The median family size in Fort Riley is 3.13 persons per family, with married-couple families (1,246 | 88.2%) accounting for the largest median family size of 3.23 persons per family. On the other hand, single male/father families (13 | 0.9%) represent the smallest median family size with 1.77 persons per family.
| Family Type | # Families | Family Size |
| Married-Couple | 1,246 (88.2%) | 3.23 |
| Single Male/Father | 13 (0.9%) | 1.77 |
| Single Female/Mother | 153 (10.8%) | 2.42 |
| Total Families | 1,412 (100.0%) | 3.13 |
Median Household Size in Fort Riley
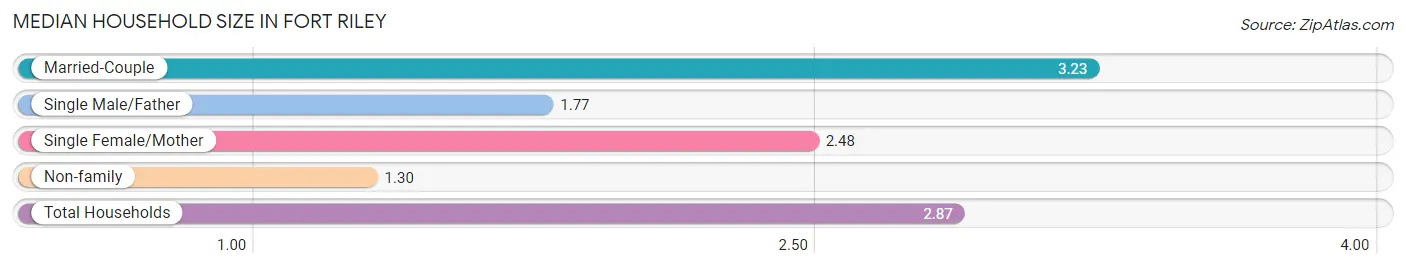
The median household size in Fort Riley is 2.87 persons per household, with married-couple households (1,246 | 75.3%) accounting for the largest median household size of 3.23 persons per household. non-family households (242 | 14.6%) represent the smallest median household size with 1.30 persons per household.
| Household Type | # Households | Household Size |
| Married-Couple | 1,246 (75.3%) | 3.23 |
| Single Male/Father | 13 (0.8%) | 1.77 |
| Single Female/Mother | 153 (9.2%) | 2.48 |
| Non-family | 242 (14.6%) | 1.30 |
| Total Households | 1,654 (100.0%) | 2.87 |
Household Size by Marriage Status in Fort Riley
Out of a total of 1,654 households in Fort Riley, 1,412 (85.4%) are family households, while 242 (14.6%) are nonfamily households. The most numerous type of family households are 2-person households, comprising 532, and the most common type of nonfamily households are 1-person households, comprising 213.
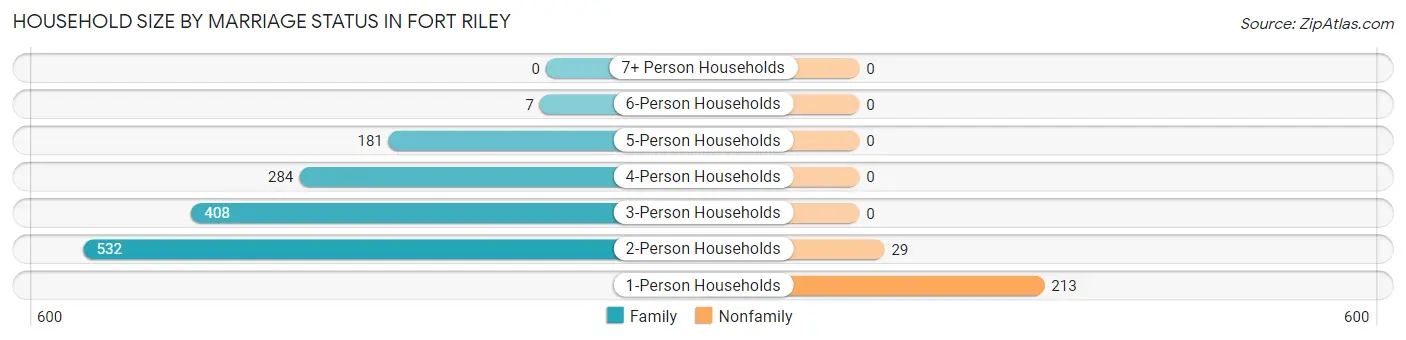
| Household Size | Family Households | Nonfamily Households |
| 1-Person Households | - | 213 (12.9%) |
| 2-Person Households | 532 (32.2%) | 29 (1.8%) |
| 3-Person Households | 408 (24.7%) | 0 (0.0%) |
| 4-Person Households | 284 (17.2%) | 0 (0.0%) |
| 5-Person Households | 181 (10.9%) | 0 (0.0%) |
| 6-Person Households | 7 (0.4%) | 0 (0.0%) |
| 7+ Person Households | 0 (0.0%) | 0 (0.0%) |
| Total | 1,412 (85.4%) | 242 (14.6%) |
Female Fertility in Fort Riley
Fertility by Age in Fort Riley
Average fertility rate in Fort Riley is 222.0 births per 1,000 women. Women in the age bracket of 20 to 34 years have the highest fertility rate with 261.0 births per 1,000 women. Women in the age bracket of 20 to 34 years acount for 100.0% of all women with births.
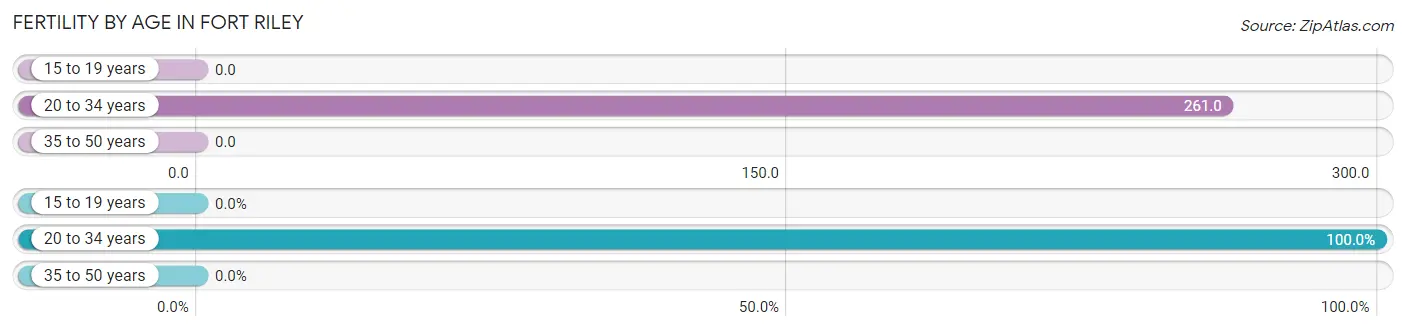
| Age Bracket | Women with Births | Births / 1,000 Women |
| 15 to 19 years | 0 (0.0%) | 0.0 |
| 20 to 34 years | 432 (100.0%) | 261.0 |
| 35 to 50 years | 0 (0.0%) | 0.0 |
| Total | 432 (100.0%) | 222.0 |
Fertility by Age by Marriage Status in Fort Riley
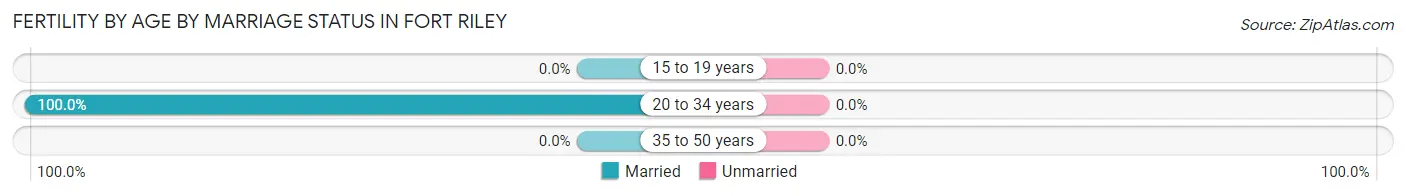
| Age Bracket | Married | Unmarried |
| 15 to 19 years | 0 (0.0%) | 0 (0.0%) |
| 20 to 34 years | 432 (100.0%) | 0 (0.0%) |
| 35 to 50 years | 0 (0.0%) | 0 (0.0%) |
| Total | 432 (100.0%) | 0 (0.0%) |
Fertility by Education in Fort Riley
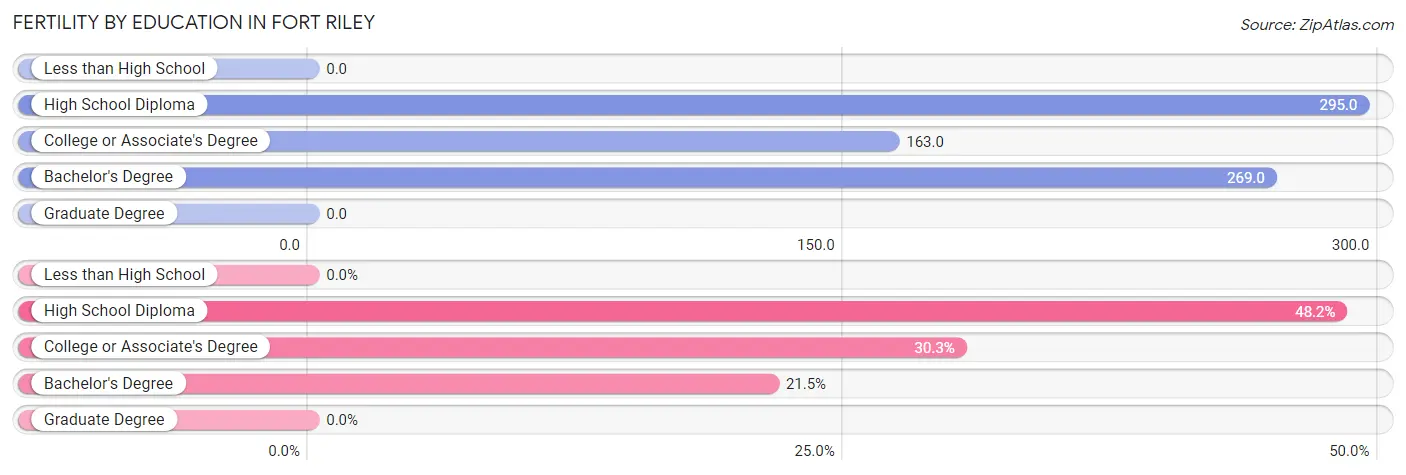
| Educational Attainment | Women with Births | Births / 1,000 Women |
| Less than High School | 0 (0.0%) | 0.0 |
| High School Diploma | 208 (48.1%) | 295.0 |
| College or Associate's Degree | 131 (30.3%) | 163.0 |
| Bachelor's Degree | 93 (21.5%) | 269.0 |
| Graduate Degree | 0 (0.0%) | 0.0 |
| Total | 432 (100.0%) | 222.0 |
Fertility by Education by Marriage Status in Fort Riley
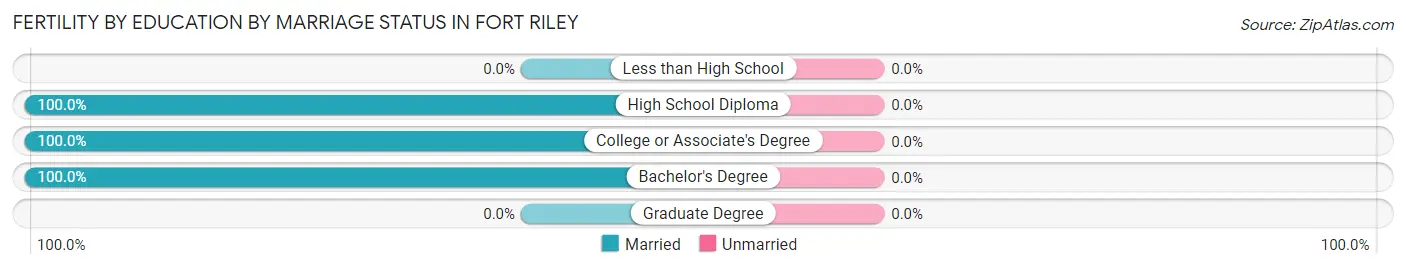
| Educational Attainment | Married | Unmarried |
| Less than High School | 0 (0.0%) | 0 (0.0%) |
| High School Diploma | 208 (100.0%) | 0 (0.0%) |
| College or Associate's Degree | 131 (100.0%) | 0 (0.0%) |
| Bachelor's Degree | 93 (100.0%) | 0 (0.0%) |
| Graduate Degree | 0 (0.0%) | 0 (0.0%) |
| Total | 432 (100.0%) | 0 (0.0%) |
Employment Characteristics in Fort Riley
Employment by Class of Employer in Fort Riley
Among the 5,979 employed individuals in Fort Riley, federal government employees (5,339 | 89.3%), private company employees (443 | 7.4%), and state government employees (85 | 1.4%) make up the most common classes of employment.
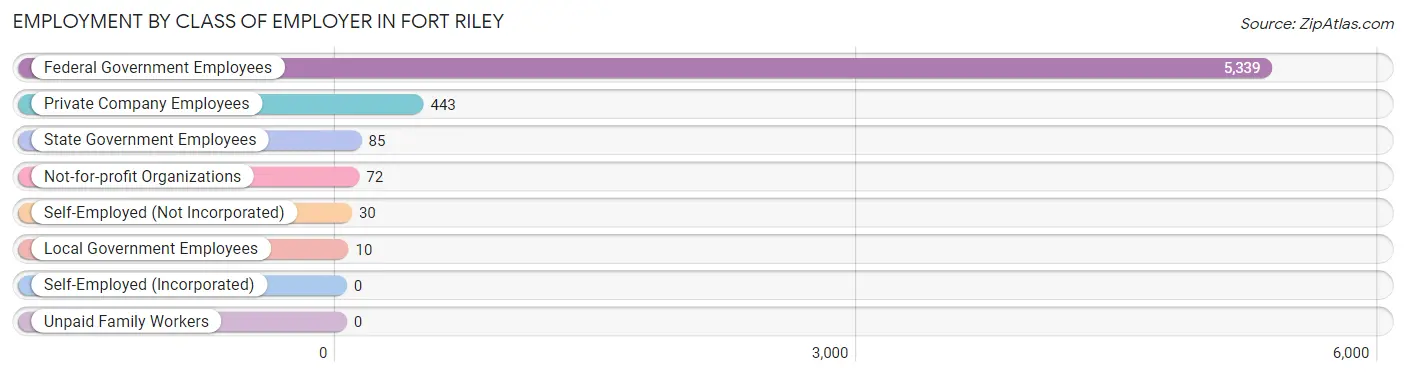
| Employer Class | # Employees | % Employees |
| Private Company Employees | 443 | 7.4% |
| Self-Employed (Incorporated) | 0 | 0.0% |
| Self-Employed (Not Incorporated) | 30 | 0.5% |
| Not-for-profit Organizations | 72 | 1.2% |
| Local Government Employees | 10 | 0.2% |
| State Government Employees | 85 | 1.4% |
| Federal Government Employees | 5,339 | 89.3% |
| Unpaid Family Workers | 0 | 0.0% |
| Total | 5,979 | 100.0% |
Employment Status by Age in Fort Riley
According to the labor force statistics for Fort Riley, out of the total population over 16 years of age (7,132), 87.0% or 6,205 individuals are in the labor force, with 19.4% or 1,204 of them unemployed. The age group with the highest labor force participation rate is 45 to 54 years, with 100.0% or 54 individuals in the labor force. Within the labor force, the 60 to 64 years age range has the highest percentage of unemployed individuals, with 65.5% or 19 of them being unemployed.
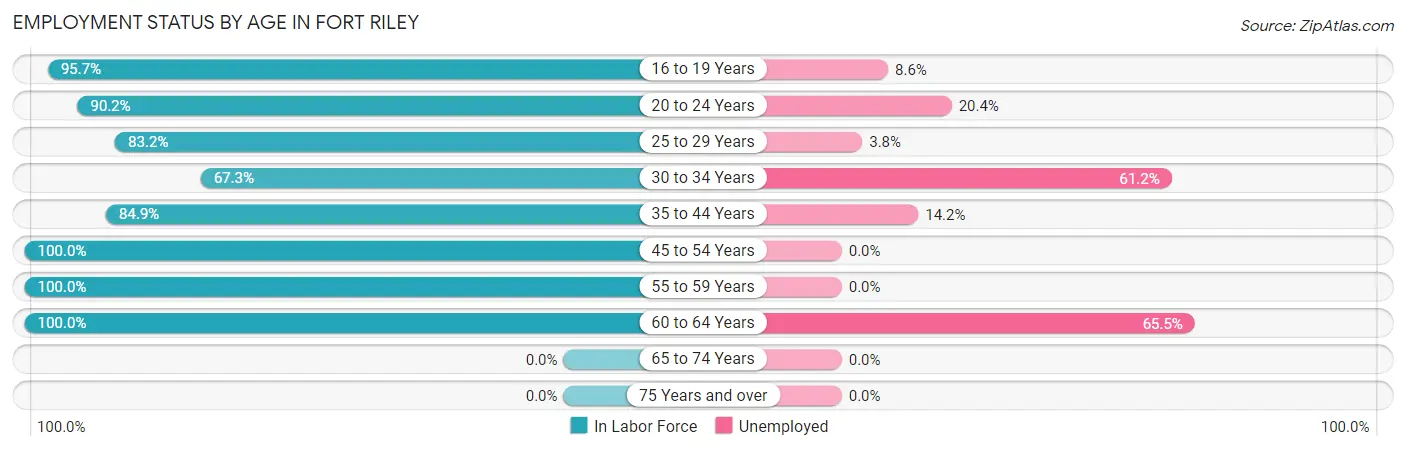
| Age Bracket | In Labor Force | Unemployed |
| 16 to 19 Years | 330 (95.7%) | 28 (8.6%) |
| 20 to 24 Years | 3,690 (90.2%) | 753 (20.4%) |
| 25 to 29 Years | 1,316 (83.2%) | 50 (3.8%) |
| 30 to 34 Years | 362 (67.3%) | 222 (61.2%) |
| 35 to 44 Years | 416 (84.9%) | 59 (14.2%) |
| 45 to 54 Years | 54 (100.0%) | 0 (0.0%) |
| 55 to 59 Years | 3 (100.0%) | 0 (0.0%) |
| 60 to 64 Years | 29 (100.0%) | 19 (65.5%) |
| 65 to 74 Years | 0 (0.0%) | 0 (0.0%) |
| 75 Years and over | 0 (0.0%) | 0 (0.0%) |
| Total | 6,205 (87.0%) | 1,204 (19.4%) |
Employment Status by Educational Attainment in Fort Riley
According to labor force statistics for Fort Riley, 80.9% of individuals (2,181) out of the total population between 25 and 64 years of age (2,696) are in the labor force, with 20.0% or 436 of them being unemployed. The group with the highest labor force participation rate are those with the educational attainment of less than high school, with 100.0% or 6 individuals in the labor force. Within the labor force, individuals with high school diploma education have the highest percentage of unemployment, with 42.6% or 303 of them being unemployed.
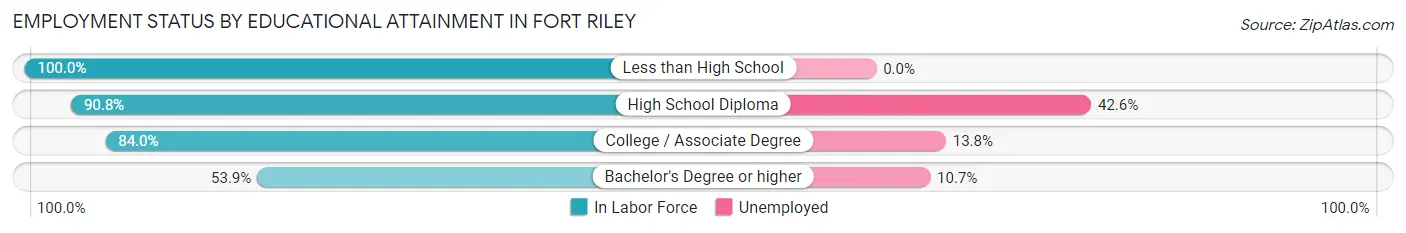
| Educational Attainment | In Labor Force | Unemployed |
| Less than High School | 6 (100.0%) | 0 (0.0%) |
| High School Diploma | 711 (90.8%) | 334 (42.6%) |
| College / Associate Degree | 1,215 (84.0%) | 200 (13.8%) |
| Bachelor's Degree or higher | 248 (53.9%) | 49 (10.7%) |
| Total | 2,181 (80.9%) | 539 (20.0%) |
Employment Occupations by Sex in Fort Riley
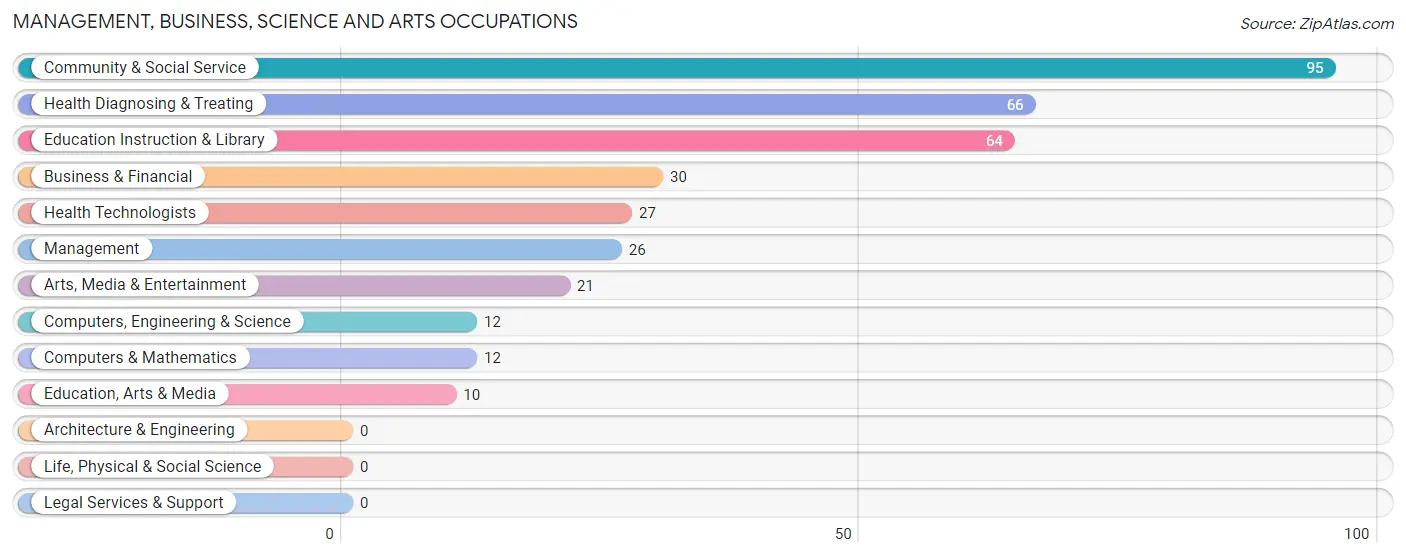
Management, Business, Science and Arts Occupations
The most common Management, Business, Science and Arts occupations in Fort Riley are Community & Social Service (95 | 12.5%), Health Diagnosing & Treating (66 | 8.7%), Education Instruction & Library (64 | 8.4%), Business & Financial (30 | 4.0%), and Health Technologists (27 | 3.6%).
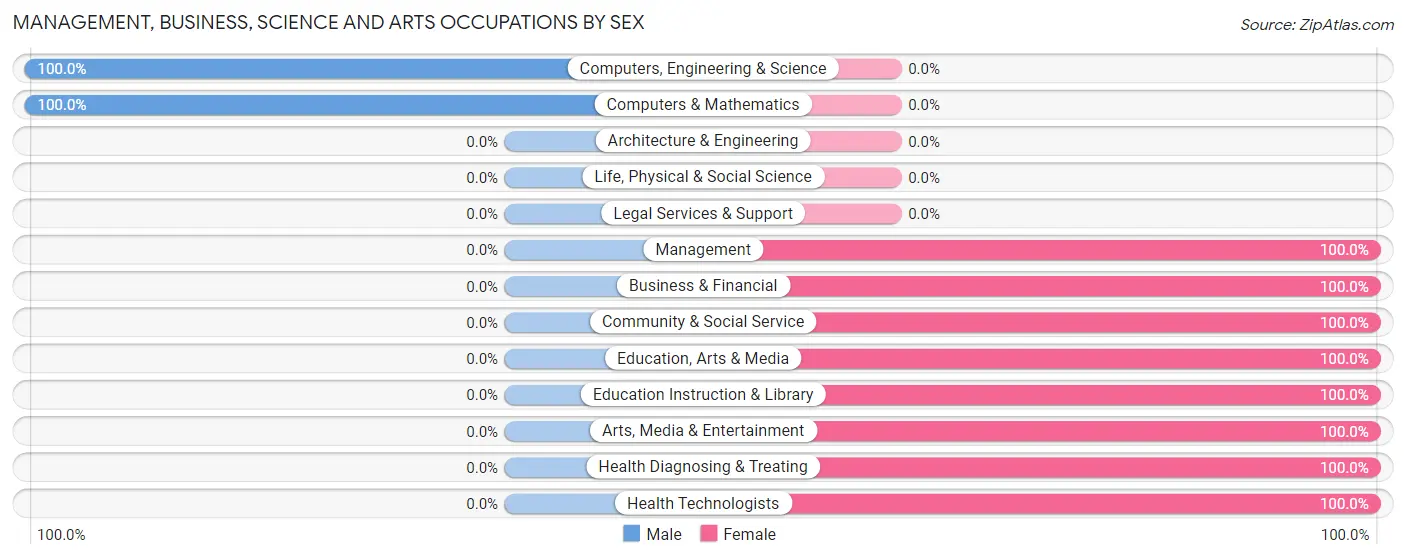
Management, Business, Science and Arts Occupations by Sex
Within the Management, Business, Science and Arts occupations in Fort Riley, the most male-oriented occupations are Computers, Engineering & Science (100.0%), and Computers & Mathematics (100.0%), while the most female-oriented occupations are Management (100.0%), Business & Financial (100.0%), and Community & Social Service (100.0%).
| Occupation | Male | Female |
| Management | 0 (0.0%) | 26 (100.0%) |
| Business & Financial | 0 (0.0%) | 30 (100.0%) |
| Computers, Engineering & Science | 12 (100.0%) | 0 (0.0%) |
| Computers & Mathematics | 12 (100.0%) | 0 (0.0%) |
| Architecture & Engineering | 0 (0.0%) | 0 (0.0%) |
| Life, Physical & Social Science | 0 (0.0%) | 0 (0.0%) |
| Community & Social Service | 0 (0.0%) | 95 (100.0%) |
| Education, Arts & Media | 0 (0.0%) | 10 (100.0%) |
| Legal Services & Support | 0 (0.0%) | 0 (0.0%) |
| Education Instruction & Library | 0 (0.0%) | 64 (100.0%) |
| Arts, Media & Entertainment | 0 (0.0%) | 21 (100.0%) |
| Health Diagnosing & Treating | 0 (0.0%) | 66 (100.0%) |
| Health Technologists | 0 (0.0%) | 27 (100.0%) |
| Total (Category) | 12 (5.2%) | 217 (94.8%) |
| Total (Overall) | 98 (12.9%) | 660 (87.1%) |
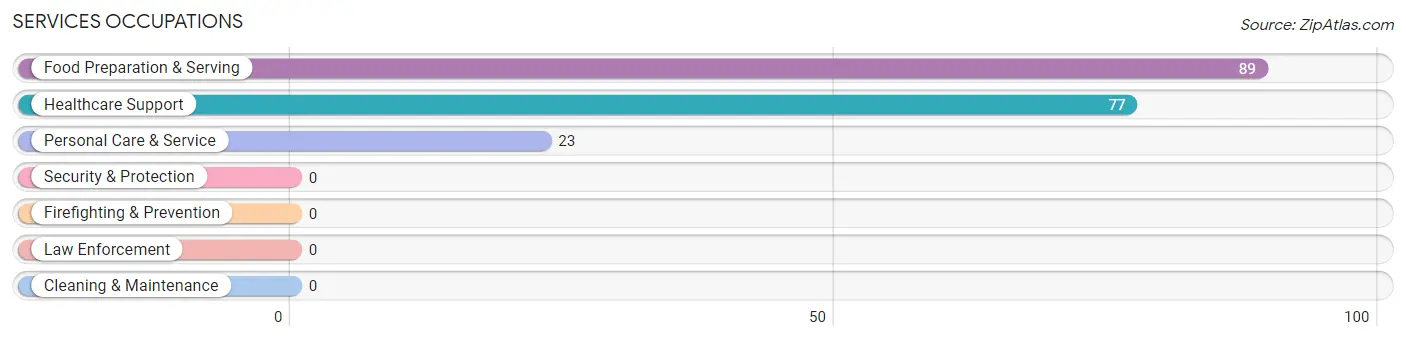
Services Occupations
The most common Services occupations in Fort Riley are Food Preparation & Serving (89 | 11.7%), Healthcare Support (77 | 10.2%), and Personal Care & Service (23 | 3.0%).
Services Occupations by Sex
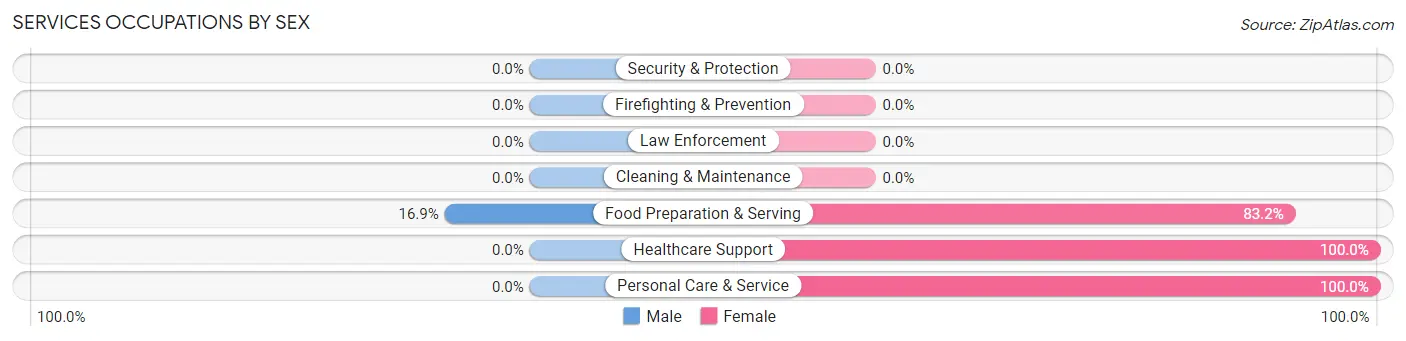
| Occupation | Male | Female |
| Healthcare Support | 0 (0.0%) | 77 (100.0%) |
| Security & Protection | 0 (0.0%) | 0 (0.0%) |
| Firefighting & Prevention | 0 (0.0%) | 0 (0.0%) |
| Law Enforcement | 0 (0.0%) | 0 (0.0%) |
| Food Preparation & Serving | 15 (16.9%) | 74 (83.2%) |
| Cleaning & Maintenance | 0 (0.0%) | 0 (0.0%) |
| Personal Care & Service | 0 (0.0%) | 23 (100.0%) |
| Total (Category) | 15 (7.9%) | 174 (92.1%) |
| Total (Overall) | 98 (12.9%) | 660 (87.1%) |
Sales and Office Occupations
The most common Sales and Office occupations in Fort Riley are Office & Administration (190 | 25.1%), and Sales & Related (29 | 3.8%).
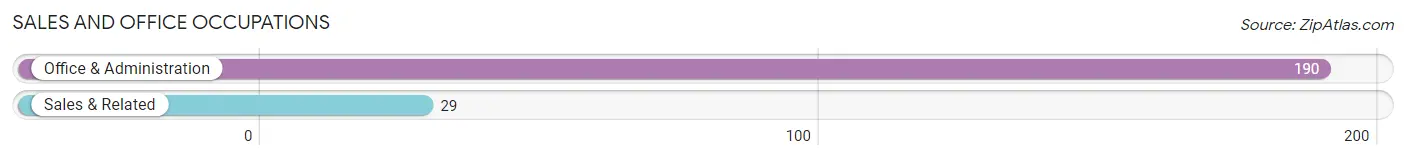
Sales and Office Occupations by Sex
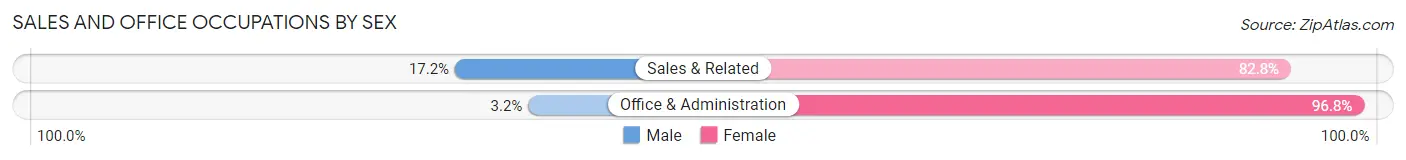
| Occupation | Male | Female |
| Sales & Related | 5 (17.2%) | 24 (82.8%) |
| Office & Administration | 6 (3.2%) | 184 (96.8%) |
| Total (Category) | 11 (5.0%) | 208 (95.0%) |
| Total (Overall) | 98 (12.9%) | 660 (87.1%) |
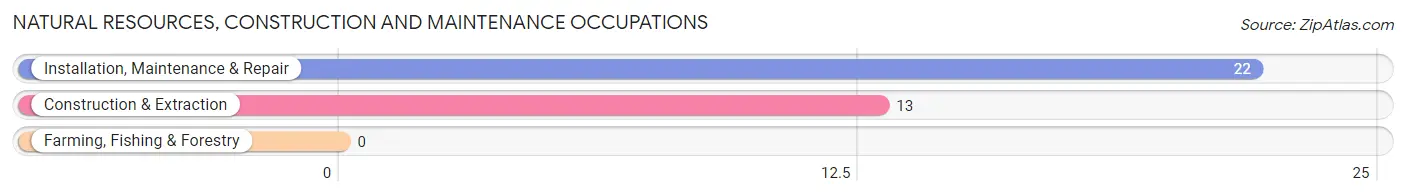
Natural Resources, Construction and Maintenance Occupations
The most common Natural Resources, Construction and Maintenance occupations in Fort Riley are Installation, Maintenance & Repair (22 | 2.9%), and Construction & Extraction (13 | 1.7%).
Natural Resources, Construction and Maintenance Occupations by Sex
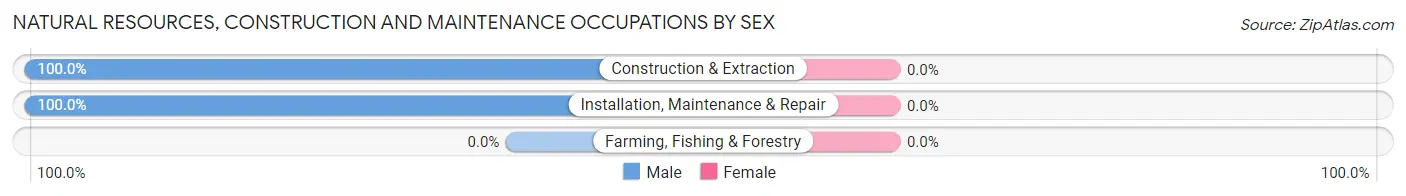
| Occupation | Male | Female |
| Farming, Fishing & Forestry | 0 (0.0%) | 0 (0.0%) |
| Construction & Extraction | 13 (100.0%) | 0 (0.0%) |
| Installation, Maintenance & Repair | 22 (100.0%) | 0 (0.0%) |
| Total (Category) | 35 (100.0%) | 0 (0.0%) |
| Total (Overall) | 98 (12.9%) | 660 (87.1%) |
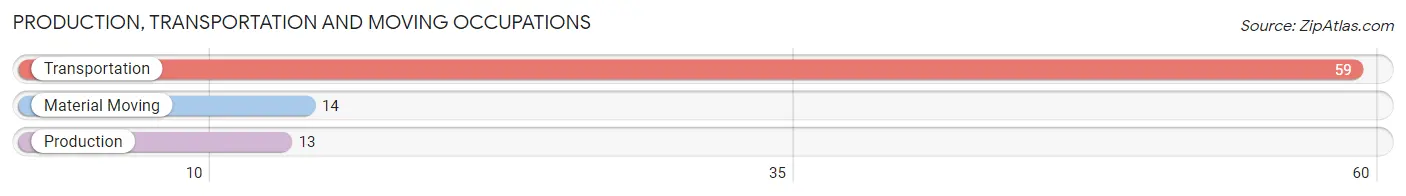
Production, Transportation and Moving Occupations
The most common Production, Transportation and Moving occupations in Fort Riley are Transportation (59 | 7.8%), Material Moving (14 | 1.8%), and Production (13 | 1.7%).
Production, Transportation and Moving Occupations by Sex
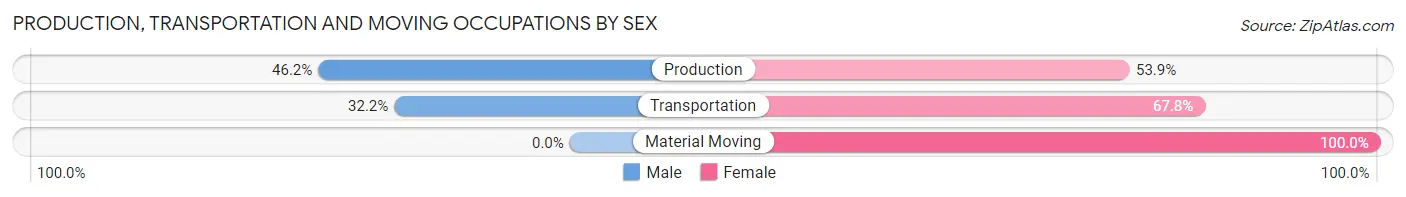
| Occupation | Male | Female |
| Production | 6 (46.2%) | 7 (53.8%) |
| Transportation | 19 (32.2%) | 40 (67.8%) |
| Material Moving | 0 (0.0%) | 14 (100.0%) |
| Total (Category) | 25 (29.1%) | 61 (70.9%) |
| Total (Overall) | 98 (12.9%) | 660 (87.1%) |
Employment Industries by Sex in Fort Riley
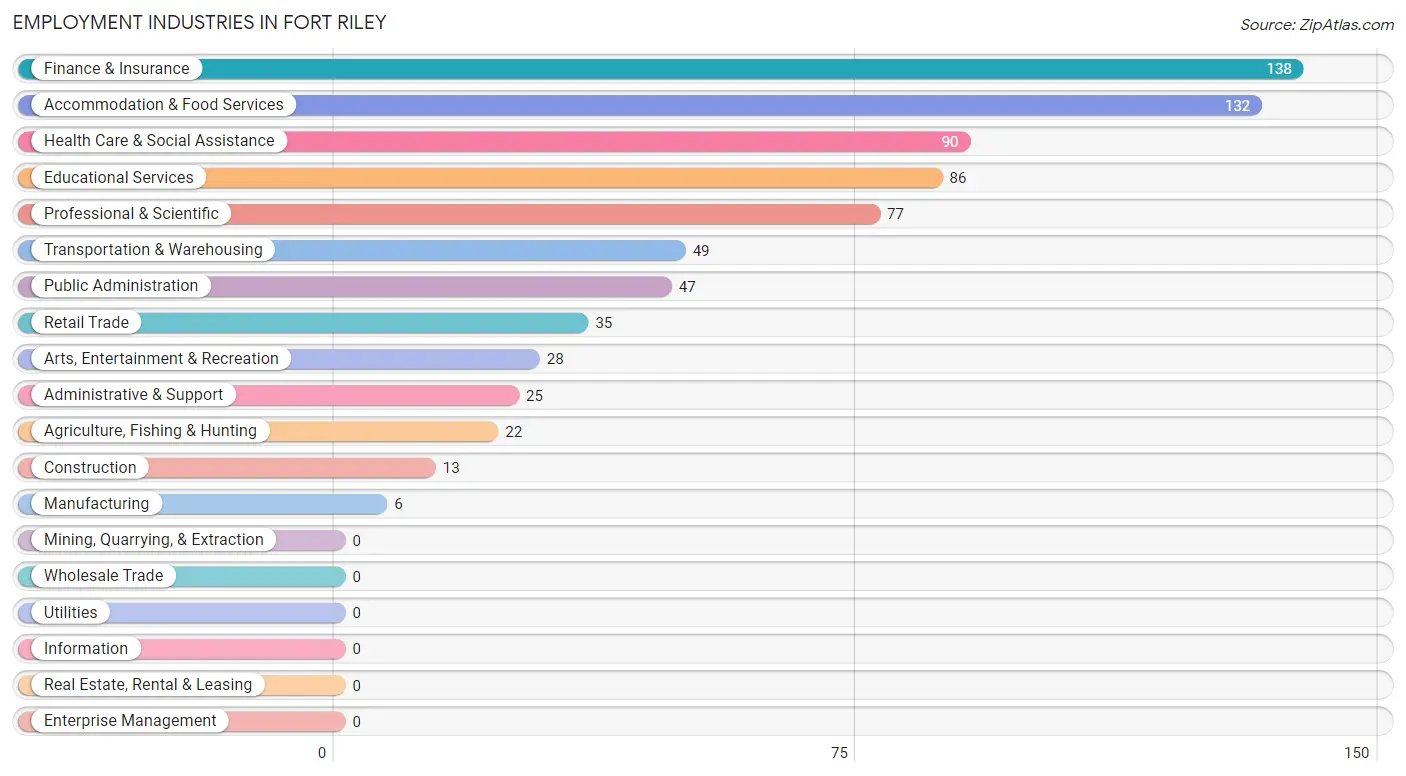
Employment Industries in Fort Riley
The major employment industries in Fort Riley include Finance & Insurance (138 | 18.2%), Accommodation & Food Services (132 | 17.4%), Health Care & Social Assistance (90 | 11.9%), Educational Services (86 | 11.4%), and Professional & Scientific (77 | 10.2%).
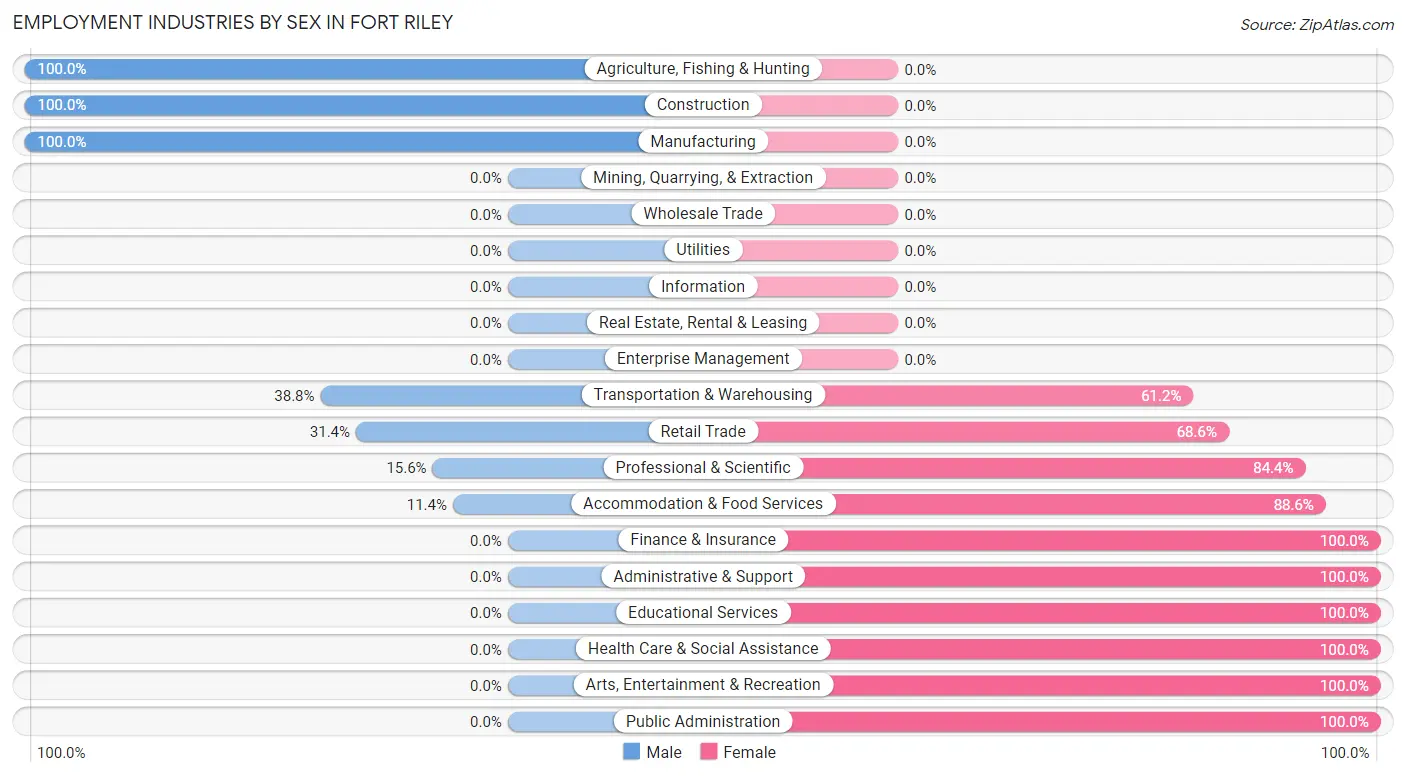
Employment Industries by Sex in Fort Riley
The Fort Riley industries that see more men than women are Agriculture, Fishing & Hunting (100.0%), Construction (100.0%), and Manufacturing (100.0%), whereas the industries that tend to have a higher number of women are Finance & Insurance (100.0%), Administrative & Support (100.0%), and Educational Services (100.0%).
| Industry | Male | Female |
| Agriculture, Fishing & Hunting | 22 (100.0%) | 0 (0.0%) |
| Mining, Quarrying, & Extraction | 0 (0.0%) | 0 (0.0%) |
| Construction | 13 (100.0%) | 0 (0.0%) |
| Manufacturing | 6 (100.0%) | 0 (0.0%) |
| Wholesale Trade | 0 (0.0%) | 0 (0.0%) |
| Retail Trade | 11 (31.4%) | 24 (68.6%) |
| Transportation & Warehousing | 19 (38.8%) | 30 (61.2%) |
| Utilities | 0 (0.0%) | 0 (0.0%) |
| Information | 0 (0.0%) | 0 (0.0%) |
| Finance & Insurance | 0 (0.0%) | 138 (100.0%) |
| Real Estate, Rental & Leasing | 0 (0.0%) | 0 (0.0%) |
| Professional & Scientific | 12 (15.6%) | 65 (84.4%) |
| Enterprise Management | 0 (0.0%) | 0 (0.0%) |
| Administrative & Support | 0 (0.0%) | 25 (100.0%) |
| Educational Services | 0 (0.0%) | 86 (100.0%) |
| Health Care & Social Assistance | 0 (0.0%) | 90 (100.0%) |
| Arts, Entertainment & Recreation | 0 (0.0%) | 28 (100.0%) |
| Accommodation & Food Services | 15 (11.4%) | 117 (88.6%) |
| Public Administration | 0 (0.0%) | 47 (100.0%) |
| Total | 98 (12.9%) | 660 (87.1%) |
Education in Fort Riley
School Enrollment in Fort Riley
The most common levels of schooling among the 1,352 students in Fort Riley are college / undergraduate (502 | 37.1%), nursery / preschool (231 | 17.1%), and elementary school (199 | 14.7%).
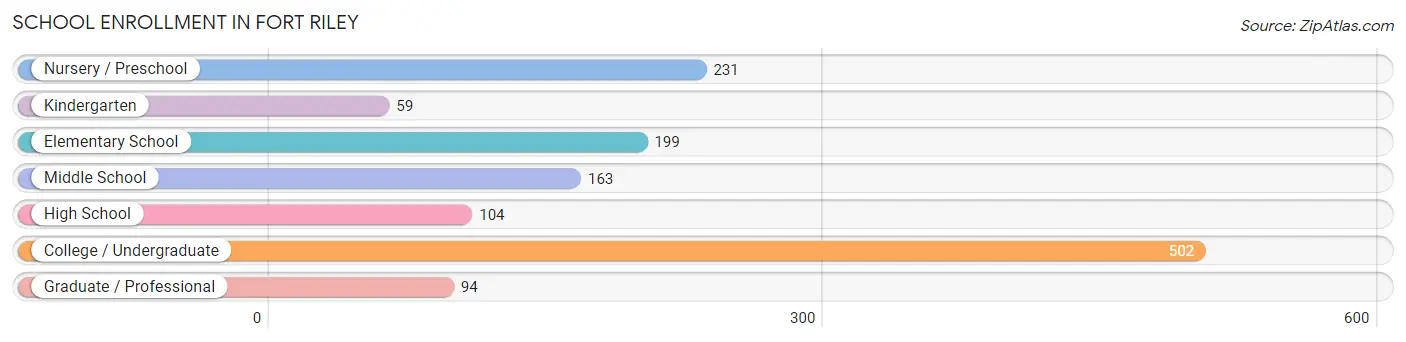
| School Level | # Students | % Students |
| Nursery / Preschool | 231 | 17.1% |
| Kindergarten | 59 | 4.4% |
| Elementary School | 199 | 14.7% |
| Middle School | 163 | 12.1% |
| High School | 104 | 7.7% |
| College / Undergraduate | 502 | 37.1% |
| Graduate / Professional | 94 | 7.0% |
| Total | 1,352 | 100.0% |
School Enrollment by Age by Funding Source in Fort Riley
Out of a total of 1,352 students who are enrolled in schools in Fort Riley, 196 (14.5%) attend a private institution, while the remaining 1,156 (85.5%) are enrolled in public schools. The age group of 20 to 24 year olds has the highest likelihood of being enrolled in private schools, with 93 (33.5% in the age bracket) enrolled. Conversely, the age group of 10 to 14 year olds has the lowest likelihood of being enrolled in a private school, with 203 (100.0% in the age bracket) attending a public institution.
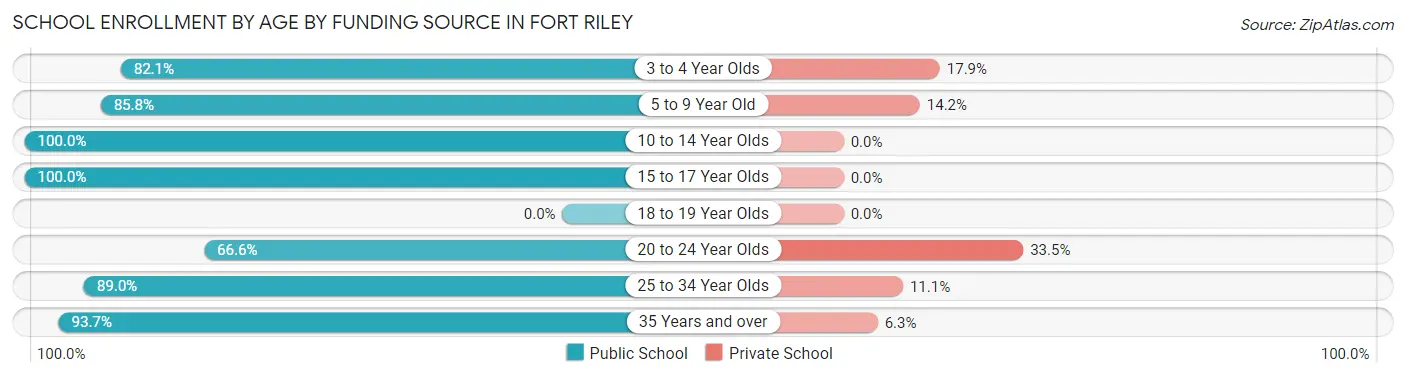
| Age Bracket | Public School | Private School |
| 3 to 4 Year Olds | 142 (82.1%) | 31 (17.9%) |
| 5 to 9 Year Old | 254 (85.8%) | 42 (14.2%) |
| 10 to 14 Year Olds | 203 (100.0%) | 0 (0.0%) |
| 15 to 17 Year Olds | 70 (100.0%) | 0 (0.0%) |
| 18 to 19 Year Olds | 0 (0.0%) | 0 (0.0%) |
| 20 to 24 Year Olds | 185 (66.5%) | 93 (33.5%) |
| 25 to 34 Year Olds | 169 (88.9%) | 21 (11.1%) |
| 35 Years and over | 133 (93.7%) | 9 (6.3%) |
| Total | 1,156 (85.5%) | 196 (14.5%) |
Educational Attainment by Field of Study in Fort Riley
Science & technology (121 | 24.3%), education (89 | 17.9%), liberal arts & history (85 | 17.1%), arts & humanities (53 | 10.6%), and social sciences (28 | 5.6%) are the most common fields of study among 498 individuals in Fort Riley who have obtained a bachelor's degree or higher.
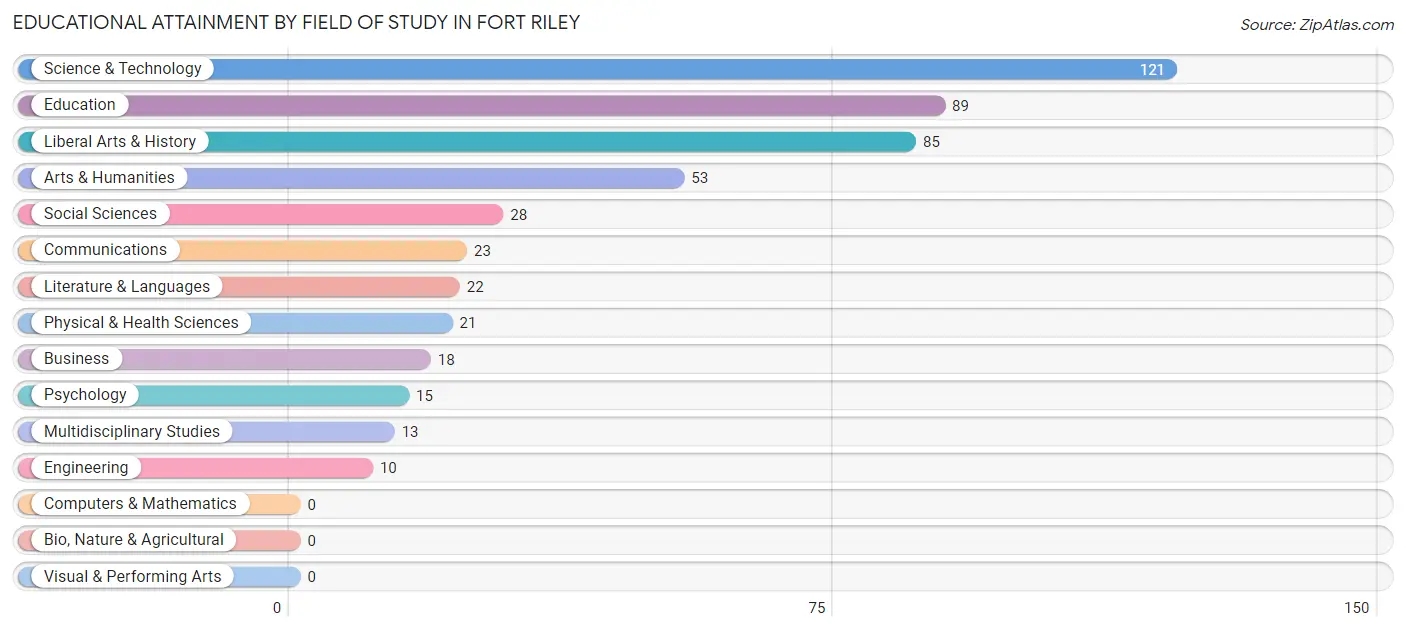
| Field of Study | # Graduates | % Graduates |
| Computers & Mathematics | 0 | 0.0% |
| Bio, Nature & Agricultural | 0 | 0.0% |
| Physical & Health Sciences | 21 | 4.2% |
| Psychology | 15 | 3.0% |
| Social Sciences | 28 | 5.6% |
| Engineering | 10 | 2.0% |
| Multidisciplinary Studies | 13 | 2.6% |
| Science & Technology | 121 | 24.3% |
| Business | 18 | 3.6% |
| Education | 89 | 17.9% |
| Literature & Languages | 22 | 4.4% |
| Liberal Arts & History | 85 | 17.1% |
| Visual & Performing Arts | 0 | 0.0% |
| Communications | 23 | 4.6% |
| Arts & Humanities | 53 | 10.6% |
| Total | 498 | 100.0% |
Transportation & Commute in Fort Riley
Vehicle Availability by Sex in Fort Riley
The most prevalent vehicle ownership categories in Fort Riley are males with 2 vehicles (843, accounting for 58.9%) and females with 2 vehicles (340, making up 127.2%).
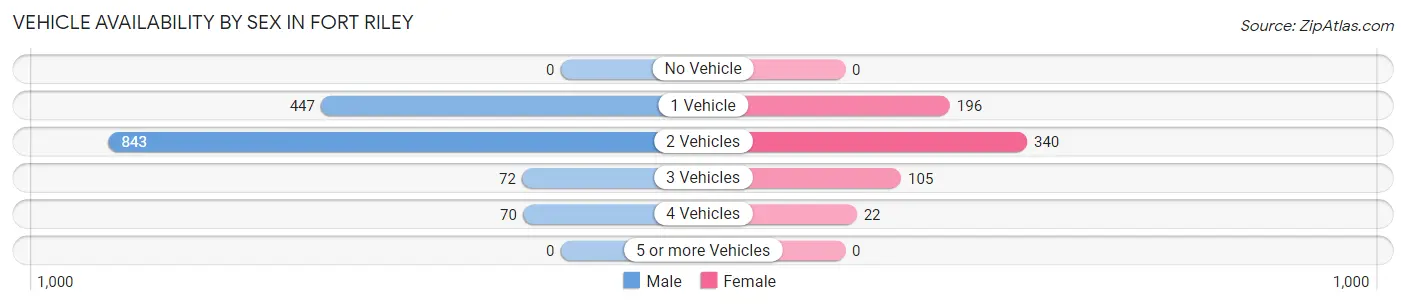
| Vehicles Available | Male | Female |
| No Vehicle | 0 (0.0%) | 0 (0.0%) |
| 1 Vehicle | 447 (31.2%) | 196 (29.6%) |
| 2 Vehicles | 843 (58.9%) | 340 (51.3%) |
| 3 Vehicles | 72 (5.0%) | 105 (15.8%) |
| 4 Vehicles | 70 (4.9%) | 22 (3.3%) |
| 5 or more Vehicles | 0 (0.0%) | 0 (0.0%) |
| Total | 1,432 (100.0%) | 663 (100.0%) |
Commute Time in Fort Riley
The most frequently occuring commute durations in Fort Riley are 5 to 9 minutes (3,589 commuters, 67.7%), 10 to 14 minutes (734 commuters, 13.8%), and 15 to 19 minutes (564 commuters, 10.6%).
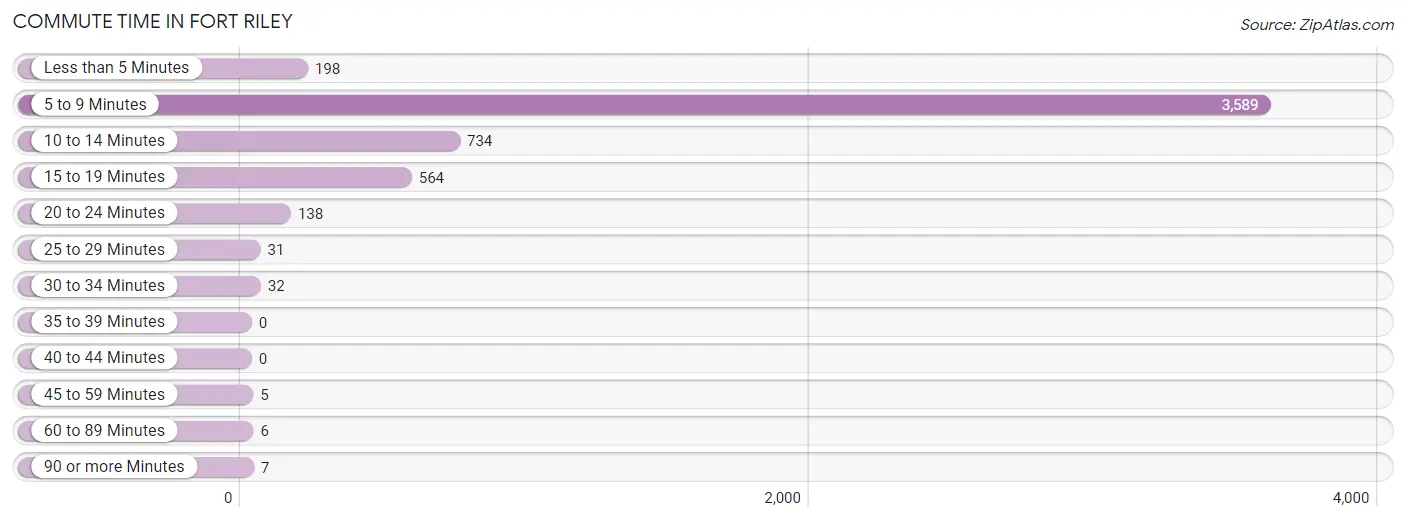
| Commute Time | # Commuters | % Commuters |
| Less than 5 Minutes | 198 | 3.7% |
| 5 to 9 Minutes | 3,589 | 67.7% |
| 10 to 14 Minutes | 734 | 13.8% |
| 15 to 19 Minutes | 564 | 10.6% |
| 20 to 24 Minutes | 138 | 2.6% |
| 25 to 29 Minutes | 31 | 0.6% |
| 30 to 34 Minutes | 32 | 0.6% |
| 35 to 39 Minutes | 0 | 0.0% |
| 40 to 44 Minutes | 0 | 0.0% |
| 45 to 59 Minutes | 5 | 0.1% |
| 60 to 89 Minutes | 6 | 0.1% |
| 90 or more Minutes | 7 | 0.1% |
Commute Time by Sex in Fort Riley
The most common commute times in Fort Riley are 5 to 9 minutes (3,256 commuters, 73.2%) for males and 5 to 9 minutes (333 commuters, 39.0%) for females.
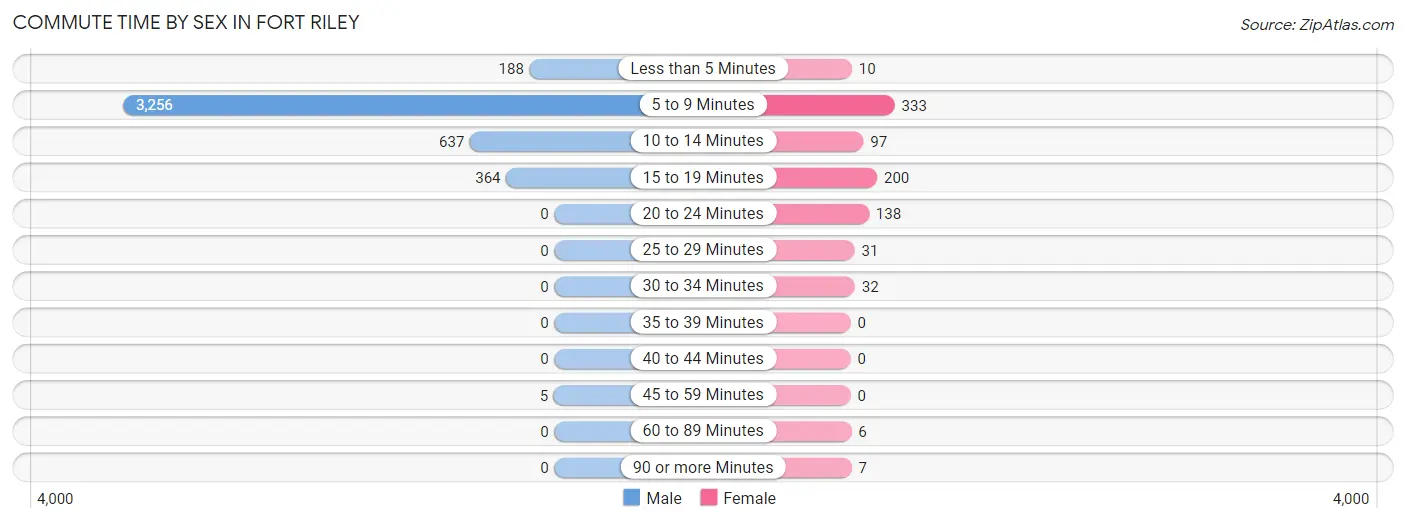
| Commute Time | Male | Female |
| Less than 5 Minutes | 188 (4.2%) | 10 (1.2%) |
| 5 to 9 Minutes | 3,256 (73.2%) | 333 (39.0%) |
| 10 to 14 Minutes | 637 (14.3%) | 97 (11.4%) |
| 15 to 19 Minutes | 364 (8.2%) | 200 (23.4%) |
| 20 to 24 Minutes | 0 (0.0%) | 138 (16.2%) |
| 25 to 29 Minutes | 0 (0.0%) | 31 (3.6%) |
| 30 to 34 Minutes | 0 (0.0%) | 32 (3.7%) |
| 35 to 39 Minutes | 0 (0.0%) | 0 (0.0%) |
| 40 to 44 Minutes | 0 (0.0%) | 0 (0.0%) |
| 45 to 59 Minutes | 5 (0.1%) | 0 (0.0%) |
| 60 to 89 Minutes | 0 (0.0%) | 6 (0.7%) |
| 90 or more Minutes | 0 (0.0%) | 7 (0.8%) |
Time of Departure to Work by Sex in Fort Riley
The most frequent times of departure to work in Fort Riley are 5:30 AM to 5:59 AM (2,980, 67.0%) for males and 5:30 AM to 5:59 AM (257, 30.1%) for females.
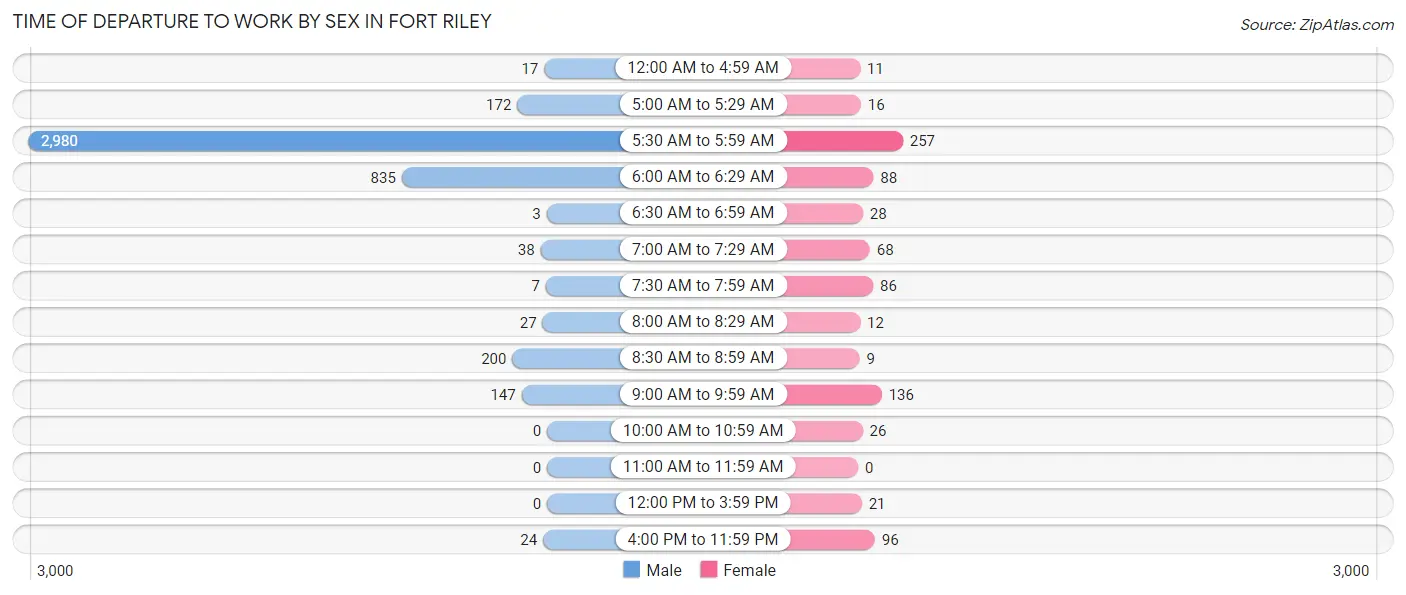
| Time of Departure | Male | Female |
| 12:00 AM to 4:59 AM | 17 (0.4%) | 11 (1.3%) |
| 5:00 AM to 5:29 AM | 172 (3.9%) | 16 (1.9%) |
| 5:30 AM to 5:59 AM | 2,980 (67.0%) | 257 (30.1%) |
| 6:00 AM to 6:29 AM | 835 (18.8%) | 88 (10.3%) |
| 6:30 AM to 6:59 AM | 3 (0.1%) | 28 (3.3%) |
| 7:00 AM to 7:29 AM | 38 (0.9%) | 68 (8.0%) |
| 7:30 AM to 7:59 AM | 7 (0.2%) | 86 (10.1%) |
| 8:00 AM to 8:29 AM | 27 (0.6%) | 12 (1.4%) |
| 8:30 AM to 8:59 AM | 200 (4.5%) | 9 (1.1%) |
| 9:00 AM to 9:59 AM | 147 (3.3%) | 136 (15.9%) |
| 10:00 AM to 10:59 AM | 0 (0.0%) | 26 (3.0%) |
| 11:00 AM to 11:59 AM | 0 (0.0%) | 0 (0.0%) |
| 12:00 PM to 3:59 PM | 0 (0.0%) | 21 (2.5%) |
| 4:00 PM to 11:59 PM | 24 (0.5%) | 96 (11.2%) |
| Total | 4,450 (100.0%) | 854 (100.0%) |
Housing Occupancy in Fort Riley
Occupancy by Ownership in Fort Riley
Of the total 1,654 dwellings in Fort Riley, owner-occupied units account for 31 (1.9%), while renter-occupied units make up 1,623 (98.1%).
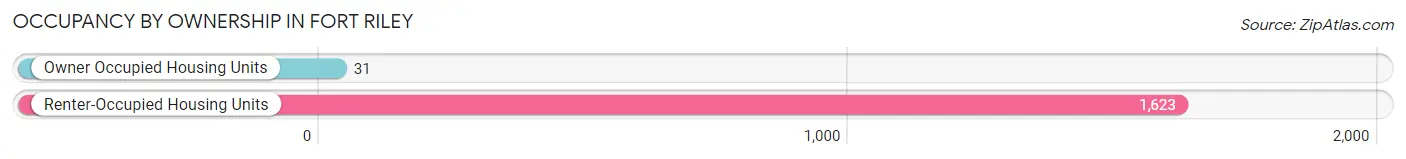
| Occupancy | # Housing Units | % Housing Units |
| Owner Occupied Housing Units | 31 | 1.9% |
| Renter-Occupied Housing Units | 1,623 | 98.1% |
| Total Occupied Housing Units | 1,654 | 100.0% |
Occupancy by Household Size in Fort Riley
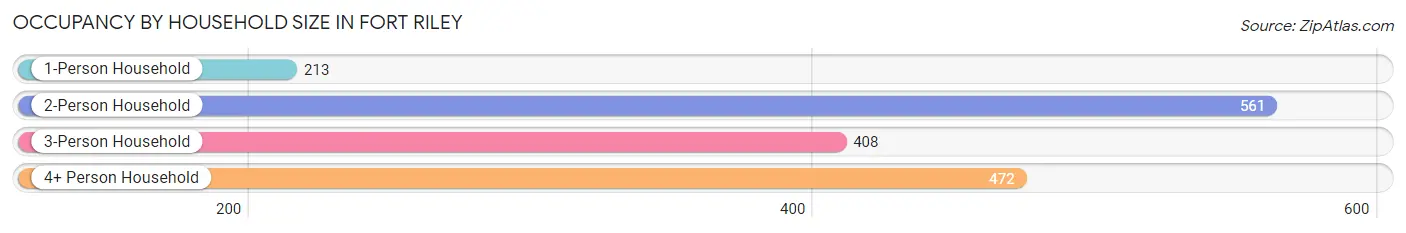
| Household Size | # Housing Units | % Housing Units |
| 1-Person Household | 213 | 12.9% |
| 2-Person Household | 561 | 33.9% |
| 3-Person Household | 408 | 24.7% |
| 4+ Person Household | 472 | 28.5% |
| Total Housing Units | 1,654 | 100.0% |
Occupancy by Ownership by Household Size in Fort Riley
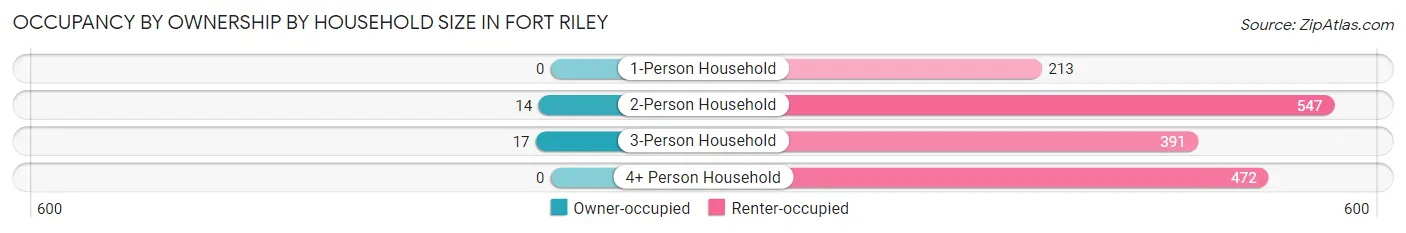
| Household Size | Owner-occupied | Renter-occupied |
| 1-Person Household | 0 (0.0%) | 213 (100.0%) |
| 2-Person Household | 14 (2.5%) | 547 (97.5%) |
| 3-Person Household | 17 (4.2%) | 391 (95.8%) |
| 4+ Person Household | 0 (0.0%) | 472 (100.0%) |
| Total Housing Units | 31 (1.9%) | 1,623 (98.1%) |
Occupancy by Educational Attainment in Fort Riley
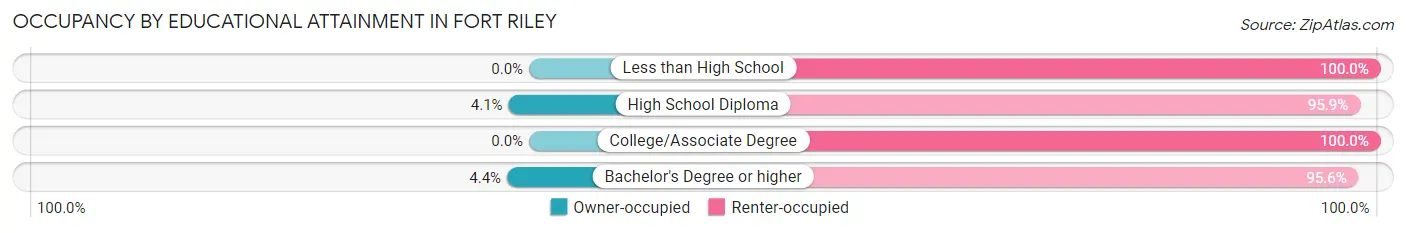
| Household Size | Owner-occupied | Renter-occupied |
| Less than High School | 0 (0.0%) | 19 (100.0%) |
| High School Diploma | 22 (4.1%) | 519 (95.9%) |
| College/Associate Degree | 0 (0.0%) | 888 (100.0%) |
| Bachelor's Degree or higher | 9 (4.4%) | 197 (95.6%) |
Occupancy by Age of Householder in Fort Riley
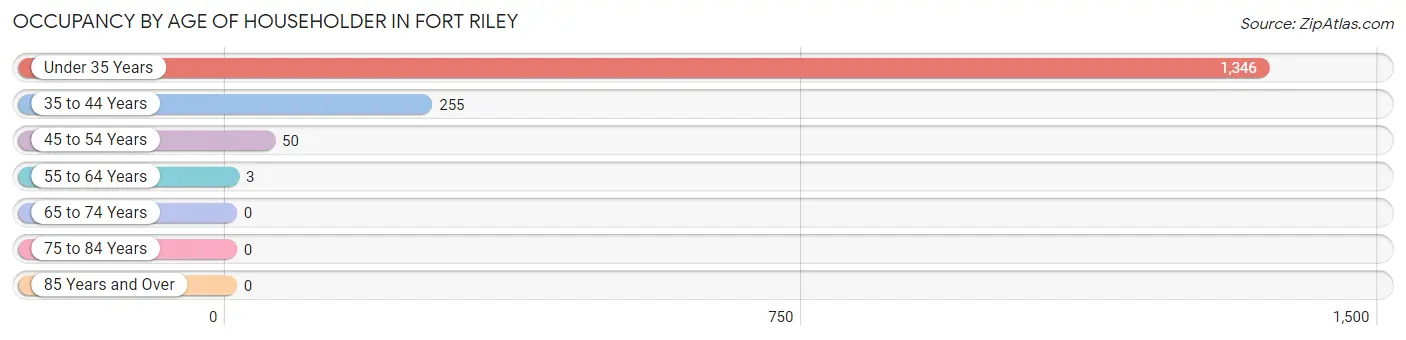
| Age Bracket | # Households | % Households |
| Under 35 Years | 1,346 | 81.4% |
| 35 to 44 Years | 255 | 15.4% |
| 45 to 54 Years | 50 | 3.0% |
| 55 to 64 Years | 3 | 0.2% |
| 65 to 74 Years | 0 | 0.0% |
| 75 to 84 Years | 0 | 0.0% |
| 85 Years and Over | 0 | 0.0% |
| Total | 1,654 | 100.0% |
Housing Finances in Fort Riley
Median Income by Occupancy in Fort Riley
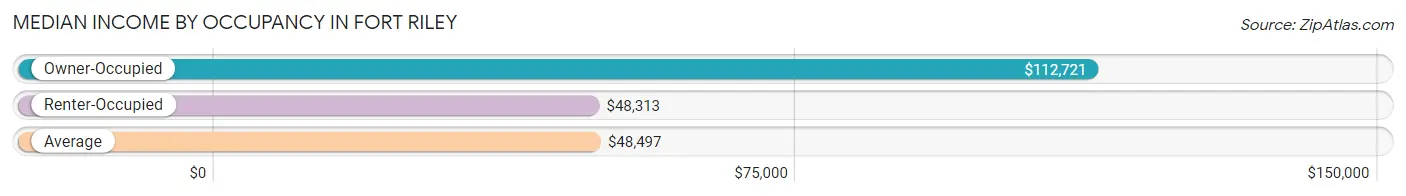
| Occupancy Type | # Households | Median Income |
| Owner-Occupied | 31 (1.9%) | $112,721 |
| Renter-Occupied | 1,623 (98.1%) | $48,313 |
| Average | 1,654 (100.0%) | $48,497 |
Occupancy by Householder Income Bracket in Fort Riley
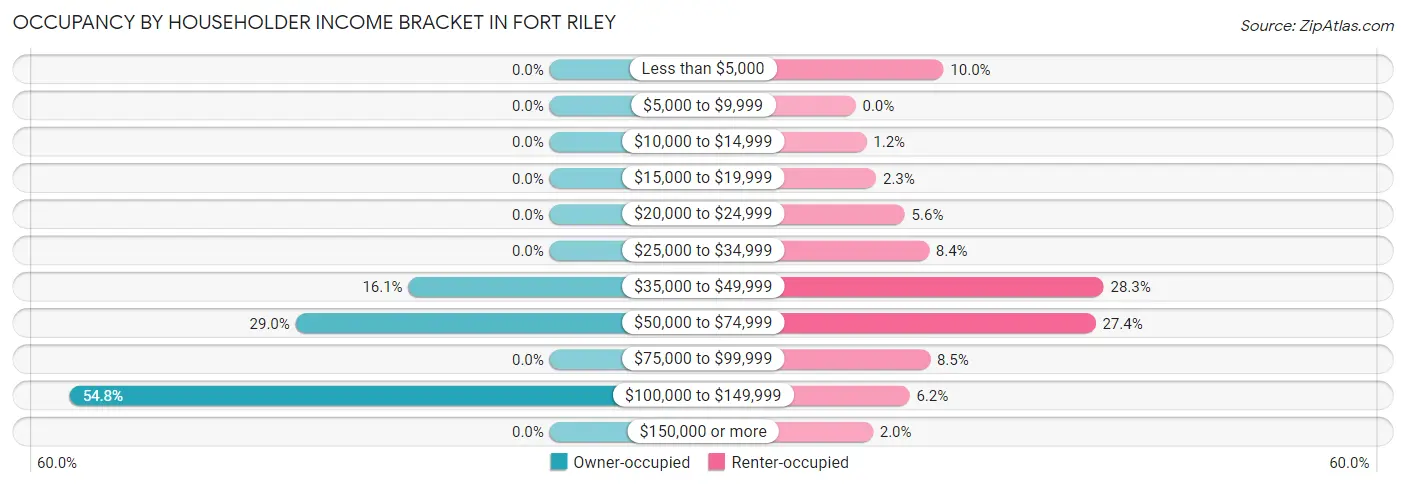
| Income Bracket | Owner-occupied | Renter-occupied |
| Less than $5,000 | 0 (0.0%) | 163 (10.0%) |
| $5,000 to $9,999 | 0 (0.0%) | 0 (0.0%) |
| $10,000 to $14,999 | 0 (0.0%) | 20 (1.2%) |
| $15,000 to $19,999 | 0 (0.0%) | 38 (2.3%) |
| $20,000 to $24,999 | 0 (0.0%) | 91 (5.6%) |
| $25,000 to $34,999 | 0 (0.0%) | 136 (8.4%) |
| $35,000 to $49,999 | 5 (16.1%) | 460 (28.3%) |
| $50,000 to $74,999 | 9 (29.0%) | 445 (27.4%) |
| $75,000 to $99,999 | 0 (0.0%) | 138 (8.5%) |
| $100,000 to $149,999 | 17 (54.8%) | 100 (6.2%) |
| $150,000 or more | 0 (0.0%) | 32 (2.0%) |
| Total | 31 (100.0%) | 1,623 (100.0%) |
Monthly Housing Cost Tiers in Fort Riley
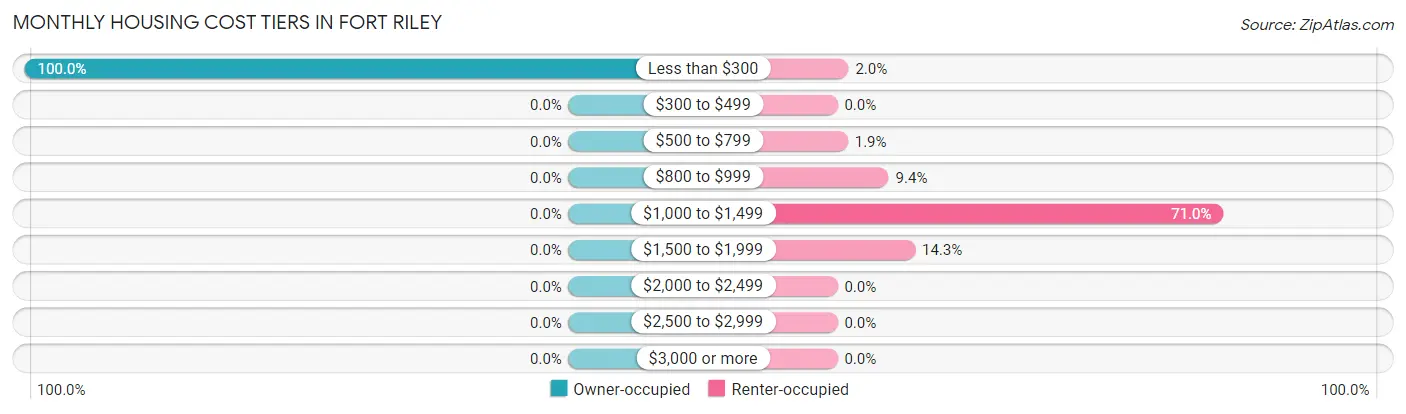
| Monthly Cost | Owner-occupied | Renter-occupied |
| Less than $300 | 31 (100.0%) | 33 (2.0%) |
| $300 to $499 | 0 (0.0%) | 0 (0.0%) |
| $500 to $799 | 0 (0.0%) | 31 (1.9%) |
| $800 to $999 | 0 (0.0%) | 153 (9.4%) |
| $1,000 to $1,499 | 0 (0.0%) | 1,153 (71.0%) |
| $1,500 to $1,999 | 0 (0.0%) | 232 (14.3%) |
| $2,000 to $2,499 | 0 (0.0%) | 0 (0.0%) |
| $2,500 to $2,999 | 0 (0.0%) | 0 (0.0%) |
| $3,000 or more | 0 (0.0%) | 0 (0.0%) |
| Total | 31 (100.0%) | 1,623 (100.0%) |
Physical Housing Characteristics in Fort Riley
Housing Structures in Fort Riley
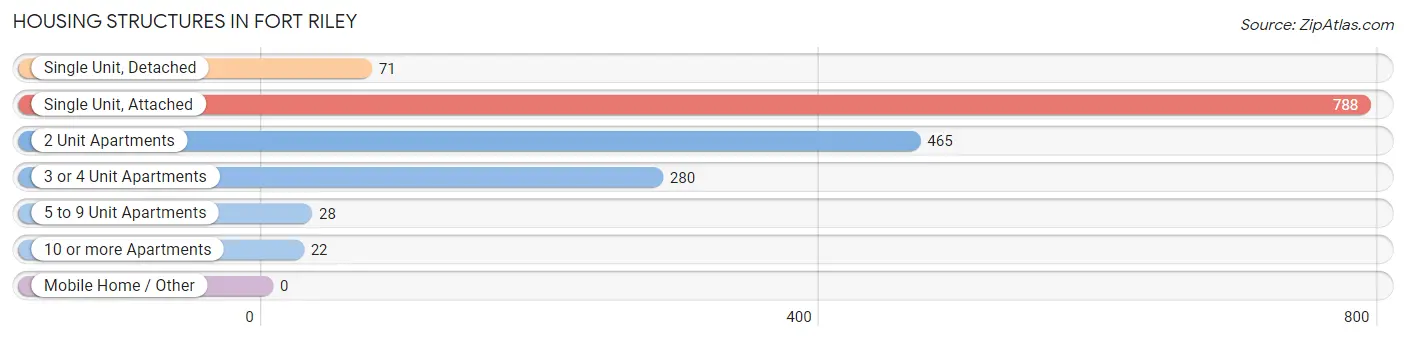
| Structure Type | # Housing Units | % Housing Units |
| Single Unit, Detached | 71 | 4.3% |
| Single Unit, Attached | 788 | 47.6% |
| 2 Unit Apartments | 465 | 28.1% |
| 3 or 4 Unit Apartments | 280 | 16.9% |
| 5 to 9 Unit Apartments | 28 | 1.7% |
| 10 or more Apartments | 22 | 1.3% |
| Mobile Home / Other | 0 | 0.0% |
| Total | 1,654 | 100.0% |
Housing Structures by Occupancy in Fort Riley
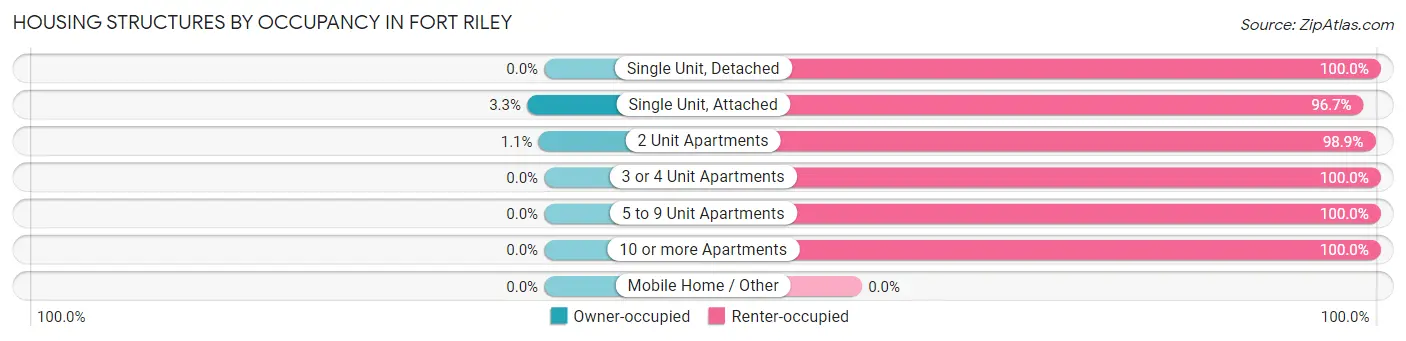
| Structure Type | Owner-occupied | Renter-occupied |
| Single Unit, Detached | 0 (0.0%) | 71 (100.0%) |
| Single Unit, Attached | 26 (3.3%) | 762 (96.7%) |
| 2 Unit Apartments | 5 (1.1%) | 460 (98.9%) |
| 3 or 4 Unit Apartments | 0 (0.0%) | 280 (100.0%) |
| 5 to 9 Unit Apartments | 0 (0.0%) | 28 (100.0%) |
| 10 or more Apartments | 0 (0.0%) | 22 (100.0%) |
| Mobile Home / Other | 0 (0.0%) | 0 (0.0%) |
| Total | 31 (1.9%) | 1,623 (98.1%) |
Housing Structures by Number of Rooms in Fort Riley
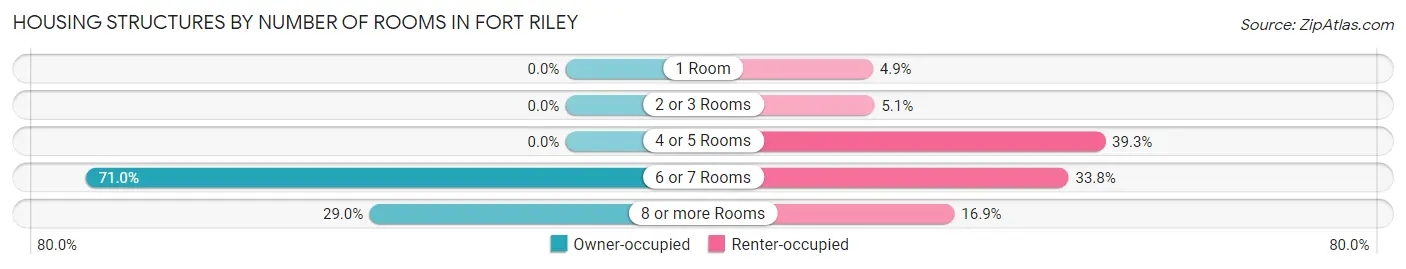
| Number of Rooms | Owner-occupied | Renter-occupied |
| 1 Room | 0 (0.0%) | 79 (4.9%) |
| 2 or 3 Rooms | 0 (0.0%) | 83 (5.1%) |
| 4 or 5 Rooms | 0 (0.0%) | 637 (39.3%) |
| 6 or 7 Rooms | 22 (71.0%) | 549 (33.8%) |
| 8 or more Rooms | 9 (29.0%) | 275 (16.9%) |
| Total | 31 (100.0%) | 1,623 (100.0%) |
Housing Structure by Heating Type in Fort Riley
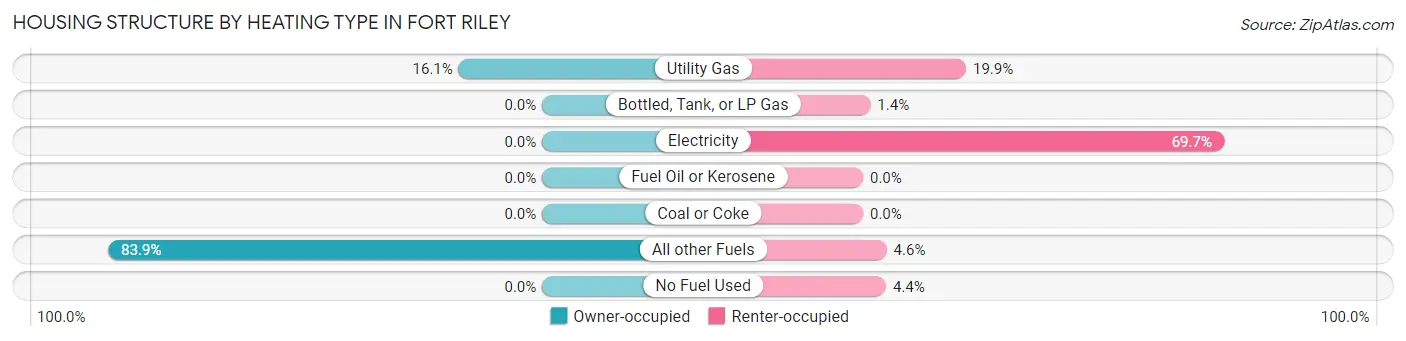
| Heating Type | Owner-occupied | Renter-occupied |
| Utility Gas | 5 (16.1%) | 323 (19.9%) |
| Bottled, Tank, or LP Gas | 0 (0.0%) | 23 (1.4%) |
| Electricity | 0 (0.0%) | 1,131 (69.7%) |
| Fuel Oil or Kerosene | 0 (0.0%) | 0 (0.0%) |
| Coal or Coke | 0 (0.0%) | 0 (0.0%) |
| All other Fuels | 26 (83.9%) | 74 (4.6%) |
| No Fuel Used | 0 (0.0%) | 72 (4.4%) |
| Total | 31 (100.0%) | 1,623 (100.0%) |
Household Vehicle Usage in Fort Riley
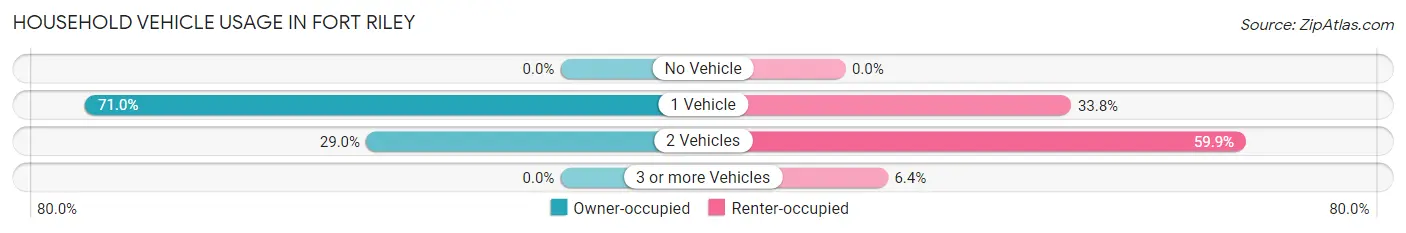
| Vehicles per Household | Owner-occupied | Renter-occupied |
| No Vehicle | 0 (0.0%) | 0 (0.0%) |
| 1 Vehicle | 22 (71.0%) | 548 (33.8%) |
| 2 Vehicles | 9 (29.0%) | 972 (59.9%) |
| 3 or more Vehicles | 0 (0.0%) | 103 (6.4%) |
| Total | 31 (100.0%) | 1,623 (100.0%) |
Real Estate & Mortgages in Fort Riley
Real Estate and Mortgage Overview in Fort Riley
| Characteristic | Without Mortgage | With Mortgage |
| Housing Units | 31 | 0 |
| Median Property Value | $220,200 | $0 |
| Median Household Income | $112,721 | $0 |
| Monthly Housing Costs | - | - |
| Real Estate Taxes | - | - |
Property Value by Mortgage Status in Fort Riley
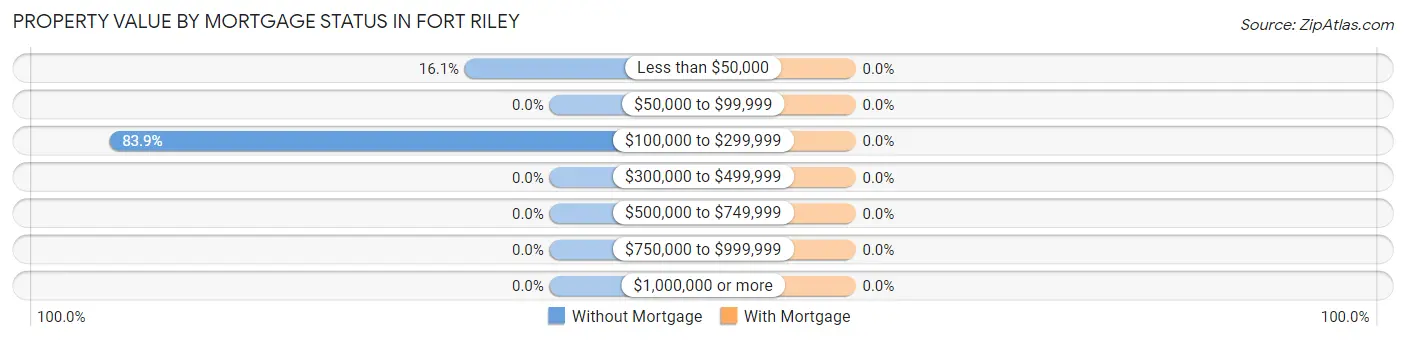
| Property Value | Without Mortgage | With Mortgage |
| Less than $50,000 | 5 (16.1%) | 0 (0.0%) |
| $50,000 to $99,999 | 0 (0.0%) | 0 (0.0%) |
| $100,000 to $299,999 | 26 (83.9%) | 0 (0.0%) |
| $300,000 to $499,999 | 0 (0.0%) | 0 (0.0%) |
| $500,000 to $749,999 | 0 (0.0%) | 0 (0.0%) |
| $750,000 to $999,999 | 0 (0.0%) | 0 (0.0%) |
| $1,000,000 or more | 0 (0.0%) | 0 (0.0%) |
| Total | 31 (100.0%) | 0 (0.0%) |
Household Income by Mortgage Status in Fort Riley
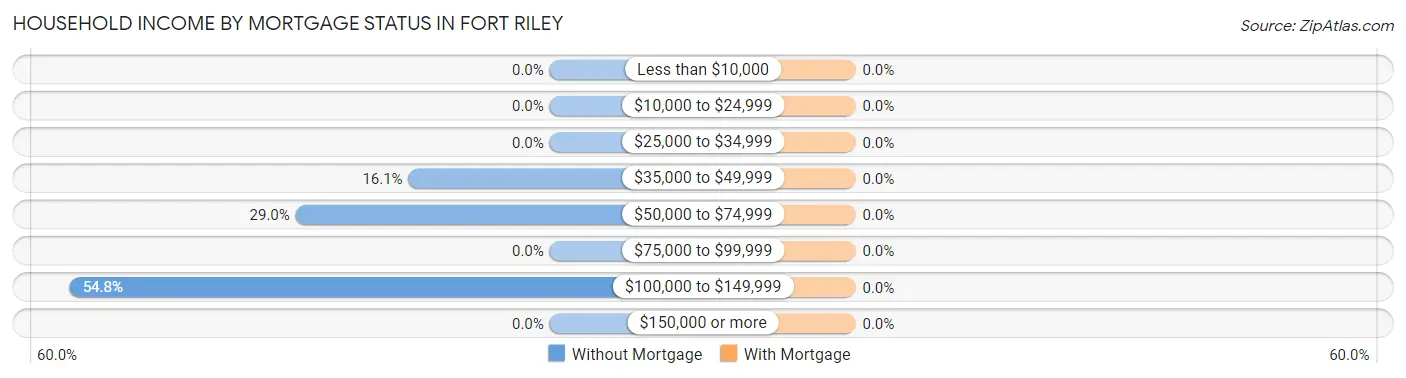
| Household Income | Without Mortgage | With Mortgage |
| Less than $10,000 | 0 (0.0%) | 0 (0.0%) |
| $10,000 to $24,999 | 0 (0.0%) | 0 (0.0%) |
| $25,000 to $34,999 | 0 (0.0%) | 0 (0.0%) |
| $35,000 to $49,999 | 5 (16.1%) | 0 (0.0%) |
| $50,000 to $74,999 | 9 (29.0%) | 0 (0.0%) |
| $75,000 to $99,999 | 0 (0.0%) | 0 (0.0%) |
| $100,000 to $149,999 | 17 (54.8%) | 0 (0.0%) |
| $150,000 or more | 0 (0.0%) | 0 (0.0%) |
| Total | 31 (100.0%) | 0 (0.0%) |
Property Value to Household Income Ratio in Fort Riley
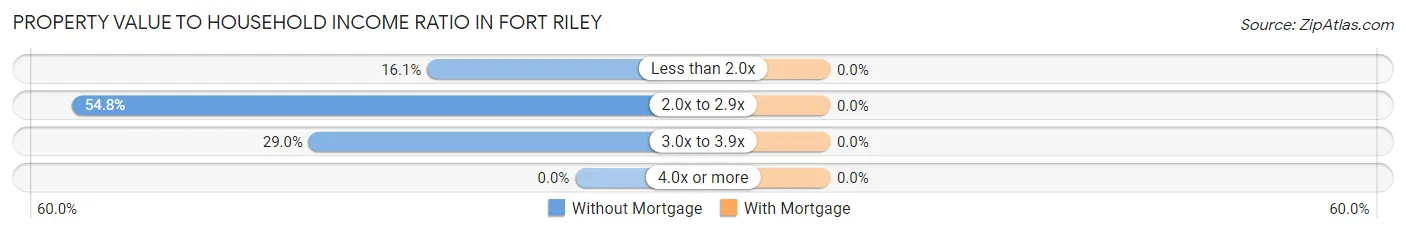
| Value-to-Income Ratio | Without Mortgage | With Mortgage |
| Less than 2.0x | 5 (16.1%) | 0 (0.0%) |
| 2.0x to 2.9x | 17 (54.8%) | 0 (0.0%) |
| 3.0x to 3.9x | 9 (29.0%) | 0 (0.0%) |
| 4.0x or more | 0 (0.0%) | 0 (0.0%) |
| Total | 31 (100.0%) | 0 (0.0%) |
Real Estate Taxes by Mortgage Status in Fort Riley
| Property Taxes | Without Mortgage | With Mortgage |
| Less than $800 | 0 (0.0%) | 0 (0.0%) |
| $800 to $1,499 | 0 (0.0%) | 0 (0.0%) |
| $800 to $1,499 | 0 (0.0%) | 0 (0.0%) |
| Total | 31 (100.0%) | 0 (0.0%) |
Health & Disability in Fort Riley
Health Insurance Coverage by Age in Fort Riley
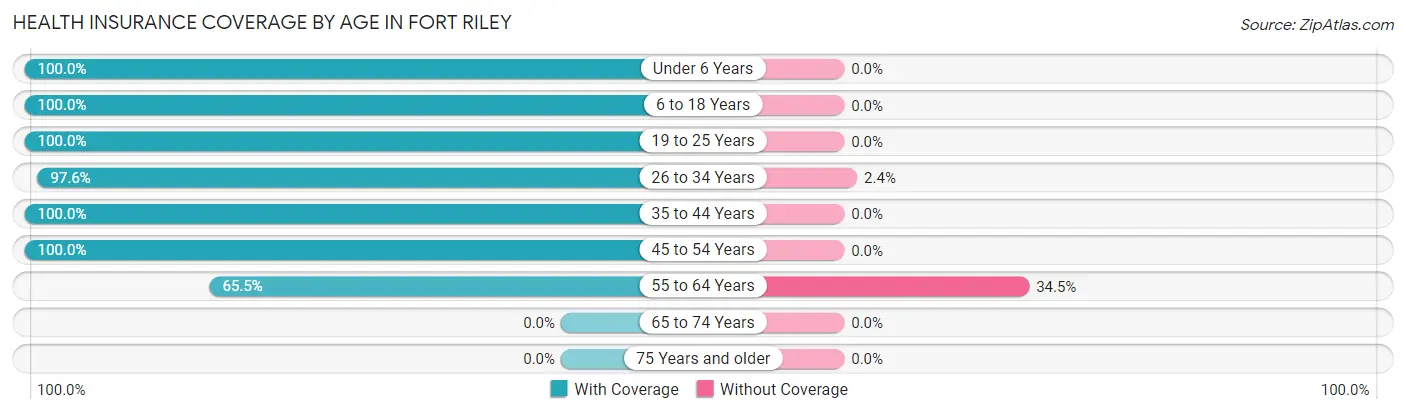
| Age Bracket | With Coverage | Without Coverage |
| Under 6 Years | 1,031 (100.0%) | 0 (0.0%) |
| 6 to 18 Years | 518 (100.0%) | 0 (0.0%) |
| 19 to 25 Years | 915 (100.0%) | 0 (0.0%) |
| 26 to 34 Years | 651 (97.6%) | 16 (2.4%) |
| 35 to 44 Years | 187 (100.0%) | 0 (0.0%) |
| 45 to 54 Years | 14 (100.0%) | 0 (0.0%) |
| 55 to 64 Years | 19 (65.5%) | 10 (34.5%) |
| 65 to 74 Years | 0 (0.0%) | 0 (0.0%) |
| 75 Years and older | 0 (0.0%) | 0 (0.0%) |
| Total | 3,335 (99.2%) | 26 (0.8%) |
Health Insurance Coverage by Citizenship Status in Fort Riley
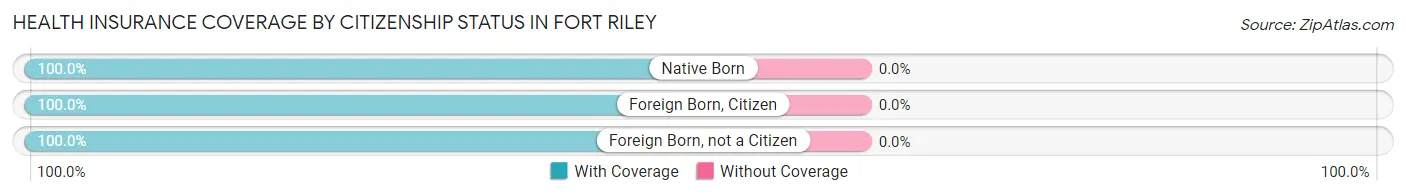
| Citizenship Status | With Coverage | Without Coverage |
| Native Born | 1,031 (100.0%) | 0 (0.0%) |
| Foreign Born, Citizen | 518 (100.0%) | 0 (0.0%) |
| Foreign Born, not a Citizen | 915 (100.0%) | 0 (0.0%) |
Health Insurance Coverage by Household Income in Fort Riley
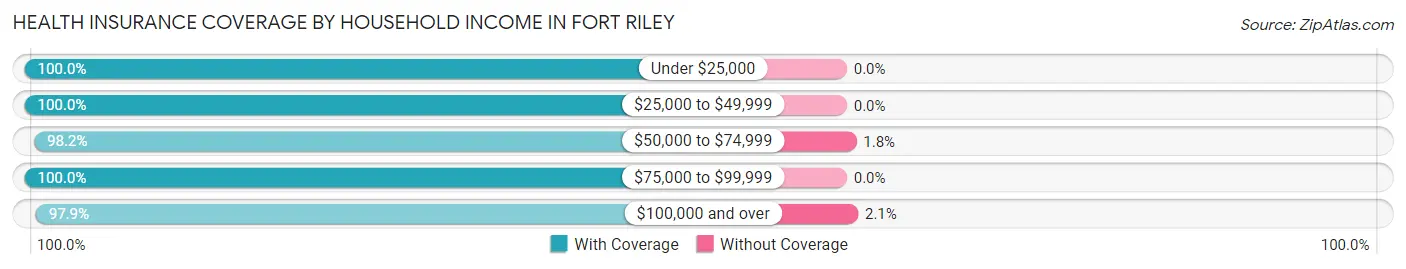
| Household Income | With Coverage | Without Coverage |
| Under $25,000 | 533 (100.0%) | 0 (0.0%) |
| $25,000 to $49,999 | 1,057 (100.0%) | 0 (0.0%) |
| $50,000 to $74,999 | 878 (98.2%) | 16 (1.8%) |
| $75,000 to $99,999 | 404 (100.0%) | 0 (0.0%) |
| $100,000 and over | 463 (97.9%) | 10 (2.1%) |
Public vs Private Health Insurance Coverage by Age in Fort Riley
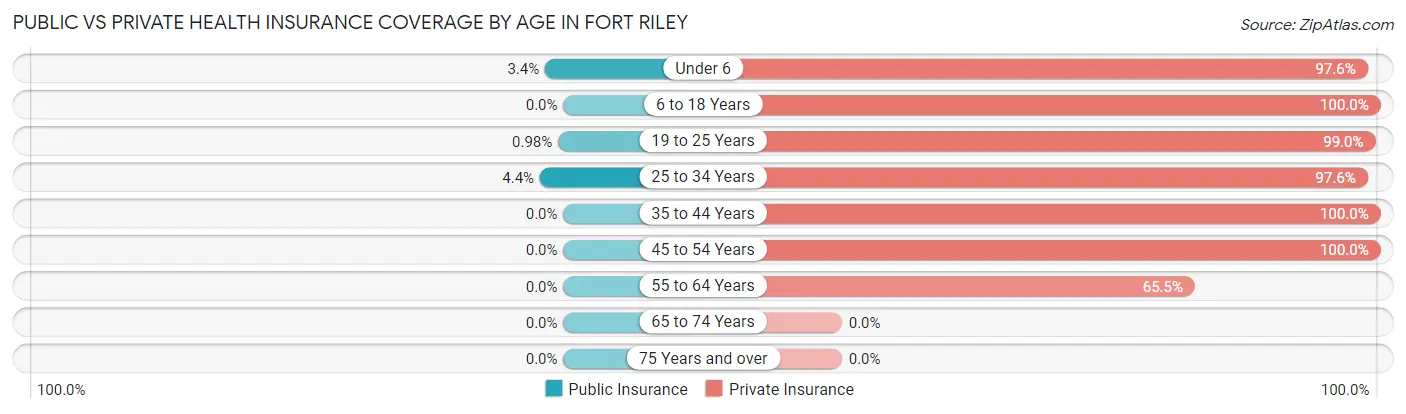
| Age Bracket | Public Insurance | Private Insurance |
| Under 6 | 35 (3.4%) | 1,006 (97.6%) |
| 6 to 18 Years | 0 (0.0%) | 518 (100.0%) |
| 19 to 25 Years | 9 (1.0%) | 906 (99.0%) |
| 25 to 34 Years | 29 (4.3%) | 651 (97.6%) |
| 35 to 44 Years | 0 (0.0%) | 187 (100.0%) |
| 45 to 54 Years | 0 (0.0%) | 14 (100.0%) |
| 55 to 64 Years | 0 (0.0%) | 19 (65.5%) |
| 65 to 74 Years | 0 (0.0%) | 0 (0.0%) |
| 75 Years and over | 0 (0.0%) | 0 (0.0%) |
| Total | 73 (2.2%) | 3,301 (98.2%) |
Disability Status by Sex by Age in Fort Riley
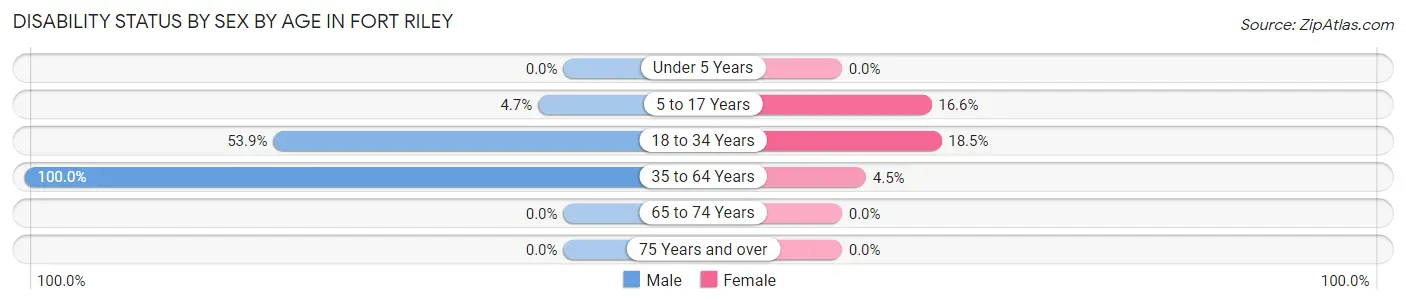
| Age Bracket | Male | Female |
| Under 5 Years | 0 (0.0%) | 0 (0.0%) |
| 5 to 17 Years | 13 (4.7%) | 50 (16.6%) |
| 18 to 34 Years | 98 (53.8%) | 261 (18.5%) |
| 35 to 64 Years | 6 (100.0%) | 10 (4.5%) |
| 65 to 74 Years | 0 (0.0%) | 0 (0.0%) |
| 75 Years and over | 0 (0.0%) | 0 (0.0%) |
Disability Class by Sex by Age in Fort Riley
Disability Class: Hearing Difficulty
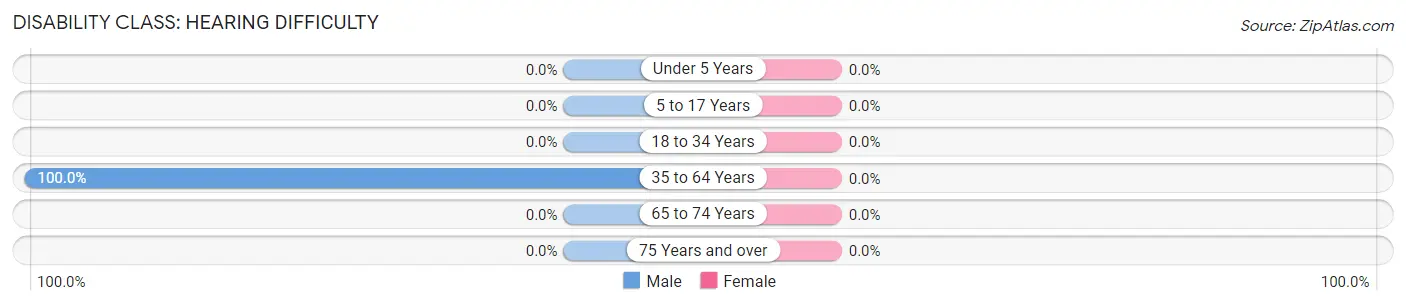
| Age Bracket | Male | Female |
| Under 5 Years | 0 (0.0%) | 0 (0.0%) |
| 5 to 17 Years | 0 (0.0%) | 0 (0.0%) |
| 18 to 34 Years | 0 (0.0%) | 0 (0.0%) |
| 35 to 64 Years | 6 (100.0%) | 0 (0.0%) |
| 65 to 74 Years | 0 (0.0%) | 0 (0.0%) |
| 75 Years and over | 0 (0.0%) | 0 (0.0%) |
Disability Class: Vision Difficulty
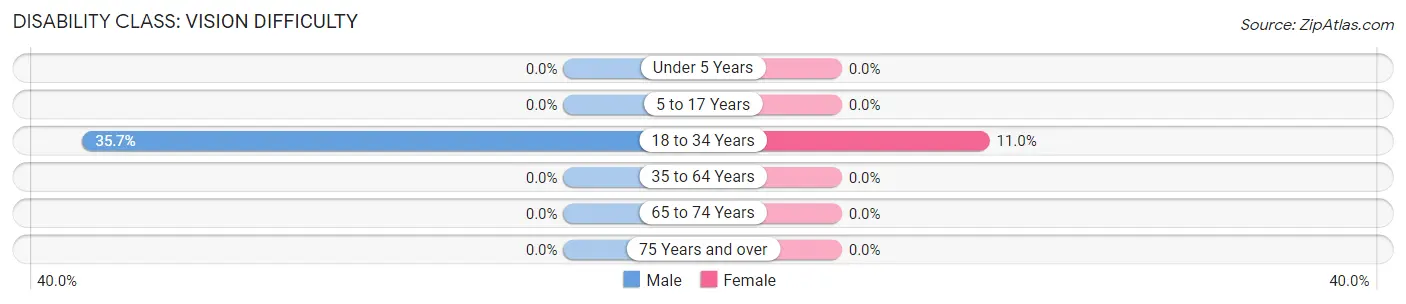
| Age Bracket | Male | Female |
| Under 5 Years | 0 (0.0%) | 0 (0.0%) |
| 5 to 17 Years | 0 (0.0%) | 0 (0.0%) |
| 18 to 34 Years | 65 (35.7%) | 155 (11.0%) |
| 35 to 64 Years | 0 (0.0%) | 0 (0.0%) |
| 65 to 74 Years | 0 (0.0%) | 0 (0.0%) |
| 75 Years and over | 0 (0.0%) | 0 (0.0%) |
Disability Class: Cognitive Difficulty
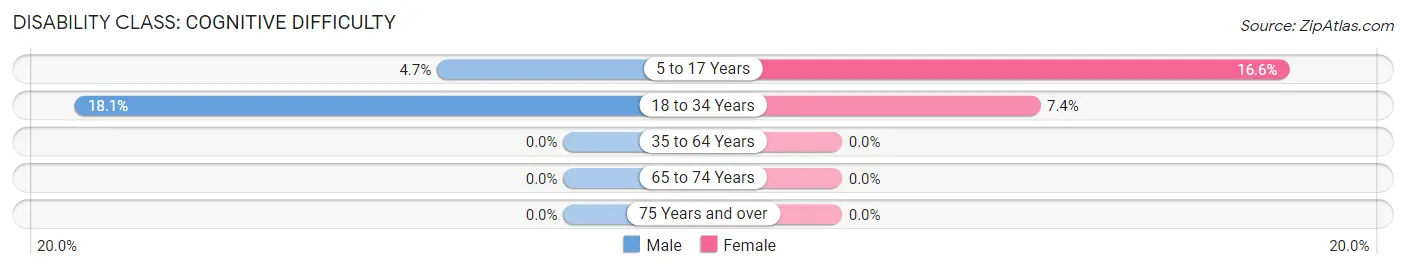
| Age Bracket | Male | Female |
| 5 to 17 Years | 13 (4.7%) | 50 (16.6%) |
| 18 to 34 Years | 33 (18.1%) | 104 (7.4%) |
| 35 to 64 Years | 0 (0.0%) | 0 (0.0%) |
| 65 to 74 Years | 0 (0.0%) | 0 (0.0%) |
| 75 Years and over | 0 (0.0%) | 0 (0.0%) |
Disability Class: Ambulatory Difficulty
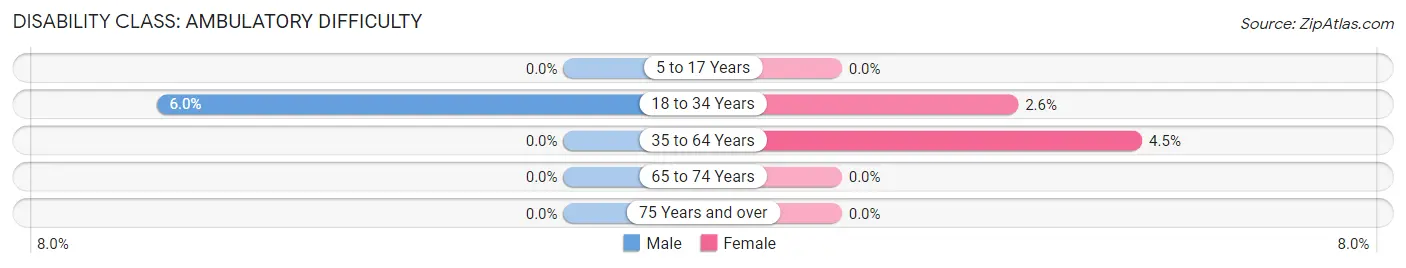
| Age Bracket | Male | Female |
| 5 to 17 Years | 0 (0.0%) | 0 (0.0%) |
| 18 to 34 Years | 11 (6.0%) | 37 (2.6%) |
| 35 to 64 Years | 0 (0.0%) | 10 (4.5%) |
| 65 to 74 Years | 0 (0.0%) | 0 (0.0%) |
| 75 Years and over | 0 (0.0%) | 0 (0.0%) |
Disability Class: Self-Care Difficulty
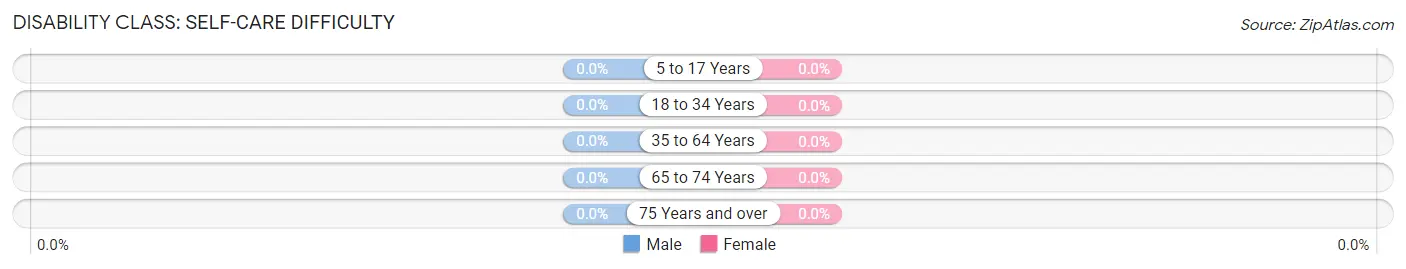
| Age Bracket | Male | Female |
| 5 to 17 Years | 0 (0.0%) | 0 (0.0%) |
| 18 to 34 Years | 0 (0.0%) | 0 (0.0%) |
| 35 to 64 Years | 0 (0.0%) | 0 (0.0%) |
| 65 to 74 Years | 0 (0.0%) | 0 (0.0%) |
| 75 Years and over | 0 (0.0%) | 0 (0.0%) |
Technology Access in Fort Riley
Computing Device Access in Fort Riley
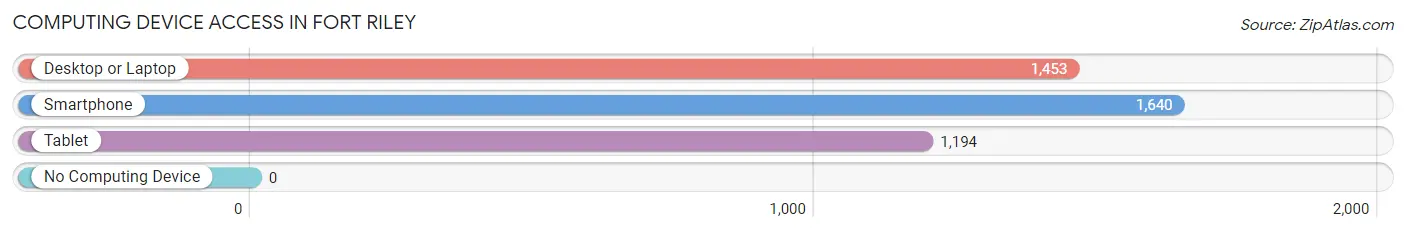
| Device Type | # Households | % Households |
| Desktop or Laptop | 1,453 | 87.8% |
| Smartphone | 1,640 | 99.2% |
| Tablet | 1,194 | 72.2% |
| No Computing Device | 0 | 0.0% |
| Total | 1,654 | 100.0% |
Internet Access in Fort Riley
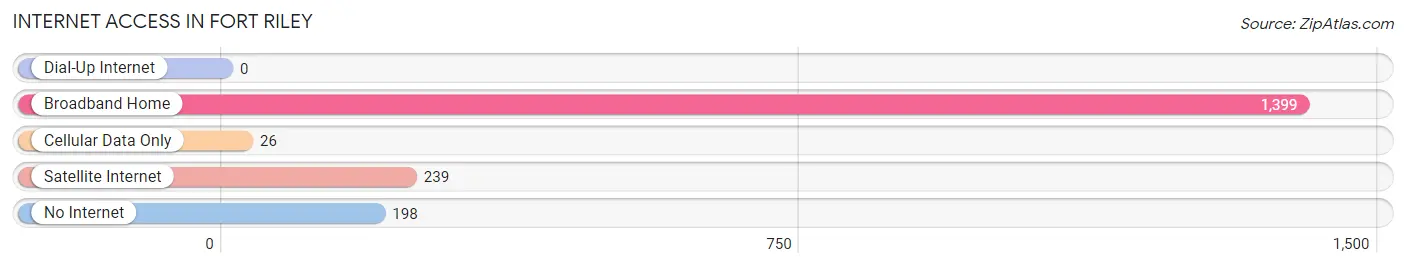
| Internet Type | # Households | % Households |
| Dial-Up Internet | 0 | 0.0% |
| Broadband Home | 1,399 | 84.6% |
| Cellular Data Only | 26 | 1.6% |
| Satellite Internet | 239 | 14.4% |
| No Internet | 198 | 12.0% |
| Total | 1,654 | 100.0% |
Fort Riley Summary
Fort Riley is a United States Army installation located in the Flint Hills region of Kansas, near the city of Junction City and Manhattan. It is the home of the 1st Infantry Division, known as the "Big Red One". The fort was established in 1853 and named in honor of Major General Bennett C. Riley, who served in the Mexican-American War.
History
Fort Riley was established in 1853 as a military post to protect settlers from Native American attacks. It was named after Major General Bennett C. Riley, who served in the Mexican-American War. The fort was originally located on the banks of the Kansas River, but was moved to its current location in 1855.
During the Civil War, Fort Riley served as a training center for Union troops. After the war, the fort was used as a supply depot and a base for the U.S. Cavalry. In 1887, the fort was designated as the home of the 1st Infantry Division, which is still stationed there today.
During World War I, Fort Riley was used as a training center for the U.S. Army. During World War II, the fort was used as a prisoner of war camp. After the war, the fort was used as a training center for the U.S. Army and the U.S. Air Force.
In the 1950s, Fort Riley was the site of the Army's first atomic weapons tests. In the 1960s, the fort was used as a training center for the Vietnam War. In the 1970s, the fort was used as a training center for the Cold War.
Geography
Fort Riley is located in the Flint Hills region of Kansas, near the cities of Junction City and Manhattan. The fort is situated on the banks of the Kansas River, and is surrounded by rolling hills and prairies. The fort covers an area of approximately 100,000 acres, and is home to a variety of wildlife, including deer, wild turkeys, and bald eagles.
Economy
Fort Riley is a major economic driver for the region. The fort has an annual economic impact of over $1 billion, and is home to over 20,000 military personnel and their families. The fort also employs over 5,000 civilian personnel.
The fort is home to a variety of businesses, including restaurants, hotels, retail stores, and entertainment venues. The fort also hosts a variety of events, including air shows, rodeos, and concerts.
Demographics
As of the 2010 census, the population of Fort Riley was 8,945. The racial makeup of the fort was 79.3% White, 11.2% African American, 0.7% Native American, 2.2% Asian, 0.1% Pacific Islander, 4.2% from other races, and 2.3% from two or more races. Hispanic or Latino of any race were 8.3% of the population.
The median income for a household in the fort was $45,813, and the median income for a family was $50,919. The per capita income for the fort was $20,945. About 5.2% of families and 6.3% of the population were below the poverty line, including 8.2% of those under age 18 and 4.2% of those age 65 or over.
Common Questions
What is Per Capita Income in Fort Riley?
Per Capita income in Fort Riley is $24,851.
What is the Median Family Income in Fort Riley?
Median Family Income in Fort Riley is $52,083.
What is the Median Household income in Fort Riley?
Median Household Income in Fort Riley is $48,497.
What is Income or Wage Gap in Fort Riley?
Income or Wage Gap in Fort Riley is 24.3%.
Women in Fort Riley earn 75.7 cents for every dollar earned by a man.
What is Family Income Deficit in Fort Riley?
Family Income Deficit in Fort Riley is $14,908.
Families that are below poverty line in Fort Riley earn $14,908 less on average than the poverty threshold level.
What is Inequality or Gini Index in Fort Riley?
Inequality or Gini Index in Fort Riley is 0.36.
What is the Total Population of Fort Riley?
Total Population of Fort Riley is 8,623.
What is the Total Male Population of Fort Riley?
Total Male Population of Fort Riley is 5,864.
What is the Total Female Population of Fort Riley?
Total Female Population of Fort Riley is 2,759.
What is the Ratio of Males per 100 Females in Fort Riley?
There are 212.54 Males per 100 Females in Fort Riley.
What is the Ratio of Females per 100 Males in Fort Riley?
There are 47.05 Females per 100 Males in Fort Riley.
What is the Median Population Age in Fort Riley?
Median Population Age in Fort Riley is 22.7 Years.
What is the Average Family Size in Fort Riley
Average Family Size in Fort Riley is 3.1 People.
What is the Average Household Size in Fort Riley
Average Household Size in Fort Riley is 2.9 People.
How Large is the Labor Force in Fort Riley?
There are 6,205 People in the Labor Forcein in Fort Riley.
What is the Percentage of People in the Labor Force in Fort Riley?
87.0% of People are in the Labor Force in Fort Riley.
What is the Unemployment Rate in Fort Riley?
Unemployment Rate in Fort Riley is 19.4%.