Delphos, KS Map & Demographics
Delphos Map
Delphos Overview
$29,415
PER CAPITA INCOME
$76,458
AVG FAMILY INCOME
$52,688
AVG HOUSEHOLD INCOME
20.1%
WAGE / INCOME GAP [ % ]
79.9¢/ $1
WAGE / INCOME GAP [ $ ]
0.45
INEQUALITY / GINI INDEX
342
TOTAL POPULATION
161
MALE POPULATION
181
FEMALE POPULATION
88.95
MALES / 100 FEMALES
112.42
FEMALES / 100 MALES
46.5
MEDIAN AGE
2.7
AVG FAMILY SIZE
2.1
AVG HOUSEHOLD SIZE
154
LABOR FORCE [ PEOPLE ]
57.9%
PERCENT IN LABOR FORCE
Delphos Zip Codes
Delphos Area Codes
Income in Delphos
Income Overview in Delphos
Per Capita Income in Delphos is $29,415, while median incomes of families and households are $76,458 and $52,688 respectively.
| Characteristic | Number | Measure |
| Per Capita Income | 342 | $29,415 |
| Median Family Income | 97 | $76,458 |
| Mean Family Income | 97 | $82,380 |
| Median Household Income | 165 | $52,688 |
| Mean Household Income | 165 | $67,161 |
| Income Deficit | 97 | $0 |
| Wage / Income Gap (%) | 342 | 20.12% |
| Wage / Income Gap ($) | 342 | 79.88¢ per $1 |
| Gini / Inequality Index | 342 | 0.45 |
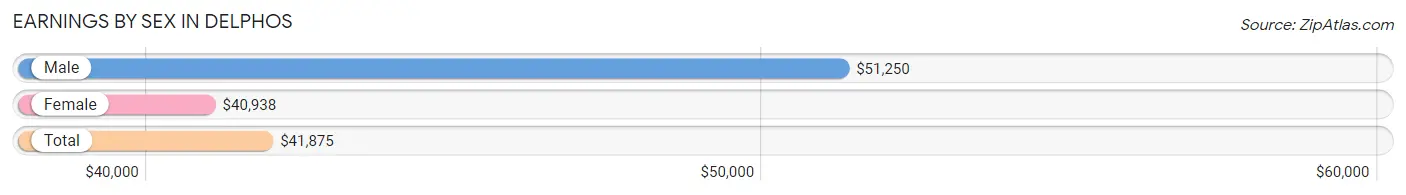
Earnings by Sex in Delphos
Average Earnings in Delphos are $41,875, $51,250 for men and $40,938 for women, a difference of 20.1%.
| Sex | Number | Average Earnings |
| Male | 84 (50.0%) | $51,250 |
| Female | 84 (50.0%) | $40,938 |
| Total | 168 (100.0%) | $41,875 |
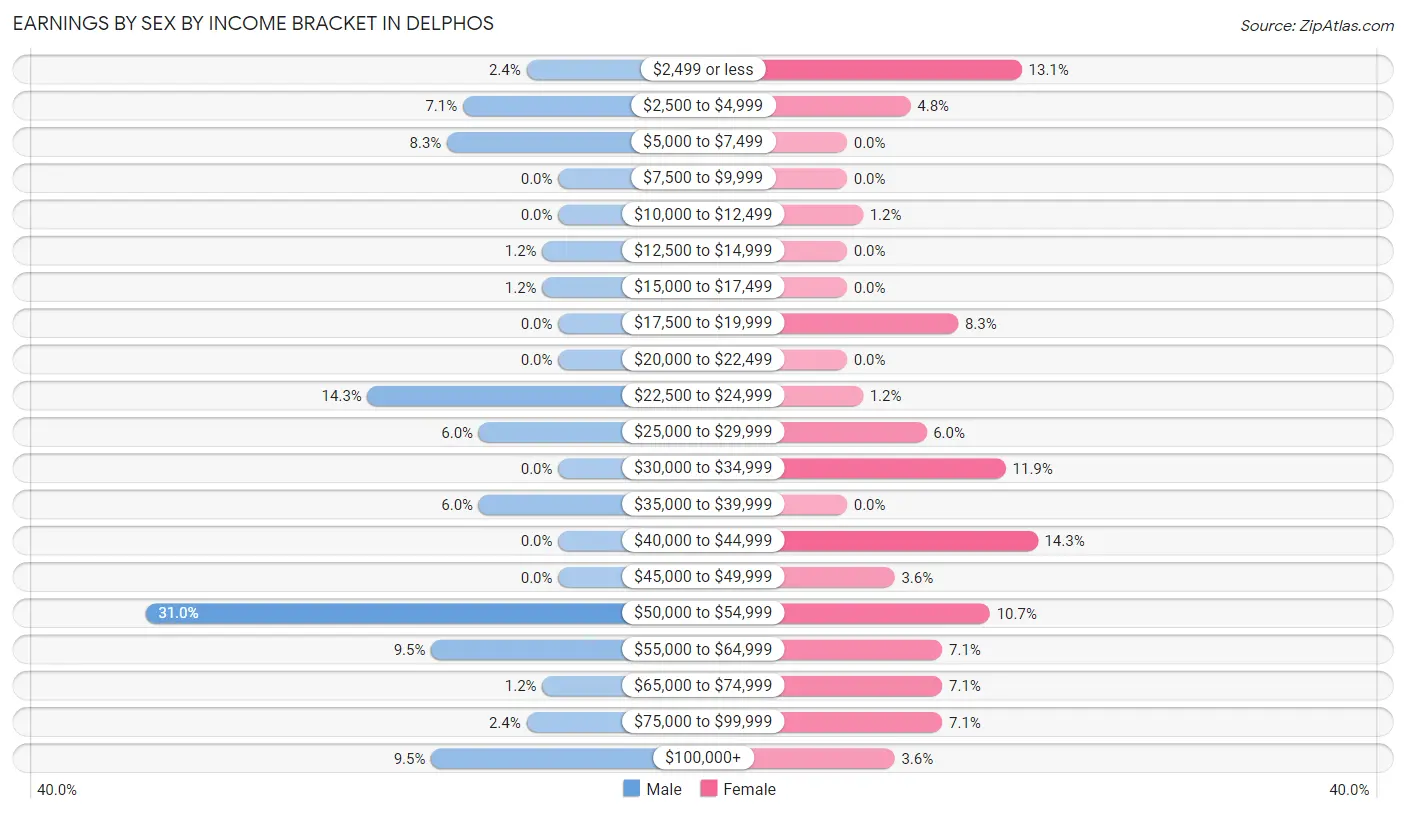
Earnings by Sex by Income Bracket in Delphos
The most common earnings brackets in Delphos are $50,000 to $54,999 for men (26 | 30.9%) and $40,000 to $44,999 for women (12 | 14.3%).
| Income | Male | Female |
| $2,499 or less | 2 (2.4%) | 11 (13.1%) |
| $2,500 to $4,999 | 6 (7.1%) | 4 (4.8%) |
| $5,000 to $7,499 | 7 (8.3%) | 0 (0.0%) |
| $7,500 to $9,999 | 0 (0.0%) | 0 (0.0%) |
| $10,000 to $12,499 | 0 (0.0%) | 1 (1.2%) |
| $12,500 to $14,999 | 1 (1.2%) | 0 (0.0%) |
| $15,000 to $17,499 | 1 (1.2%) | 0 (0.0%) |
| $17,500 to $19,999 | 0 (0.0%) | 7 (8.3%) |
| $20,000 to $22,499 | 0 (0.0%) | 0 (0.0%) |
| $22,500 to $24,999 | 12 (14.3%) | 1 (1.2%) |
| $25,000 to $29,999 | 5 (5.9%) | 5 (5.9%) |
| $30,000 to $34,999 | 0 (0.0%) | 10 (11.9%) |
| $35,000 to $39,999 | 5 (5.9%) | 0 (0.0%) |
| $40,000 to $44,999 | 0 (0.0%) | 12 (14.3%) |
| $45,000 to $49,999 | 0 (0.0%) | 3 (3.6%) |
| $50,000 to $54,999 | 26 (30.9%) | 9 (10.7%) |
| $55,000 to $64,999 | 8 (9.5%) | 6 (7.1%) |
| $65,000 to $74,999 | 1 (1.2%) | 6 (7.1%) |
| $75,000 to $99,999 | 2 (2.4%) | 6 (7.1%) |
| $100,000+ | 8 (9.5%) | 3 (3.6%) |
| Total | 84 (100.0%) | 84 (100.0%) |
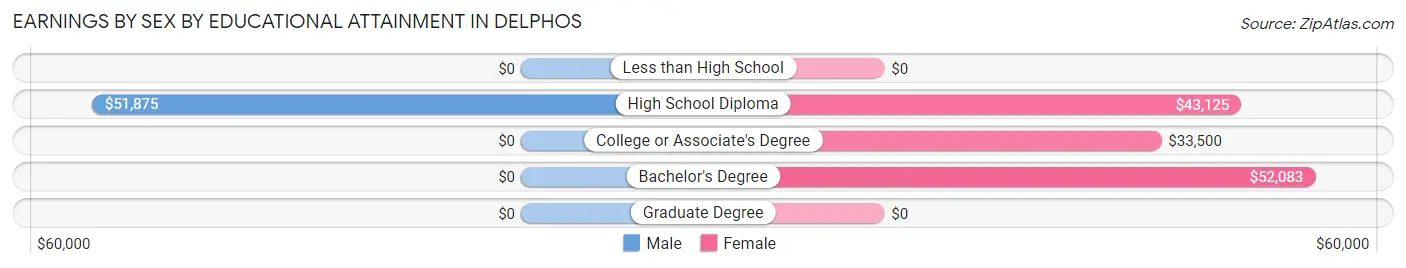
Earnings by Sex by Educational Attainment in Delphos
Average earnings in Delphos are $51,042 for men and $41,719 for women, a difference of 18.3%. Men with an educational attainment of high school diploma enjoy the highest average annual earnings of $51,875, while those with high school diploma education earn the least with $51,875. Women with an educational attainment of bachelor's degree earn the most with the average annual earnings of $52,083, while those with college or associate's degree education have the smallest earnings of $33,500.
| Educational Attainment | Male Income | Female Income |
| Less than High School | - | - |
| High School Diploma | $51,875 | $43,125 |
| College or Associate's Degree | - | - |
| Bachelor's Degree | - | - |
| Graduate Degree | - | - |
| Total | $51,042 | $41,719 |
Family Income in Delphos
Family Income Brackets in Delphos
According to the Delphos family income data, there are 23 families falling into the $100,000 to $149,999 income range, which is the most common income bracket and makes up 23.7% of all families.
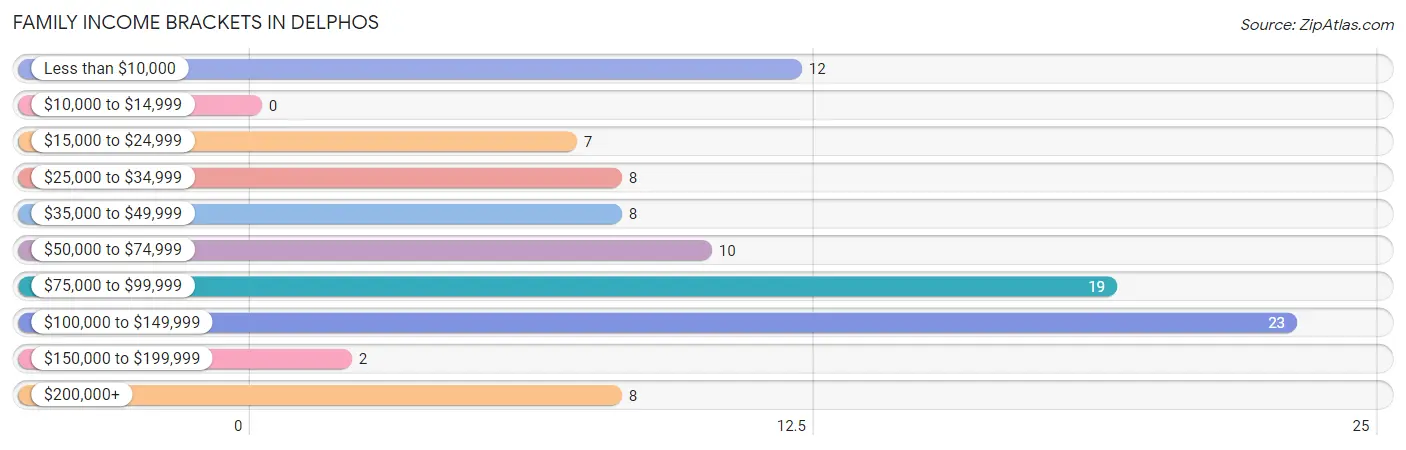
| Income Bracket | # Families | % Families |
| Less than $10,000 | 12 | 12.4% |
| $10,000 to $14,999 | 0 | 0.0% |
| $15,000 to $24,999 | 7 | 7.2% |
| $25,000 to $34,999 | 8 | 8.2% |
| $35,000 to $49,999 | 8 | 8.2% |
| $50,000 to $74,999 | 10 | 10.3% |
| $75,000 to $99,999 | 19 | 19.6% |
| $100,000 to $149,999 | 23 | 23.7% |
| $150,000 to $199,999 | 2 | 2.1% |
| $200,000+ | 8 | 8.2% |
Family Income by Famaliy Size in Delphos
3-person families (16 | 16.5%) account for the highest median family income in Delphos with $93,889 per family, while 3-person families (16 | 16.5%) have the highest median income of $31,296 per family member.
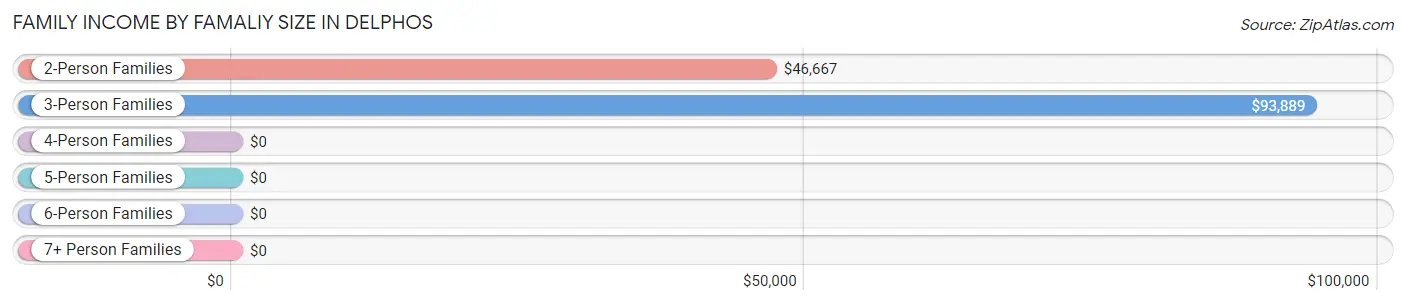
| Income Bracket | # Families | Median Income |
| 2-Person Families | 46 (47.4%) | $46,667 |
| 3-Person Families | 16 (16.5%) | $93,889 |
| 4-Person Families | 7 (7.2%) | $0 |
| 5-Person Families | 18 (18.6%) | $0 |
| 6-Person Families | 10 (10.3%) | $0 |
| 7+ Person Families | 0 (0.0%) | $0 |
| Total | 97 (100.0%) | $76,458 |
Family Income by Number of Earners in Delphos
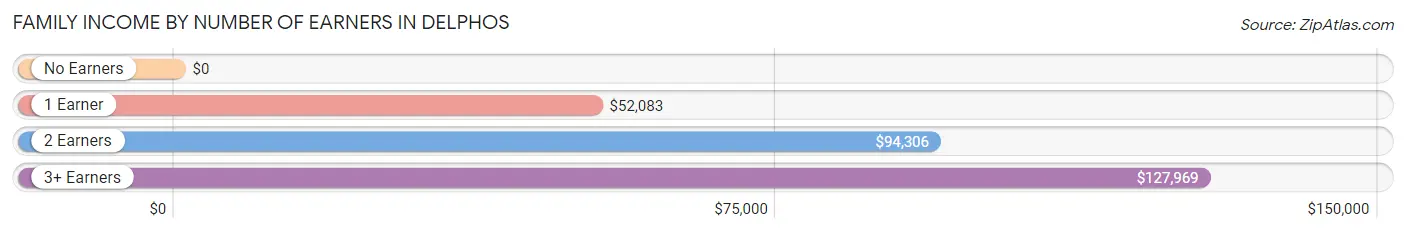
| Number of Earners | # Families | Median Income |
| No Earners | 20 (20.6%) | $0 |
| 1 Earner | 21 (21.6%) | $52,083 |
| 2 Earners | 43 (44.3%) | $94,306 |
| 3+ Earners | 13 (13.4%) | $127,969 |
| Total | 97 (100.0%) | $76,458 |
Household Income in Delphos
Household Income Brackets in Delphos
With 33 households falling in the category, the $50,000 to $74,999 income range is the most frequent in Delphos, accounting for 20.0% of all households. In contrast, only 2 households (1.2%) fall into the $150,000 to $199,999 income bracket, making it the least populous group.
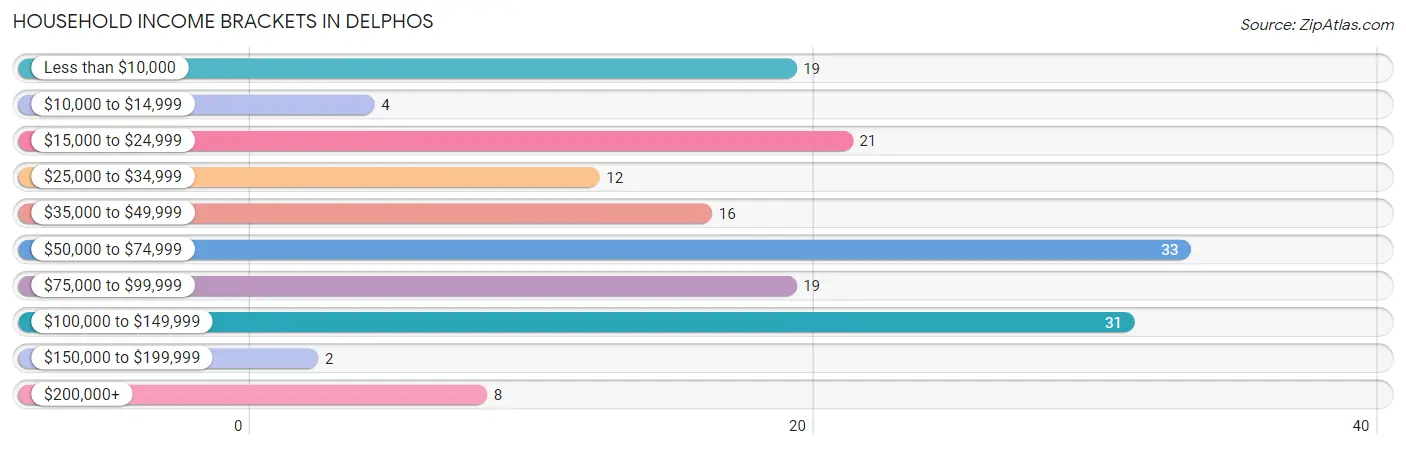
| Income Bracket | # Households | % Households |
| Less than $10,000 | 19 | 11.5% |
| $10,000 to $14,999 | 4 | 2.4% |
| $15,000 to $24,999 | 21 | 12.7% |
| $25,000 to $34,999 | 12 | 7.3% |
| $35,000 to $49,999 | 16 | 9.7% |
| $50,000 to $74,999 | 33 | 20.0% |
| $75,000 to $99,999 | 19 | 11.5% |
| $100,000 to $149,999 | 31 | 18.8% |
| $150,000 to $199,999 | 2 | 1.2% |
| $200,000+ | 8 | 4.8% |
Household Income by Householder Age in Delphos
The median household income in Delphos is $52,688, with the highest median household income of $40,625 found in the 65+ years age bracket for the primary householder. A total of 63 households (38.2%) fall into this category. Meanwhile, the 15 to 24 years age bracket for the primary householder has the lowest median household income of $0, with 18 households (10.9%) in this group.
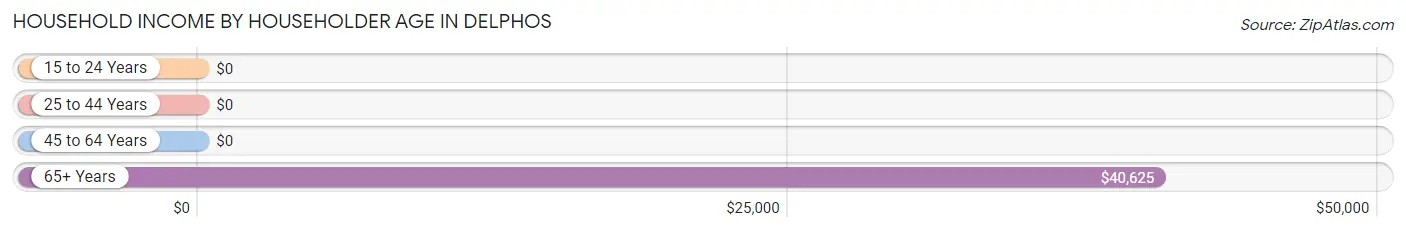
| Income Bracket | # Households | Median Income |
| 15 to 24 Years | 18 (10.9%) | $0 |
| 25 to 44 Years | 32 (19.4%) | $0 |
| 45 to 64 Years | 52 (31.5%) | $0 |
| 65+ Years | 63 (38.2%) | $40,625 |
| Total | 165 (100.0%) | $52,688 |
Poverty in Delphos
Income Below Poverty by Sex and Age in Delphos
With 19.9% poverty level for males and 25.4% for females among the residents of Delphos, 5 year old males and 16 and 17 year old females are the most vulnerable to poverty, with 2 males (100.0%) and 1 females (100.0%) in their respective age groups living below the poverty level.
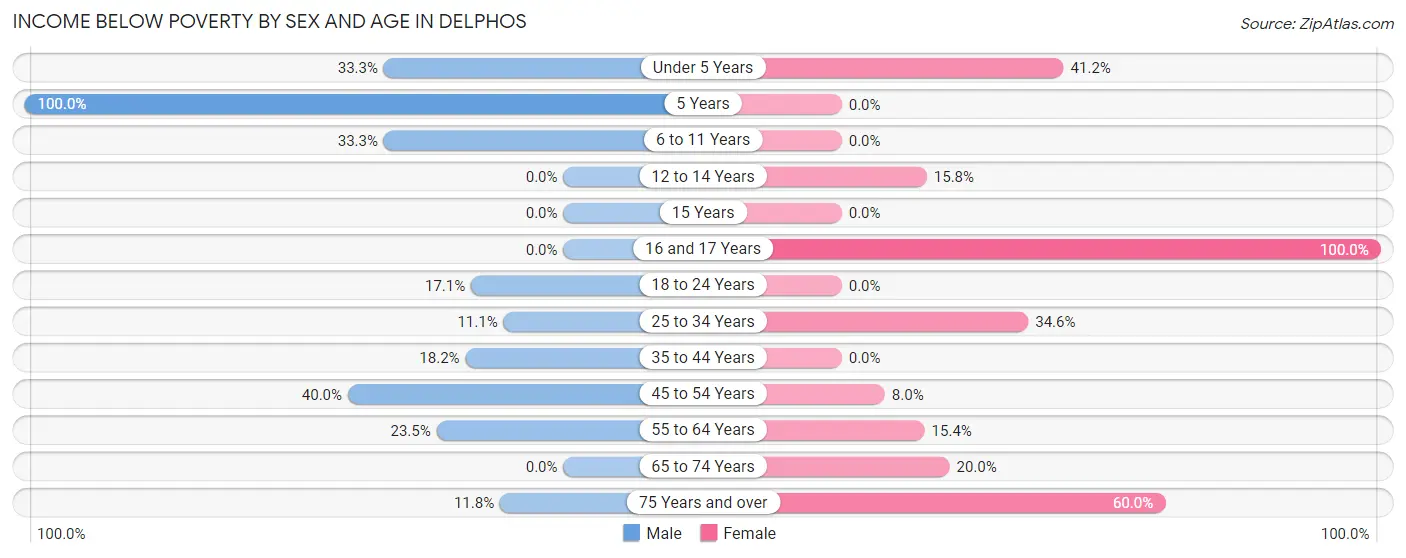
| Age Bracket | Male | Female |
| Under 5 Years | 2 (33.3%) | 7 (41.2%) |
| 5 Years | 2 (100.0%) | 0 (0.0%) |
| 6 to 11 Years | 7 (33.3%) | 0 (0.0%) |
| 12 to 14 Years | 0 (0.0%) | 3 (15.8%) |
| 15 Years | 0 (0.0%) | 0 (0.0%) |
| 16 and 17 Years | 0 (0.0%) | 1 (100.0%) |
| 18 to 24 Years | 6 (17.1%) | 0 (0.0%) |
| 25 to 34 Years | 1 (11.1%) | 9 (34.6%) |
| 35 to 44 Years | 2 (18.2%) | 0 (0.0%) |
| 45 to 54 Years | 2 (40.0%) | 2 (8.0%) |
| 55 to 64 Years | 8 (23.5%) | 4 (15.4%) |
| 65 to 74 Years | 0 (0.0%) | 5 (20.0%) |
| 75 Years and over | 2 (11.8%) | 15 (60.0%) |
| Total | 32 (19.9%) | 46 (25.4%) |
Income Above Poverty by Sex and Age in Delphos
According to the poverty statistics in Delphos, males aged 12 to 14 years and females aged 6 to 11 years are the age groups that are most secure financially, with 100.0% of males and 100.0% of females in these age groups living above the poverty line.
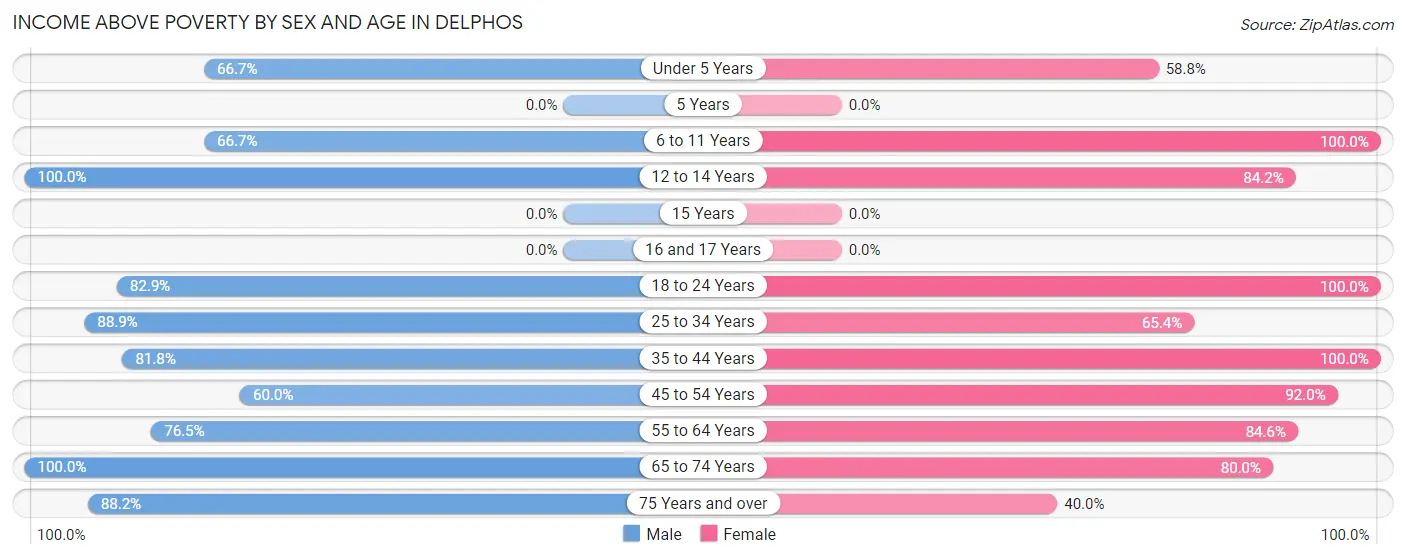
| Age Bracket | Male | Female |
| Under 5 Years | 4 (66.7%) | 10 (58.8%) |
| 5 Years | 0 (0.0%) | 0 (0.0%) |
| 6 to 11 Years | 14 (66.7%) | 8 (100.0%) |
| 12 to 14 Years | 3 (100.0%) | 16 (84.2%) |
| 15 Years | 0 (0.0%) | 0 (0.0%) |
| 16 and 17 Years | 0 (0.0%) | 0 (0.0%) |
| 18 to 24 Years | 29 (82.9%) | 4 (100.0%) |
| 25 to 34 Years | 8 (88.9%) | 17 (65.4%) |
| 35 to 44 Years | 9 (81.8%) | 5 (100.0%) |
| 45 to 54 Years | 3 (60.0%) | 23 (92.0%) |
| 55 to 64 Years | 26 (76.5%) | 22 (84.6%) |
| 65 to 74 Years | 18 (100.0%) | 20 (80.0%) |
| 75 Years and over | 15 (88.2%) | 10 (40.0%) |
| Total | 129 (80.1%) | 135 (74.6%) |
Income Below Poverty Among Married-Couple Families in Delphos
The poverty statistics for married-couple families in Delphos show that 20.6% or 14 of the total 68 families live below the poverty line. Families with 3 or 4 children have the highest poverty rate of 100.0%, comprising of 2 families. On the other hand, families with 1 or 2 children have the lowest poverty rate of 0.0%, which includes 0 families.
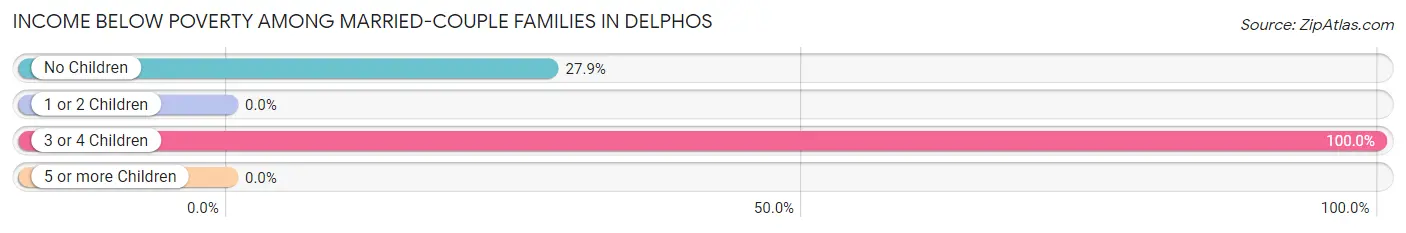
| Children | Above Poverty | Below Poverty |
| No Children | 31 (72.1%) | 12 (27.9%) |
| 1 or 2 Children | 23 (100.0%) | 0 (0.0%) |
| 3 or 4 Children | 0 (0.0%) | 2 (100.0%) |
| 5 or more Children | 0 (0.0%) | 0 (0.0%) |
| Total | 54 (79.4%) | 14 (20.6%) |
Income Below Poverty Among Single-Parent Households in Delphos
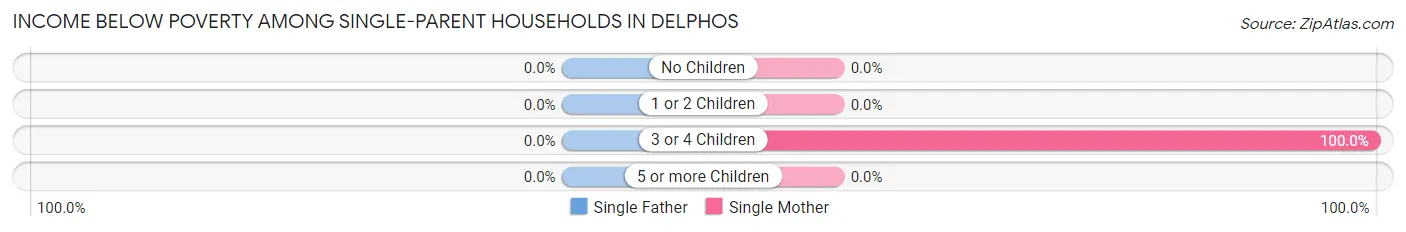
| Children | Single Father | Single Mother |
| No Children | 0 (0.0%) | 0 (0.0%) |
| 1 or 2 Children | 0 (0.0%) | 0 (0.0%) |
| 3 or 4 Children | 0 (0.0%) | 9 (100.0%) |
| 5 or more Children | 0 (0.0%) | 0 (0.0%) |
| Total | 0 (0.0%) | 9 (45.0%) |
Income Below Poverty Among Married-Couple vs Single-Parent Households in Delphos
The poverty data for Delphos shows that 14 of the married-couple family households (20.6%) and 9 of the single-parent households (31.0%) are living below the poverty level. Within the married-couple family households, those with 3 or 4 children have the highest poverty rate, with 2 households (100.0%) falling below the poverty line. Among the single-parent households, those with 3 or 4 children have the highest poverty rate, with 9 household (100.0%) living below poverty.
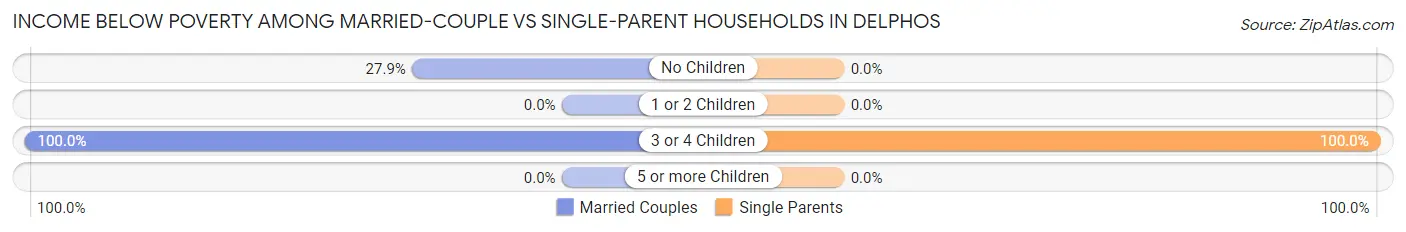
| Children | Married-Couple Families | Single-Parent Households |
| No Children | 12 (27.9%) | 0 (0.0%) |
| 1 or 2 Children | 0 (0.0%) | 0 (0.0%) |
| 3 or 4 Children | 2 (100.0%) | 9 (100.0%) |
| 5 or more Children | 0 (0.0%) | 0 (0.0%) |
| Total | 14 (20.6%) | 9 (31.0%) |
Race in Delphos
The most populous races in Delphos are White / Caucasian (315 | 92.1%), Two or more Races (25 | 7.3%), and Hispanic or Latino (17 | 5.0%).
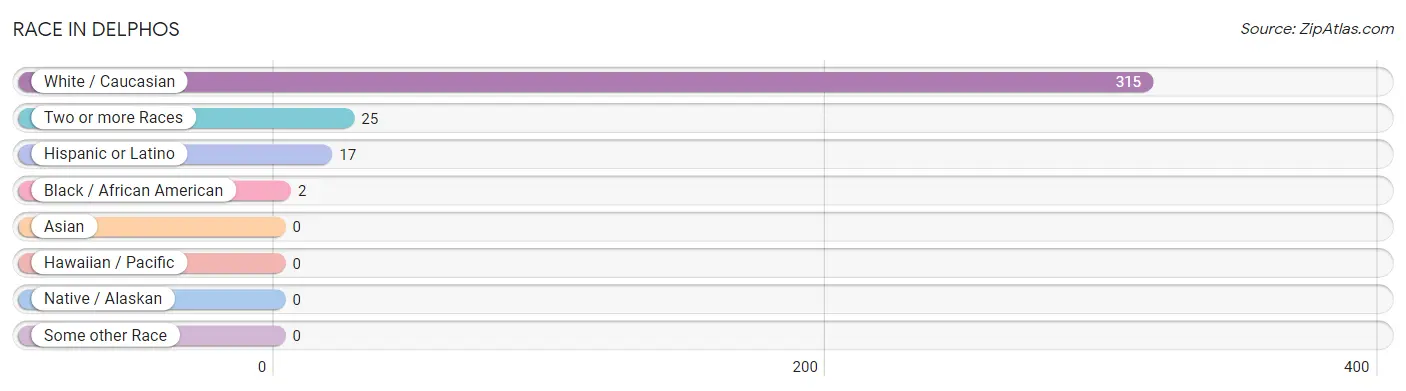
| Race | # Population | % Population |
| Asian | 0 | 0.0% |
| Black / African American | 2 | 0.6% |
| Hawaiian / Pacific | 0 | 0.0% |
| Hispanic or Latino | 17 | 5.0% |
| Native / Alaskan | 0 | 0.0% |
| White / Caucasian | 315 | 92.1% |
| Two or more Races | 25 | 7.3% |
| Some other Race | 0 | 0.0% |
| Total | 342 | 100.0% |
Ancestry in Delphos
The most populous ancestries reported in Delphos are German (125 | 36.5%), English (65 | 19.0%), Italian (46 | 13.5%), French (24 | 7.0%), and Swedish (21 | 6.1%), together accounting for 82.2% of all Delphos residents.
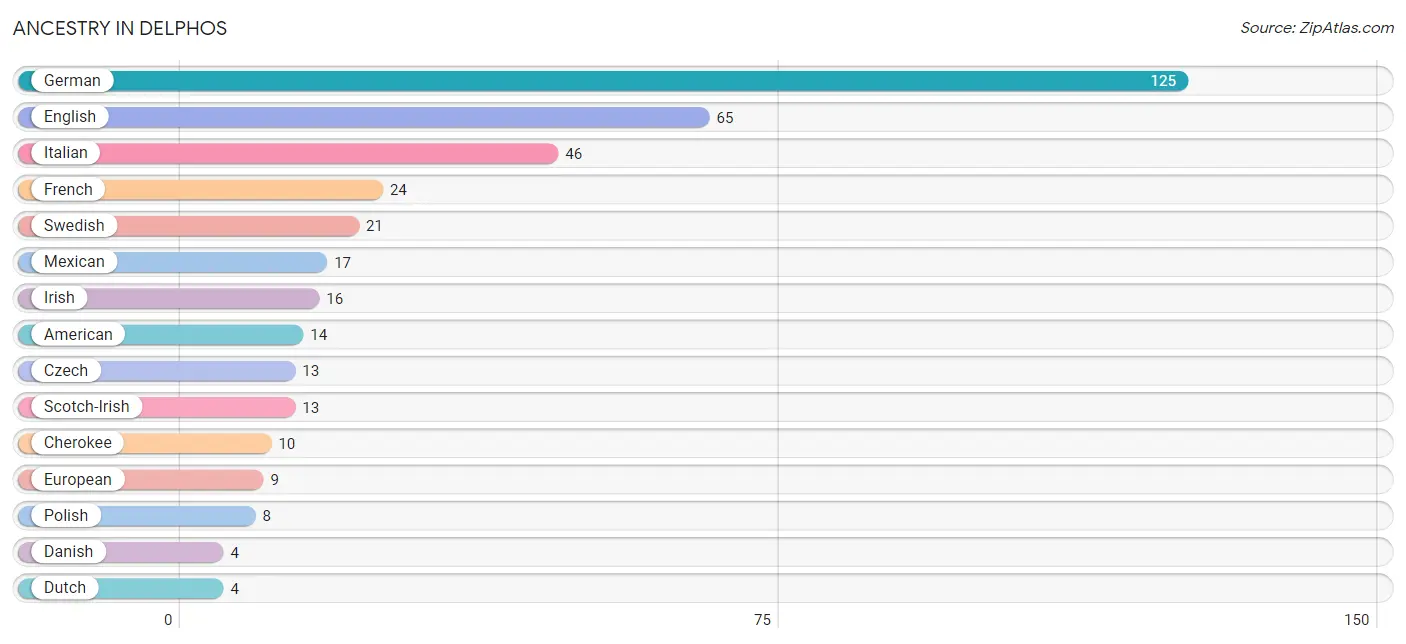
| Ancestry | # Population | % Population |
| American | 14 | 4.1% |
| Belgian | 3 | 0.9% |
| Cherokee | 10 | 2.9% |
| Czech | 13 | 3.8% |
| Danish | 4 | 1.2% |
| Dutch | 4 | 1.2% |
| English | 65 | 19.0% |
| European | 9 | 2.6% |
| French | 24 | 7.0% |
| German | 125 | 36.5% |
| Irish | 16 | 4.7% |
| Italian | 46 | 13.5% |
| Mexican | 17 | 5.0% |
| Navajo | 3 | 0.9% |
| Polish | 8 | 2.3% |
| Scotch-Irish | 13 | 3.8% |
| Scottish | 1 | 0.3% |
| Swedish | 21 | 6.1% | View All 18 Rows |
Immigrants in Delphos
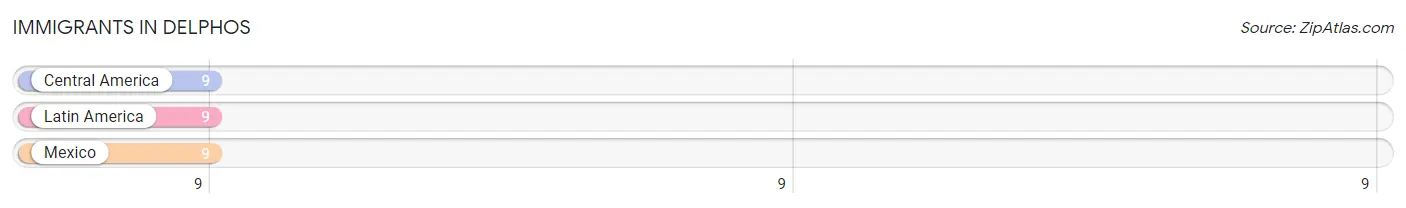
The most numerous immigrant groups reported in Delphos came from Central America (9 | 2.6%), Latin America (9 | 2.6%), and Mexico (9 | 2.6%), together accounting for 7.9% of all Delphos residents.
| Immigration Origin | # Population | % Population |
| Central America | 9 | 2.6% |
| Latin America | 9 | 2.6% |
| Mexico | 9 | 2.6% | View All 3 Rows |
Sex and Age in Delphos
Sex and Age in Delphos
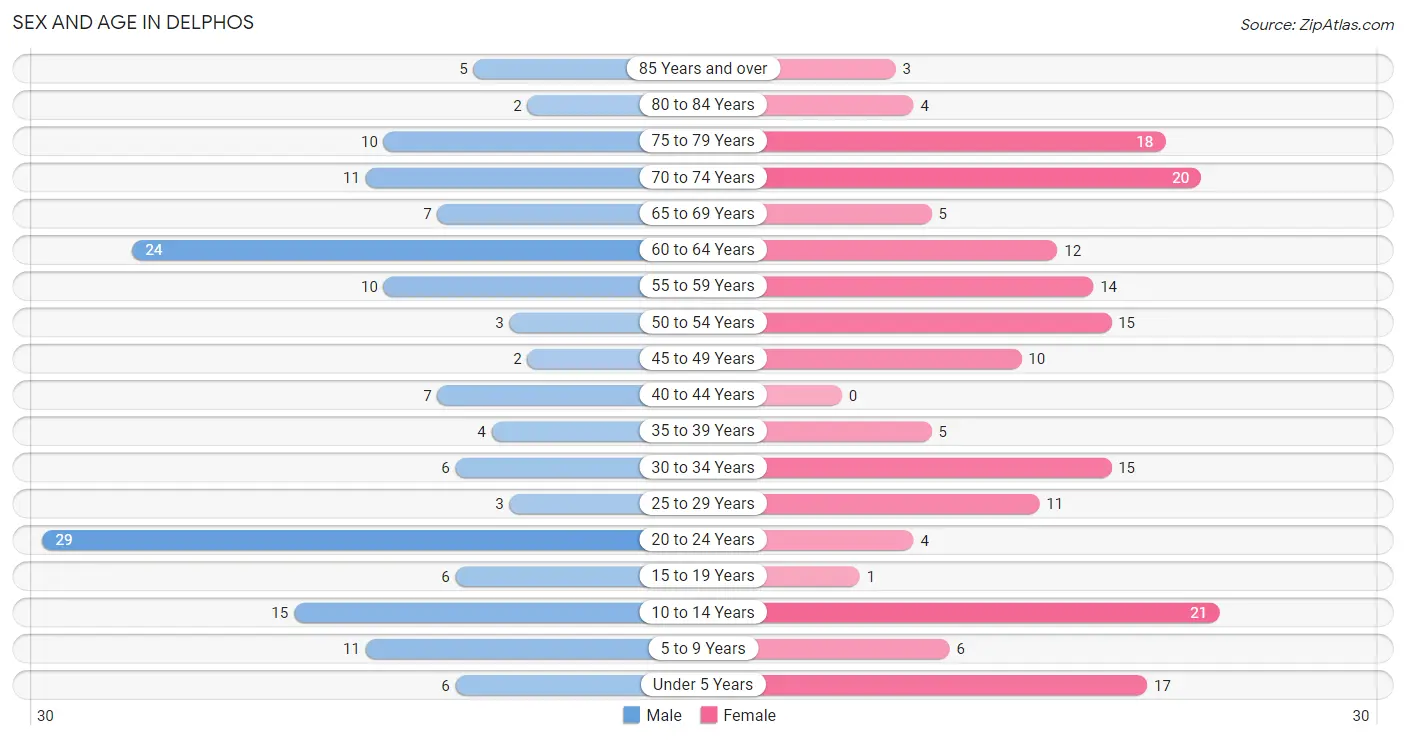
The most populous age groups in Delphos are 20 to 24 Years (29 | 18.0%) for men and 10 to 14 Years (21 | 11.6%) for women.
| Age Bracket | Male | Female |
| Under 5 Years | 6 (3.7%) | 17 (9.4%) |
| 5 to 9 Years | 11 (6.8%) | 6 (3.3%) |
| 10 to 14 Years | 15 (9.3%) | 21 (11.6%) |
| 15 to 19 Years | 6 (3.7%) | 1 (0.5%) |
| 20 to 24 Years | 29 (18.0%) | 4 (2.2%) |
| 25 to 29 Years | 3 (1.9%) | 11 (6.1%) |
| 30 to 34 Years | 6 (3.7%) | 15 (8.3%) |
| 35 to 39 Years | 4 (2.5%) | 5 (2.8%) |
| 40 to 44 Years | 7 (4.3%) | 0 (0.0%) |
| 45 to 49 Years | 2 (1.2%) | 10 (5.5%) |
| 50 to 54 Years | 3 (1.9%) | 15 (8.3%) |
| 55 to 59 Years | 10 (6.2%) | 14 (7.7%) |
| 60 to 64 Years | 24 (14.9%) | 12 (6.6%) |
| 65 to 69 Years | 7 (4.3%) | 5 (2.8%) |
| 70 to 74 Years | 11 (6.8%) | 20 (11.1%) |
| 75 to 79 Years | 10 (6.2%) | 18 (9.9%) |
| 80 to 84 Years | 2 (1.2%) | 4 (2.2%) |
| 85 Years and over | 5 (3.1%) | 3 (1.7%) |
| Total | 161 (100.0%) | 181 (100.0%) |
Families and Households in Delphos
Median Family Size in Delphos
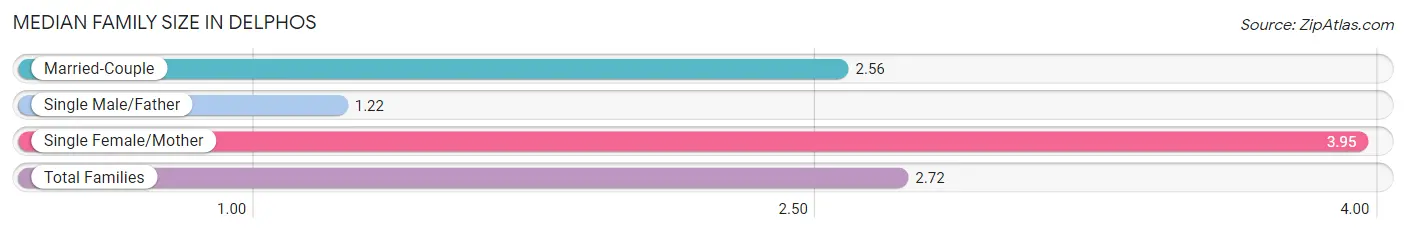
The median family size in Delphos is 2.72 persons per family, with single female/mother families (20 | 20.6%) accounting for the largest median family size of 3.95 persons per family. On the other hand, single male/father families (9 | 9.3%) represent the smallest median family size with 1.22 persons per family.
| Family Type | # Families | Family Size |
| Married-Couple | 68 (70.1%) | 2.56 |
| Single Male/Father | 9 (9.3%) | 1.22 |
| Single Female/Mother | 20 (20.6%) | 3.95 |
| Total Families | 97 (100.0%) | 2.72 |
Median Household Size in Delphos
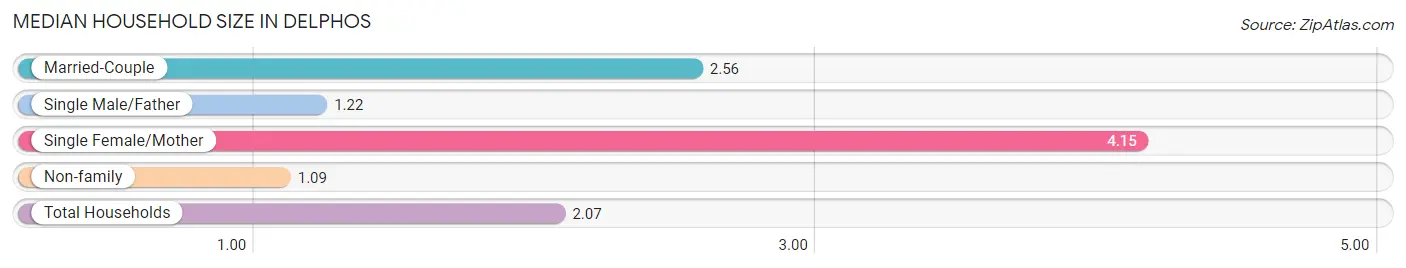
The median household size in Delphos is 2.07 persons per household, with single female/mother households (20 | 12.1%) accounting for the largest median household size of 4.15 persons per household. non-family households (68 | 41.2%) represent the smallest median household size with 1.09 persons per household.
| Household Type | # Households | Household Size |
| Married-Couple | 68 (41.2%) | 2.56 |
| Single Male/Father | 9 (5.4%) | 1.22 |
| Single Female/Mother | 20 (12.1%) | 4.15 |
| Non-family | 68 (41.2%) | 1.09 |
| Total Households | 165 (100.0%) | 2.07 |
Household Size by Marriage Status in Delphos
Out of a total of 165 households in Delphos, 97 (58.8%) are family households, while 68 (41.2%) are nonfamily households. The most numerous type of family households are 2-person households, comprising 46, and the most common type of nonfamily households are 1-person households, comprising 63.
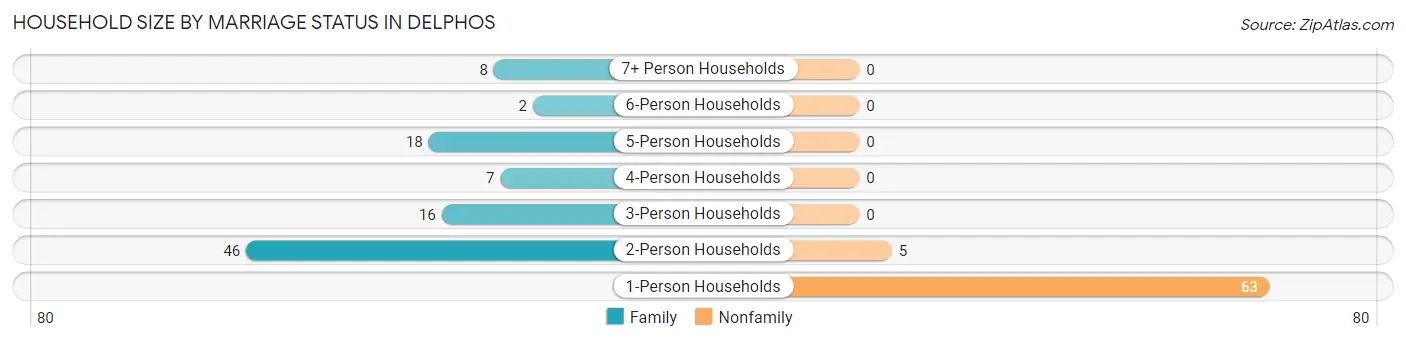
| Household Size | Family Households | Nonfamily Households |
| 1-Person Households | - | 63 (38.2%) |
| 2-Person Households | 46 (27.9%) | 5 (3.0%) |
| 3-Person Households | 16 (9.7%) | 0 (0.0%) |
| 4-Person Households | 7 (4.2%) | 0 (0.0%) |
| 5-Person Households | 18 (10.9%) | 0 (0.0%) |
| 6-Person Households | 2 (1.2%) | 0 (0.0%) |
| 7+ Person Households | 8 (4.9%) | 0 (0.0%) |
| Total | 97 (58.8%) | 68 (41.2%) |
Female Fertility in Delphos
Fertility by Age in Delphos
Average fertility rate in Delphos is 213.0 births per 1,000 women. Women in the age bracket of 20 to 34 years have the highest fertility rate with 333.0 births per 1,000 women. Women in the age bracket of 20 to 34 years acount for 100.0% of all women with births.
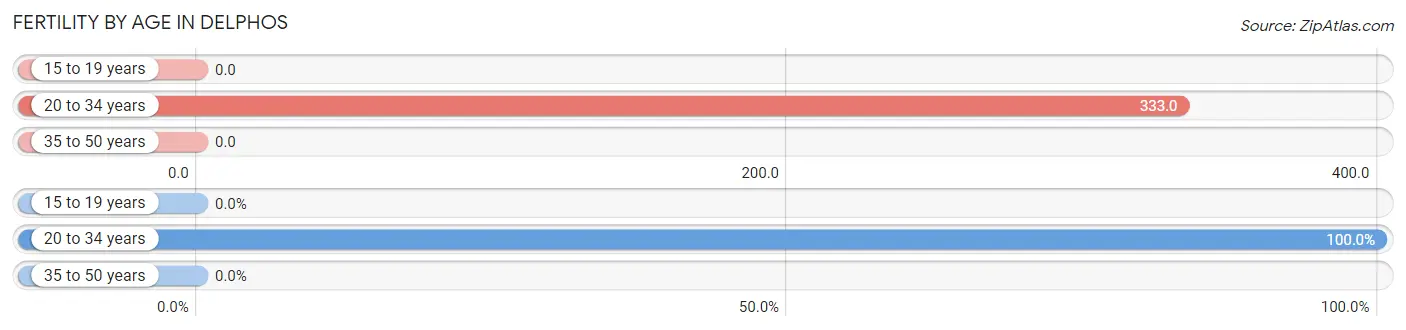
| Age Bracket | Women with Births | Births / 1,000 Women |
| 15 to 19 years | 0 (0.0%) | 0.0 |
| 20 to 34 years | 10 (100.0%) | 333.0 |
| 35 to 50 years | 0 (0.0%) | 0.0 |
| Total | 10 (100.0%) | 213.0 |
Fertility by Age by Marriage Status in Delphos
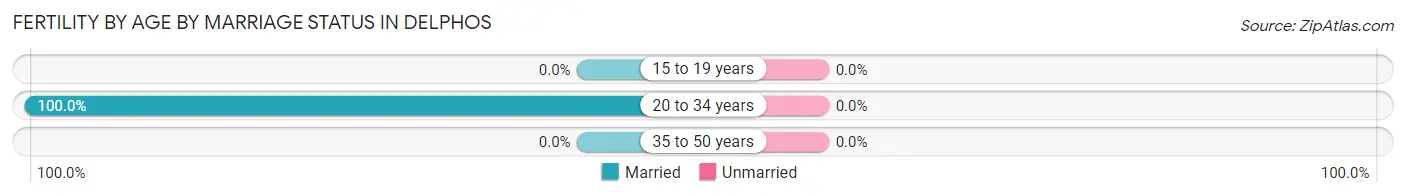
| Age Bracket | Married | Unmarried |
| 15 to 19 years | 0 (0.0%) | 0 (0.0%) |
| 20 to 34 years | 10 (100.0%) | 0 (0.0%) |
| 35 to 50 years | 0 (0.0%) | 0 (0.0%) |
| Total | 10 (100.0%) | 0 (0.0%) |
Fertility by Education in Delphos
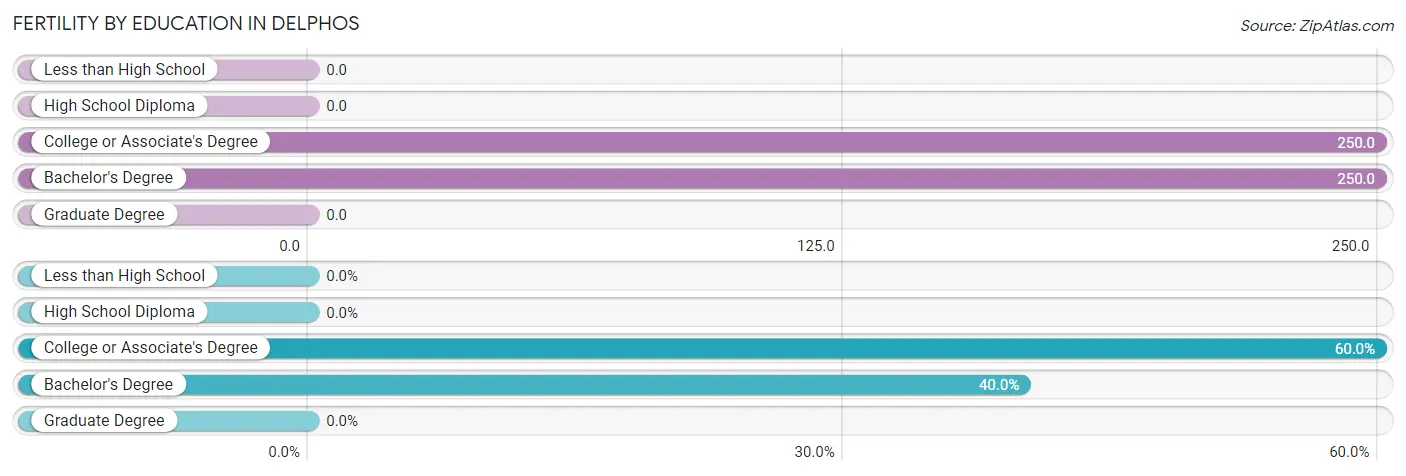
| Educational Attainment | Women with Births | Births / 1,000 Women |
| Less than High School | 0 (0.0%) | 0.0 |
| High School Diploma | 0 (0.0%) | 0.0 |
| College or Associate's Degree | 6 (60.0%) | 250.0 |
| Bachelor's Degree | 4 (40.0%) | 250.0 |
| Graduate Degree | 0 (0.0%) | 0.0 |
| Total | 10 (100.0%) | 213.0 |
Fertility by Education by Marriage Status in Delphos
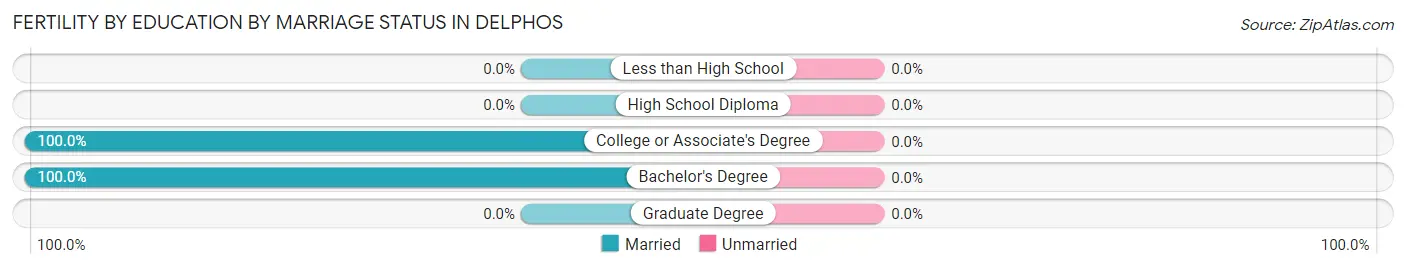
| Educational Attainment | Married | Unmarried |
| Less than High School | 0 (0.0%) | 0 (0.0%) |
| High School Diploma | 0 (0.0%) | 0 (0.0%) |
| College or Associate's Degree | 6 (100.0%) | 0 (0.0%) |
| Bachelor's Degree | 4 (100.0%) | 0 (0.0%) |
| Graduate Degree | 0 (0.0%) | 0 (0.0%) |
| Total | 10 (100.0%) | 0 (0.0%) |
Employment Characteristics in Delphos
Employment by Class of Employer in Delphos
Among the 153 employed individuals in Delphos, private company employees (89 | 58.2%), local government employees (34 | 22.2%), and not-for-profit organizations (21 | 13.7%) make up the most common classes of employment.
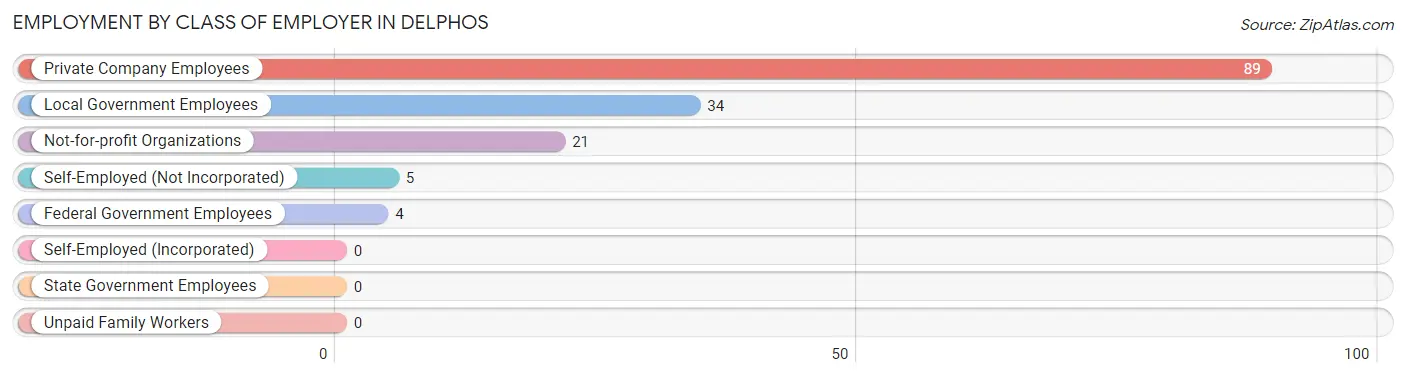
| Employer Class | # Employees | % Employees |
| Private Company Employees | 89 | 58.2% |
| Self-Employed (Incorporated) | 0 | 0.0% |
| Self-Employed (Not Incorporated) | 5 | 3.3% |
| Not-for-profit Organizations | 21 | 13.7% |
| Local Government Employees | 34 | 22.2% |
| State Government Employees | 0 | 0.0% |
| Federal Government Employees | 4 | 2.6% |
| Unpaid Family Workers | 0 | 0.0% |
| Total | 153 | 100.0% |
Employment Status by Age in Delphos
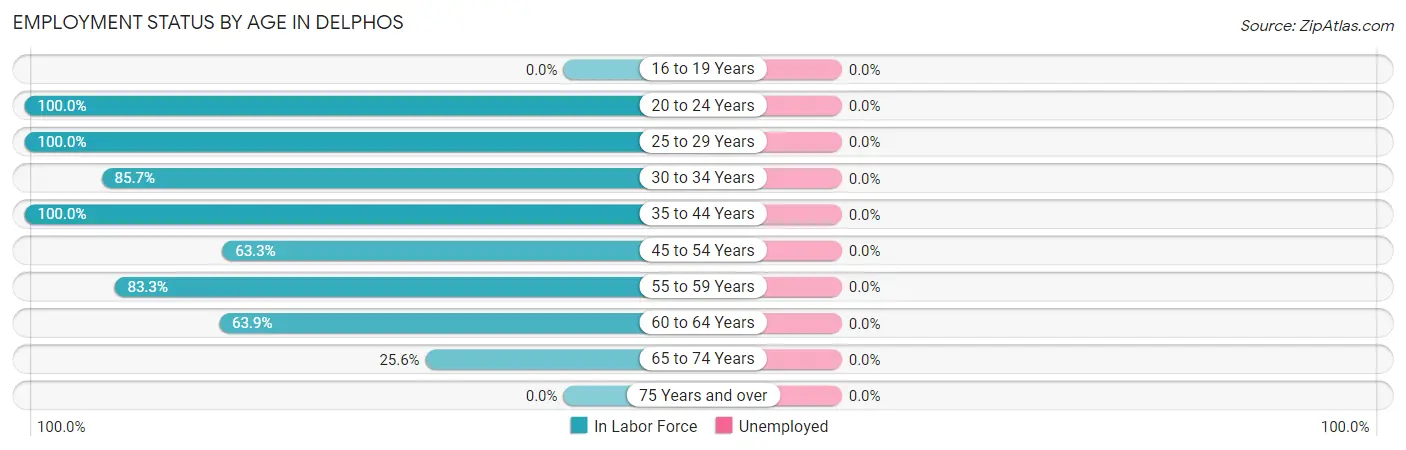
| Age Bracket | In Labor Force | Unemployed |
| 16 to 19 Years | 0 (0.0%) | 0 (0.0%) |
| 20 to 24 Years | 33 (100.0%) | 0 (0.0%) |
| 25 to 29 Years | 14 (100.0%) | 0 (0.0%) |
| 30 to 34 Years | 18 (85.7%) | 0 (0.0%) |
| 35 to 44 Years | 16 (100.0%) | 0 (0.0%) |
| 45 to 54 Years | 19 (63.3%) | 0 (0.0%) |
| 55 to 59 Years | 20 (83.3%) | 0 (0.0%) |
| 60 to 64 Years | 23 (63.9%) | 0 (0.0%) |
| 65 to 74 Years | 11 (25.6%) | 0 (0.0%) |
| 75 Years and over | 0 (0.0%) | 0 (0.0%) |
| Total | 154 (57.9%) | 0 (0.0%) |
Employment Status by Educational Attainment in Delphos
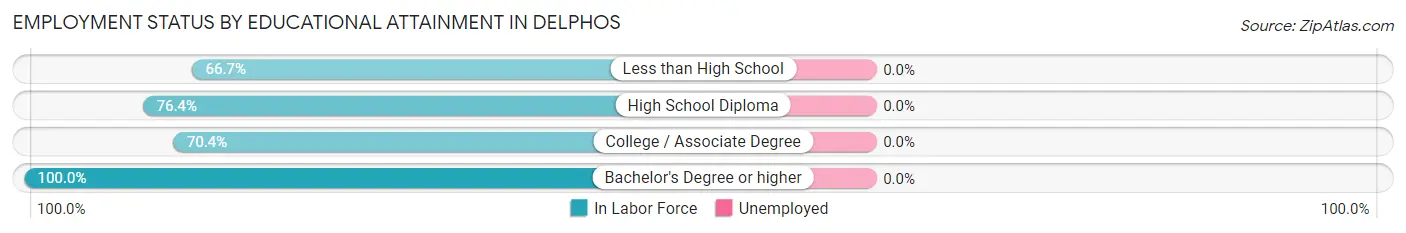
| Educational Attainment | In Labor Force | Unemployed |
| Less than High School | 4 (66.7%) | 0 (0.0%) |
| High School Diploma | 42 (76.4%) | 0 (0.0%) |
| College / Associate Degree | 38 (70.4%) | 0 (0.0%) |
| Bachelor's Degree or higher | 26 (100.0%) | 0 (0.0%) |
| Total | 110 (78.0%) | 0 (0.0%) |
Employment Occupations by Sex in Delphos
Management, Business, Science and Arts Occupations
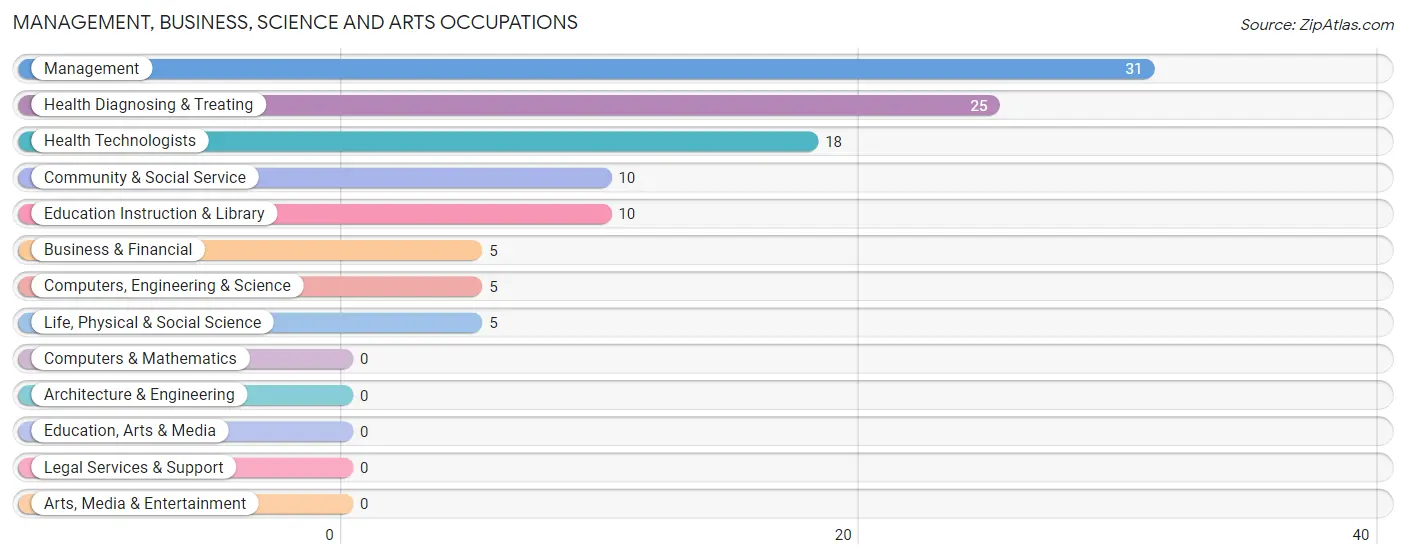
The most common Management, Business, Science and Arts occupations in Delphos are Management (31 | 20.1%), Health Diagnosing & Treating (25 | 16.2%), Health Technologists (18 | 11.7%), Community & Social Service (10 | 6.5%), and Education Instruction & Library (10 | 6.5%).
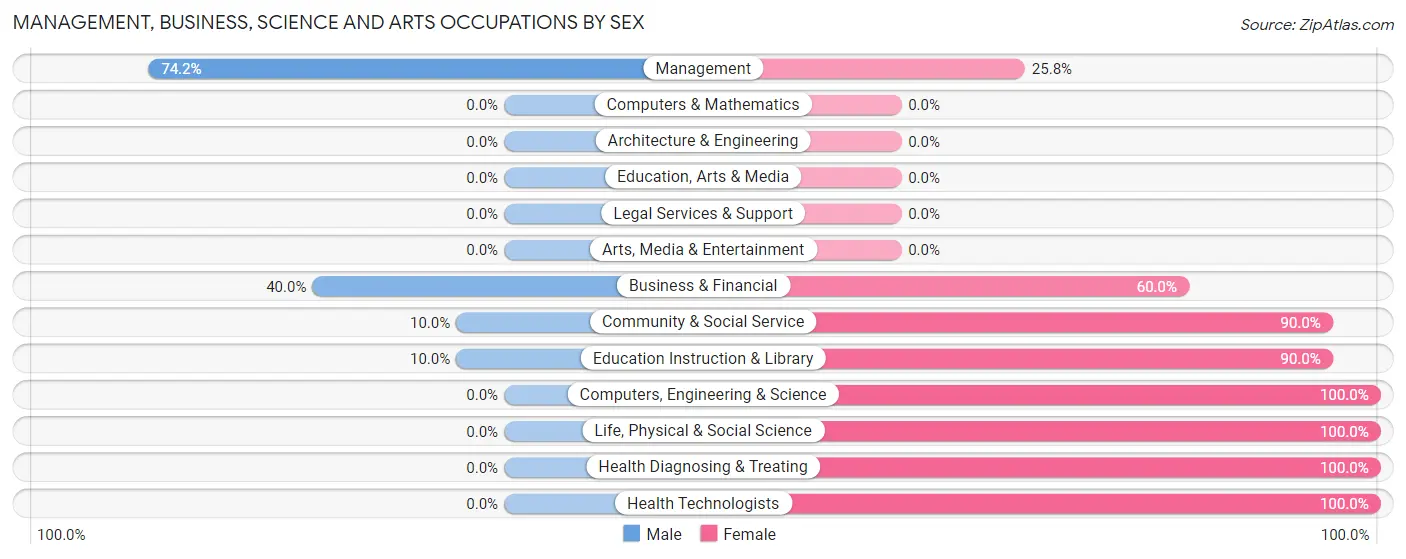
Management, Business, Science and Arts Occupations by Sex
Within the Management, Business, Science and Arts occupations in Delphos, the most male-oriented occupations are Management (74.2%), Business & Financial (40.0%), and Community & Social Service (10.0%), while the most female-oriented occupations are Computers, Engineering & Science (100.0%), Life, Physical & Social Science (100.0%), and Health Diagnosing & Treating (100.0%).
| Occupation | Male | Female |
| Management | 23 (74.2%) | 8 (25.8%) |
| Business & Financial | 2 (40.0%) | 3 (60.0%) |
| Computers, Engineering & Science | 0 (0.0%) | 5 (100.0%) |
| Computers & Mathematics | 0 (0.0%) | 0 (0.0%) |
| Architecture & Engineering | 0 (0.0%) | 0 (0.0%) |
| Life, Physical & Social Science | 0 (0.0%) | 5 (100.0%) |
| Community & Social Service | 1 (10.0%) | 9 (90.0%) |
| Education, Arts & Media | 0 (0.0%) | 0 (0.0%) |
| Legal Services & Support | 0 (0.0%) | 0 (0.0%) |
| Education Instruction & Library | 1 (10.0%) | 9 (90.0%) |
| Arts, Media & Entertainment | 0 (0.0%) | 0 (0.0%) |
| Health Diagnosing & Treating | 0 (0.0%) | 25 (100.0%) |
| Health Technologists | 0 (0.0%) | 18 (100.0%) |
| Total (Category) | 26 (34.2%) | 50 (65.8%) |
| Total (Overall) | 74 (48.0%) | 80 (51.9%) |
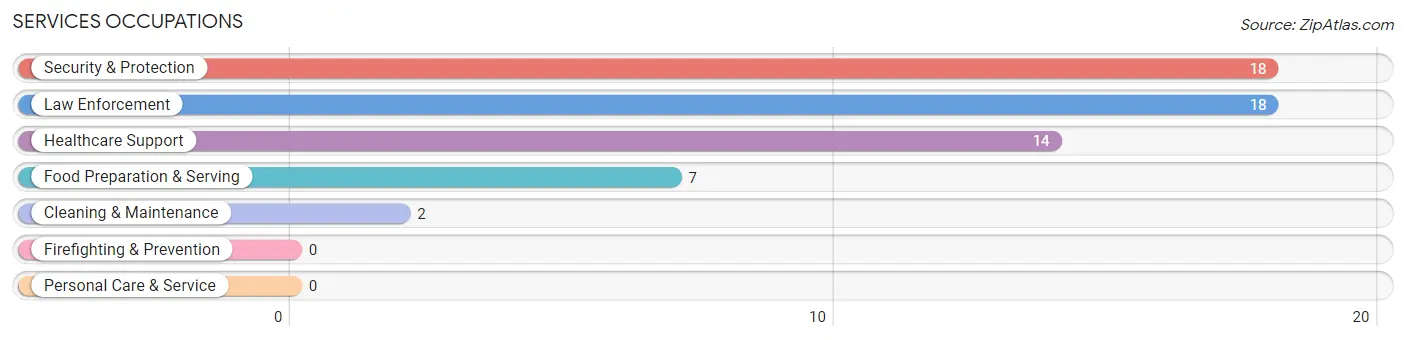
Services Occupations
The most common Services occupations in Delphos are Security & Protection (18 | 11.7%), Law Enforcement (18 | 11.7%), Healthcare Support (14 | 9.1%), Food Preparation & Serving (7 | 4.5%), and Cleaning & Maintenance (2 | 1.3%).
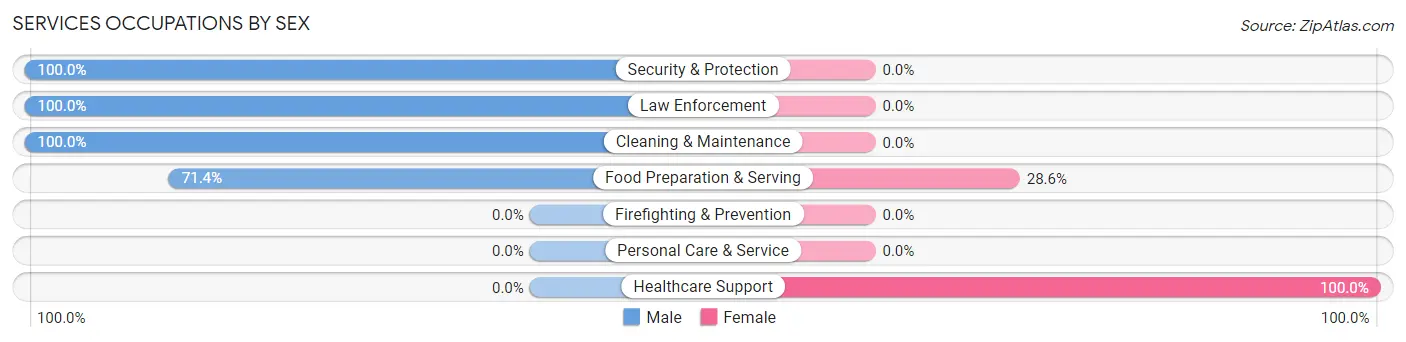
Services Occupations by Sex
Within the Services occupations in Delphos, the most male-oriented occupations are Security & Protection (100.0%), Law Enforcement (100.0%), and Cleaning & Maintenance (100.0%), while the most female-oriented occupations are Healthcare Support (100.0%), and Food Preparation & Serving (28.6%).
| Occupation | Male | Female |
| Healthcare Support | 0 (0.0%) | 14 (100.0%) |
| Security & Protection | 18 (100.0%) | 0 (0.0%) |
| Firefighting & Prevention | 0 (0.0%) | 0 (0.0%) |
| Law Enforcement | 18 (100.0%) | 0 (0.0%) |
| Food Preparation & Serving | 5 (71.4%) | 2 (28.6%) |
| Cleaning & Maintenance | 2 (100.0%) | 0 (0.0%) |
| Personal Care & Service | 0 (0.0%) | 0 (0.0%) |
| Total (Category) | 25 (61.0%) | 16 (39.0%) |
| Total (Overall) | 74 (48.0%) | 80 (51.9%) |
Sales and Office Occupations
The most common Sales and Office occupations in Delphos are Office & Administration (4 | 2.6%), and Sales & Related (1 | 0.6%).
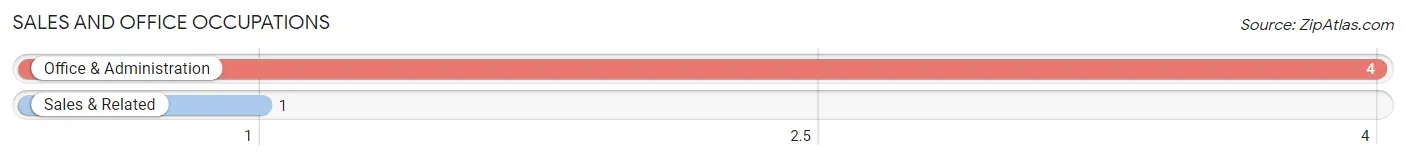
Sales and Office Occupations by Sex
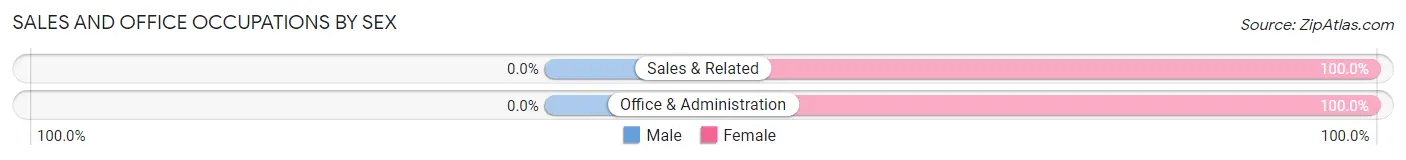
| Occupation | Male | Female |
| Sales & Related | 0 (0.0%) | 1 (100.0%) |
| Office & Administration | 0 (0.0%) | 4 (100.0%) |
| Total (Category) | 0 (0.0%) | 5 (100.0%) |
| Total (Overall) | 74 (48.0%) | 80 (51.9%) |
Natural Resources, Construction and Maintenance Occupations

Natural Resources, Construction and Maintenance Occupations by Sex
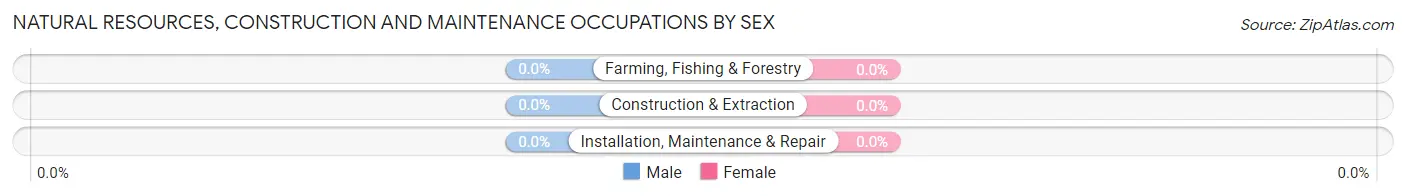
| Occupation | Male | Female |
| Farming, Fishing & Forestry | 0 (0.0%) | 0 (0.0%) |
| Construction & Extraction | 0 (0.0%) | 0 (0.0%) |
| Installation, Maintenance & Repair | 0 (0.0%) | 0 (0.0%) |
| Total (Category) | 0 (0.0%) | 0 (0.0%) |
| Total (Overall) | 74 (48.0%) | 80 (51.9%) |
Production, Transportation and Moving Occupations
The most common Production, Transportation and Moving occupations in Delphos are Transportation (16 | 10.4%), Production (15 | 9.7%), and Material Moving (1 | 0.6%).
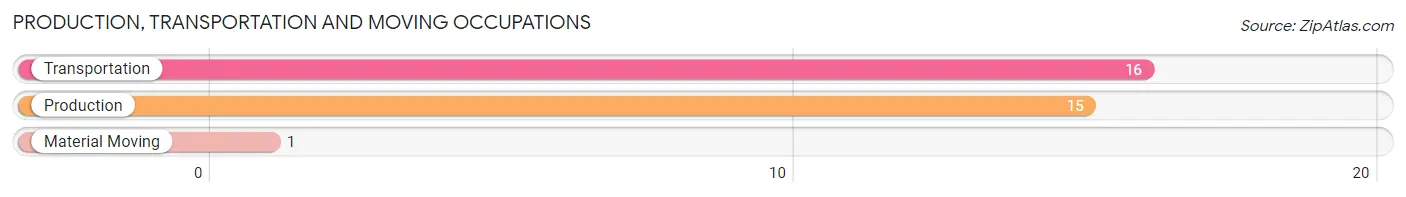
Production, Transportation and Moving Occupations by Sex
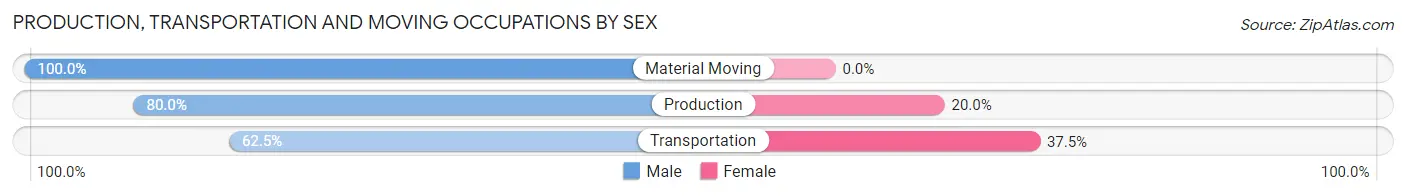
| Occupation | Male | Female |
| Production | 12 (80.0%) | 3 (20.0%) |
| Transportation | 10 (62.5%) | 6 (37.5%) |
| Material Moving | 1 (100.0%) | 0 (0.0%) |
| Total (Category) | 23 (71.9%) | 9 (28.1%) |
| Total (Overall) | 74 (48.0%) | 80 (51.9%) |
Employment Industries by Sex in Delphos
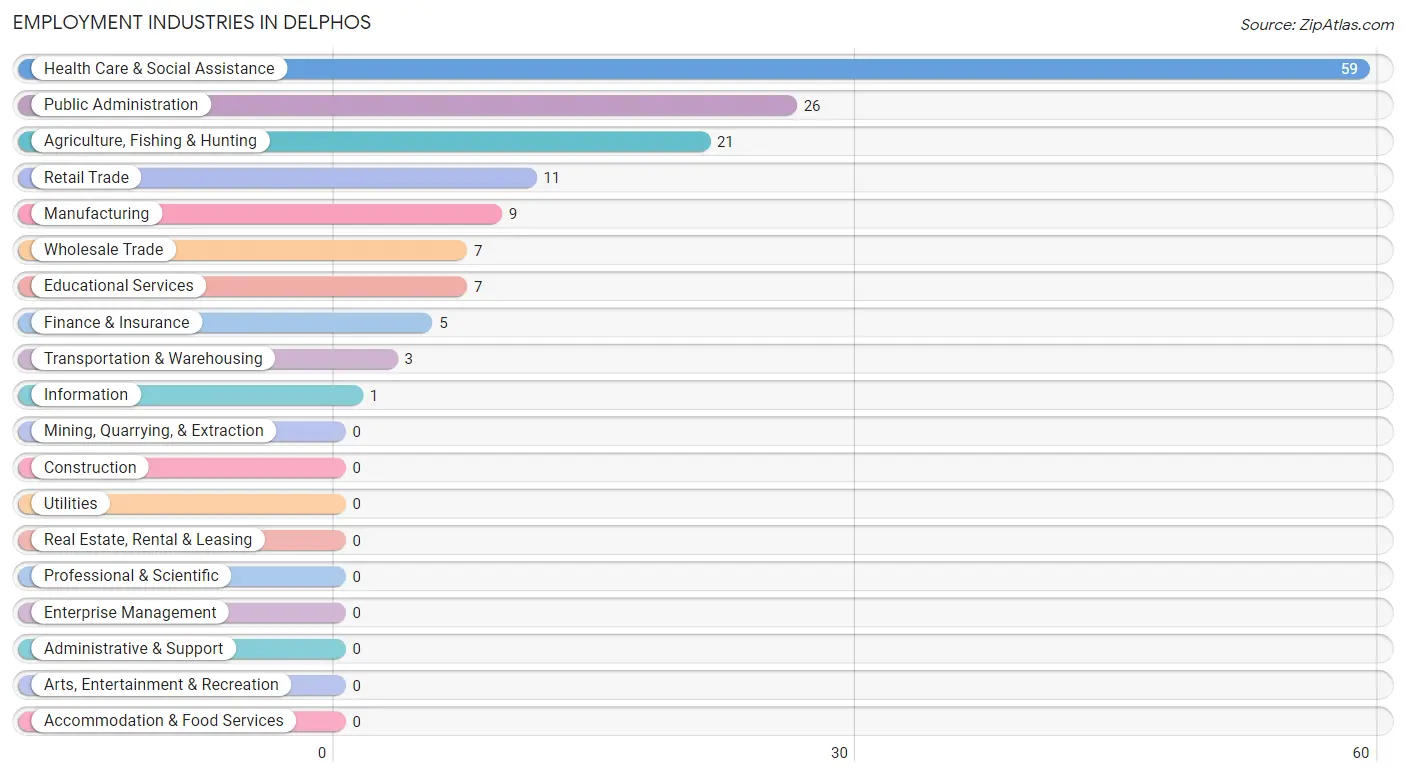
Employment Industries in Delphos
The major employment industries in Delphos include Health Care & Social Assistance (59 | 38.3%), Public Administration (26 | 16.9%), Agriculture, Fishing & Hunting (21 | 13.6%), Retail Trade (11 | 7.1%), and Manufacturing (9 | 5.8%).
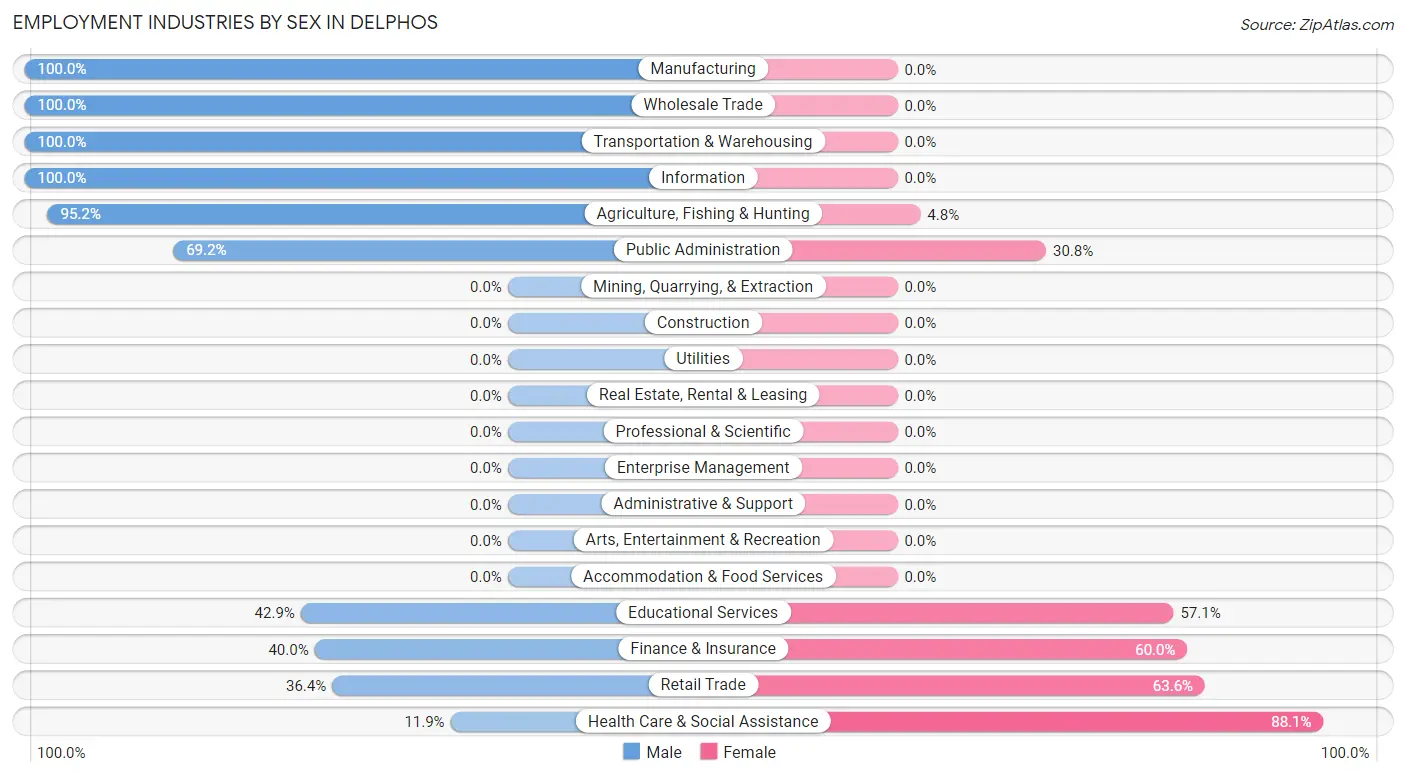
Employment Industries by Sex in Delphos
The Delphos industries that see more men than women are Manufacturing (100.0%), Wholesale Trade (100.0%), and Transportation & Warehousing (100.0%), whereas the industries that tend to have a higher number of women are Health Care & Social Assistance (88.1%), Retail Trade (63.6%), and Finance & Insurance (60.0%).
| Industry | Male | Female |
| Agriculture, Fishing & Hunting | 20 (95.2%) | 1 (4.8%) |
| Mining, Quarrying, & Extraction | 0 (0.0%) | 0 (0.0%) |
| Construction | 0 (0.0%) | 0 (0.0%) |
| Manufacturing | 9 (100.0%) | 0 (0.0%) |
| Wholesale Trade | 7 (100.0%) | 0 (0.0%) |
| Retail Trade | 4 (36.4%) | 7 (63.6%) |
| Transportation & Warehousing | 3 (100.0%) | 0 (0.0%) |
| Utilities | 0 (0.0%) | 0 (0.0%) |
| Information | 1 (100.0%) | 0 (0.0%) |
| Finance & Insurance | 2 (40.0%) | 3 (60.0%) |
| Real Estate, Rental & Leasing | 0 (0.0%) | 0 (0.0%) |
| Professional & Scientific | 0 (0.0%) | 0 (0.0%) |
| Enterprise Management | 0 (0.0%) | 0 (0.0%) |
| Administrative & Support | 0 (0.0%) | 0 (0.0%) |
| Educational Services | 3 (42.9%) | 4 (57.1%) |
| Health Care & Social Assistance | 7 (11.9%) | 52 (88.1%) |
| Arts, Entertainment & Recreation | 0 (0.0%) | 0 (0.0%) |
| Accommodation & Food Services | 0 (0.0%) | 0 (0.0%) |
| Public Administration | 18 (69.2%) | 8 (30.8%) |
| Total | 74 (48.0%) | 80 (51.9%) |
Education in Delphos
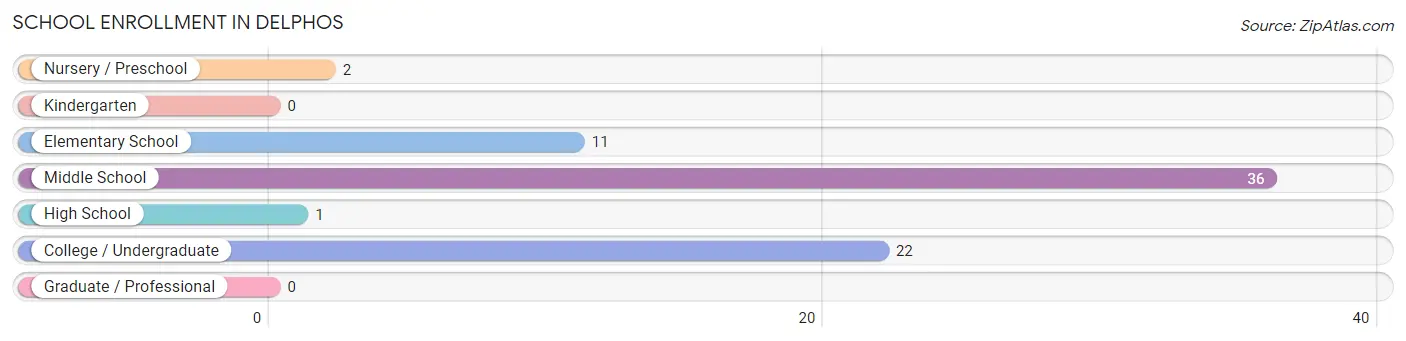
School Enrollment in Delphos
The most common levels of schooling among the 72 students in Delphos are middle school (36 | 50.0%), college / undergraduate (22 | 30.6%), and elementary school (11 | 15.3%).
| School Level | # Students | % Students |
| Nursery / Preschool | 2 | 2.8% |
| Kindergarten | 0 | 0.0% |
| Elementary School | 11 | 15.3% |
| Middle School | 36 | 50.0% |
| High School | 1 | 1.4% |
| College / Undergraduate | 22 | 30.6% |
| Graduate / Professional | 0 | 0.0% |
| Total | 72 | 100.0% |
School Enrollment by Age by Funding Source in Delphos
Out of a total of 72 students who are enrolled in schools in Delphos, 2 (2.8%) attend a private institution, while the remaining 70 (97.2%) are enrolled in public schools. The age group of 5 to 9 year old has the highest likelihood of being enrolled in private schools, with 2 (15.4% in the age bracket) enrolled. Conversely, the age group of 10 to 14 year olds has the lowest likelihood of being enrolled in a private school, with 36 (100.0% in the age bracket) attending a public institution.
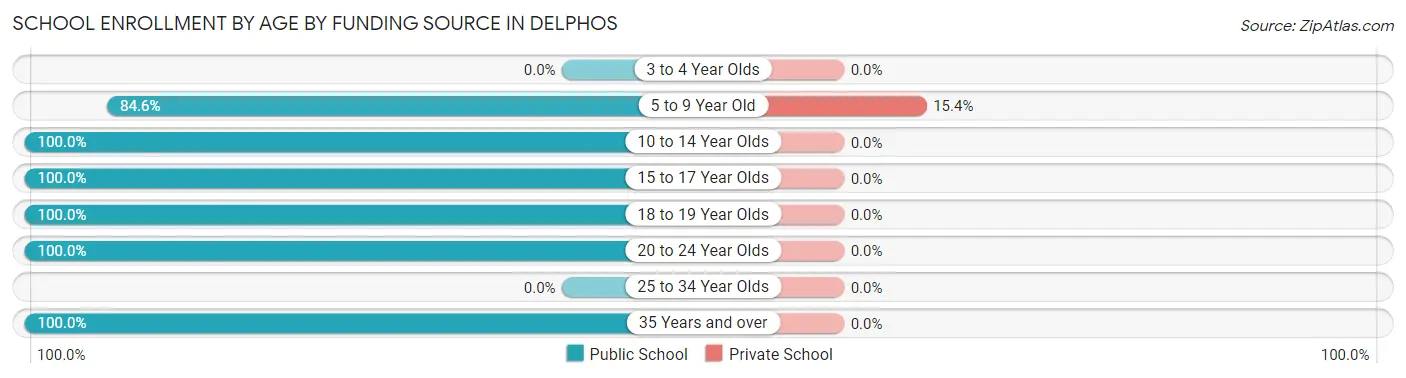
| Age Bracket | Public School | Private School |
| 3 to 4 Year Olds | 0 (0.0%) | 0 (0.0%) |
| 5 to 9 Year Old | 11 (84.6%) | 2 (15.4%) |
| 10 to 14 Year Olds | 36 (100.0%) | 0 (0.0%) |
| 15 to 17 Year Olds | 1 (100.0%) | 0 (0.0%) |
| 18 to 19 Year Olds | 6 (100.0%) | 0 (0.0%) |
| 20 to 24 Year Olds | 11 (100.0%) | 0 (0.0%) |
| 25 to 34 Year Olds | 0 (0.0%) | 0 (0.0%) |
| 35 Years and over | 5 (100.0%) | 0 (0.0%) |
| Total | 70 (97.2%) | 2 (2.8%) |
Educational Attainment by Field of Study in Delphos
Science & technology (11 | 32.4%), education (7 | 20.6%), bio, nature & agricultural (5 | 14.7%), business (5 | 14.7%), and physical & health sciences (3 | 8.8%) are the most common fields of study among 34 individuals in Delphos who have obtained a bachelor's degree or higher.
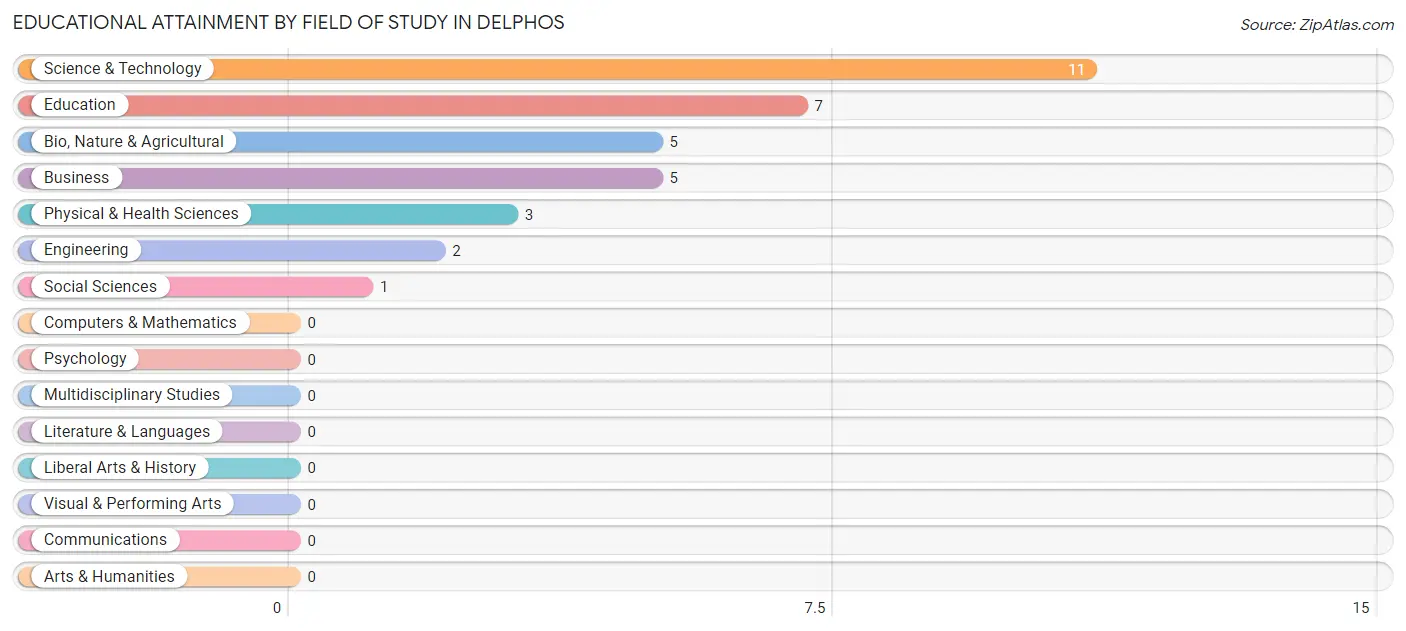
| Field of Study | # Graduates | % Graduates |
| Computers & Mathematics | 0 | 0.0% |
| Bio, Nature & Agricultural | 5 | 14.7% |
| Physical & Health Sciences | 3 | 8.8% |
| Psychology | 0 | 0.0% |
| Social Sciences | 1 | 2.9% |
| Engineering | 2 | 5.9% |
| Multidisciplinary Studies | 0 | 0.0% |
| Science & Technology | 11 | 32.4% |
| Business | 5 | 14.7% |
| Education | 7 | 20.6% |
| Literature & Languages | 0 | 0.0% |
| Liberal Arts & History | 0 | 0.0% |
| Visual & Performing Arts | 0 | 0.0% |
| Communications | 0 | 0.0% |
| Arts & Humanities | 0 | 0.0% |
| Total | 34 | 100.0% |
Transportation & Commute in Delphos
Vehicle Availability by Sex in Delphos
The most prevalent vehicle ownership categories in Delphos are males with 1 vehicle (25, accounting for 33.8%) and females with 1 vehicle (15, making up 31.7%).
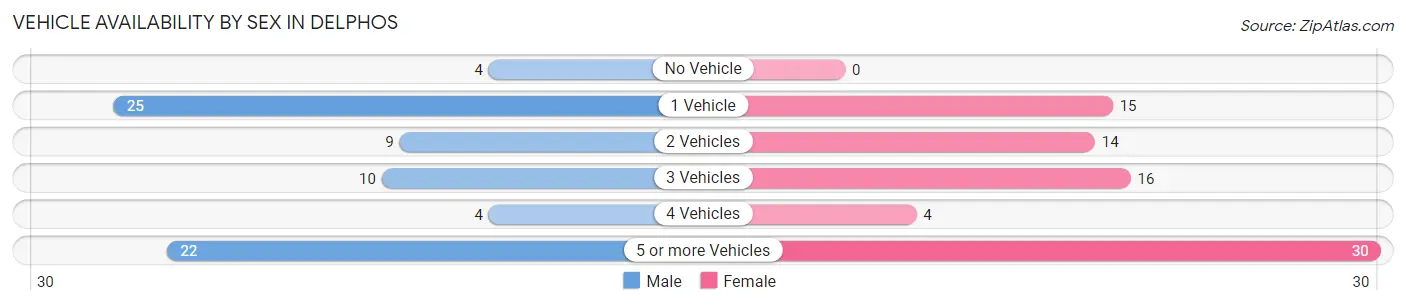
| Vehicles Available | Male | Female |
| No Vehicle | 4 (5.4%) | 0 (0.0%) |
| 1 Vehicle | 25 (33.8%) | 15 (19.0%) |
| 2 Vehicles | 9 (12.2%) | 14 (17.7%) |
| 3 Vehicles | 10 (13.5%) | 16 (20.3%) |
| 4 Vehicles | 4 (5.4%) | 4 (5.1%) |
| 5 or more Vehicles | 22 (29.7%) | 30 (38.0%) |
| Total | 74 (100.0%) | 79 (100.0%) |
Commute Time in Delphos
The most frequently occuring commute durations in Delphos are 20 to 24 minutes (55 commuters, 37.4%), 40 to 44 minutes (19 commuters, 12.9%), and 15 to 19 minutes (15 commuters, 10.2%).
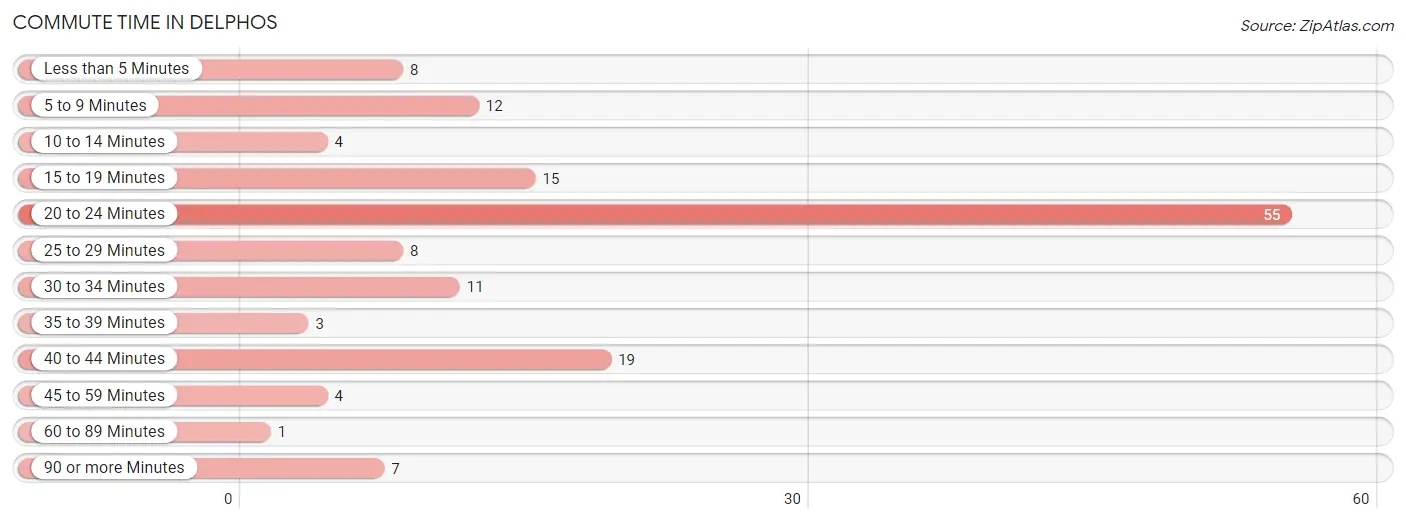
| Commute Time | # Commuters | % Commuters |
| Less than 5 Minutes | 8 | 5.4% |
| 5 to 9 Minutes | 12 | 8.2% |
| 10 to 14 Minutes | 4 | 2.7% |
| 15 to 19 Minutes | 15 | 10.2% |
| 20 to 24 Minutes | 55 | 37.4% |
| 25 to 29 Minutes | 8 | 5.4% |
| 30 to 34 Minutes | 11 | 7.5% |
| 35 to 39 Minutes | 3 | 2.0% |
| 40 to 44 Minutes | 19 | 12.9% |
| 45 to 59 Minutes | 4 | 2.7% |
| 60 to 89 Minutes | 1 | 0.7% |
| 90 or more Minutes | 7 | 4.8% |
Commute Time by Sex in Delphos
The most common commute times in Delphos are 20 to 24 minutes (23 commuters, 31.1%) for males and 20 to 24 minutes (32 commuters, 43.8%) for females.
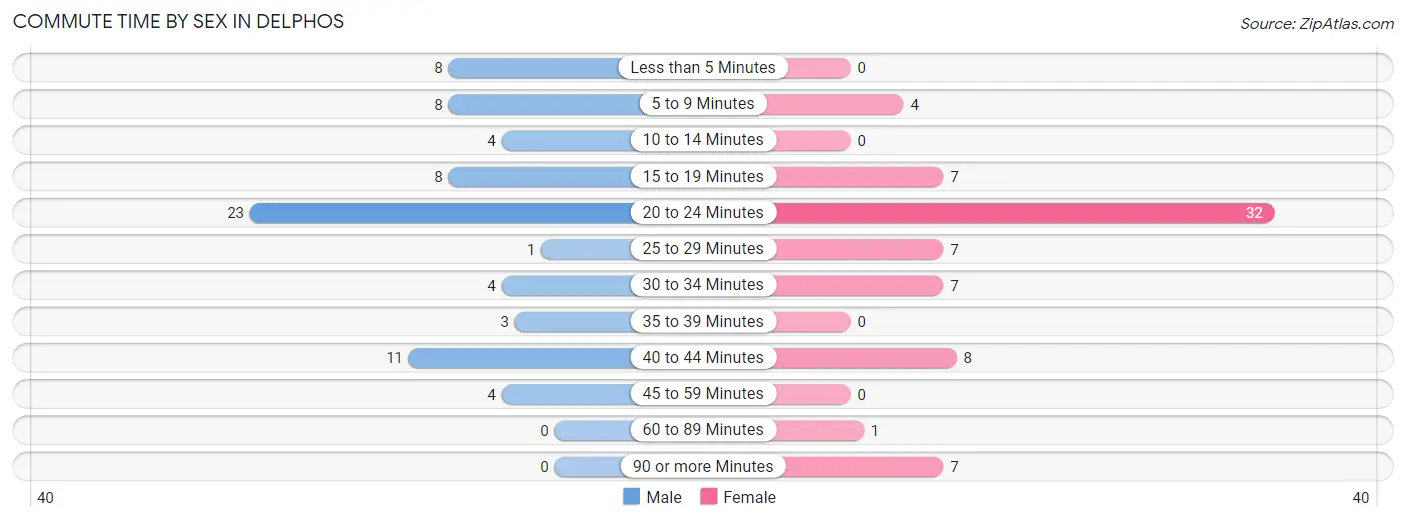
| Commute Time | Male | Female |
| Less than 5 Minutes | 8 (10.8%) | 0 (0.0%) |
| 5 to 9 Minutes | 8 (10.8%) | 4 (5.5%) |
| 10 to 14 Minutes | 4 (5.4%) | 0 (0.0%) |
| 15 to 19 Minutes | 8 (10.8%) | 7 (9.6%) |
| 20 to 24 Minutes | 23 (31.1%) | 32 (43.8%) |
| 25 to 29 Minutes | 1 (1.3%) | 7 (9.6%) |
| 30 to 34 Minutes | 4 (5.4%) | 7 (9.6%) |
| 35 to 39 Minutes | 3 (4.1%) | 0 (0.0%) |
| 40 to 44 Minutes | 11 (14.9%) | 8 (11.0%) |
| 45 to 59 Minutes | 4 (5.4%) | 0 (0.0%) |
| 60 to 89 Minutes | 0 (0.0%) | 1 (1.4%) |
| 90 or more Minutes | 0 (0.0%) | 7 (9.6%) |
Time of Departure to Work by Sex in Delphos
The most frequent times of departure to work in Delphos are 4:00 PM to 11:59 PM (18, 24.3%) for males and 4:00 PM to 11:59 PM (28, 38.4%) for females.
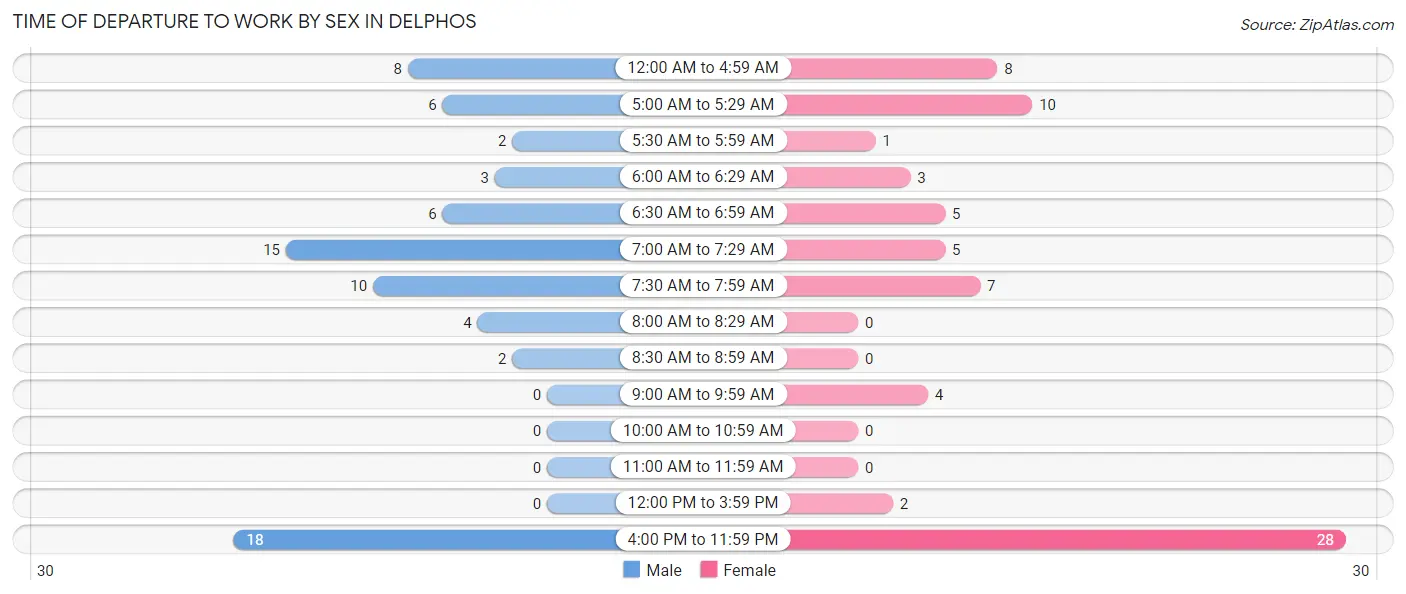
| Time of Departure | Male | Female |
| 12:00 AM to 4:59 AM | 8 (10.8%) | 8 (11.0%) |
| 5:00 AM to 5:29 AM | 6 (8.1%) | 10 (13.7%) |
| 5:30 AM to 5:59 AM | 2 (2.7%) | 1 (1.4%) |
| 6:00 AM to 6:29 AM | 3 (4.1%) | 3 (4.1%) |
| 6:30 AM to 6:59 AM | 6 (8.1%) | 5 (6.9%) |
| 7:00 AM to 7:29 AM | 15 (20.3%) | 5 (6.9%) |
| 7:30 AM to 7:59 AM | 10 (13.5%) | 7 (9.6%) |
| 8:00 AM to 8:29 AM | 4 (5.4%) | 0 (0.0%) |
| 8:30 AM to 8:59 AM | 2 (2.7%) | 0 (0.0%) |
| 9:00 AM to 9:59 AM | 0 (0.0%) | 4 (5.5%) |
| 10:00 AM to 10:59 AM | 0 (0.0%) | 0 (0.0%) |
| 11:00 AM to 11:59 AM | 0 (0.0%) | 0 (0.0%) |
| 12:00 PM to 3:59 PM | 0 (0.0%) | 2 (2.7%) |
| 4:00 PM to 11:59 PM | 18 (24.3%) | 28 (38.4%) |
| Total | 74 (100.0%) | 73 (100.0%) |
Housing Occupancy in Delphos
Occupancy by Ownership in Delphos
Of the total 165 dwellings in Delphos, owner-occupied units account for 115 (69.7%), while renter-occupied units make up 50 (30.3%).
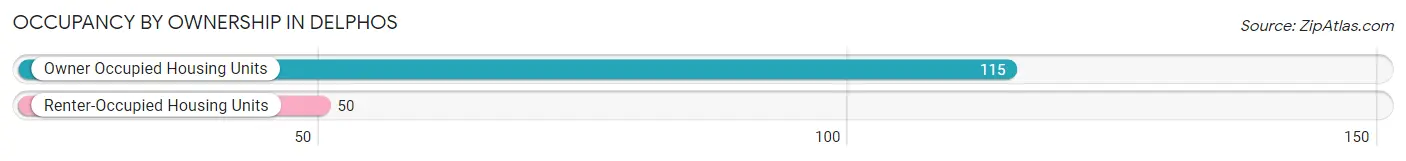
| Occupancy | # Housing Units | % Housing Units |
| Owner Occupied Housing Units | 115 | 69.7% |
| Renter-Occupied Housing Units | 50 | 30.3% |
| Total Occupied Housing Units | 165 | 100.0% |
Occupancy by Household Size in Delphos
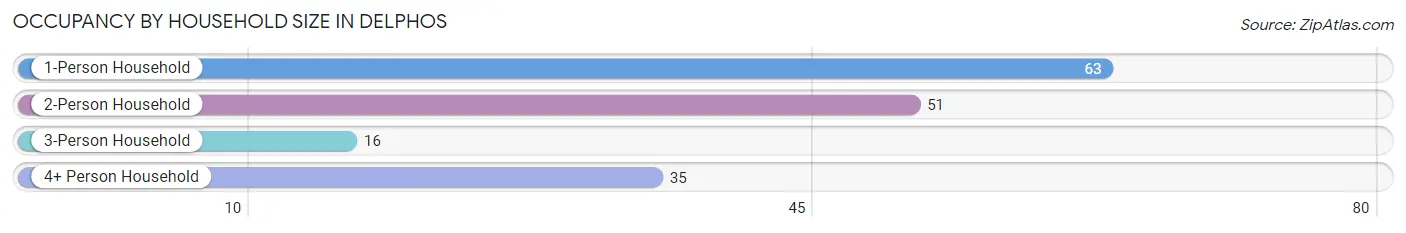
| Household Size | # Housing Units | % Housing Units |
| 1-Person Household | 63 | 38.2% |
| 2-Person Household | 51 | 30.9% |
| 3-Person Household | 16 | 9.7% |
| 4+ Person Household | 35 | 21.2% |
| Total Housing Units | 165 | 100.0% |
Occupancy by Ownership by Household Size in Delphos
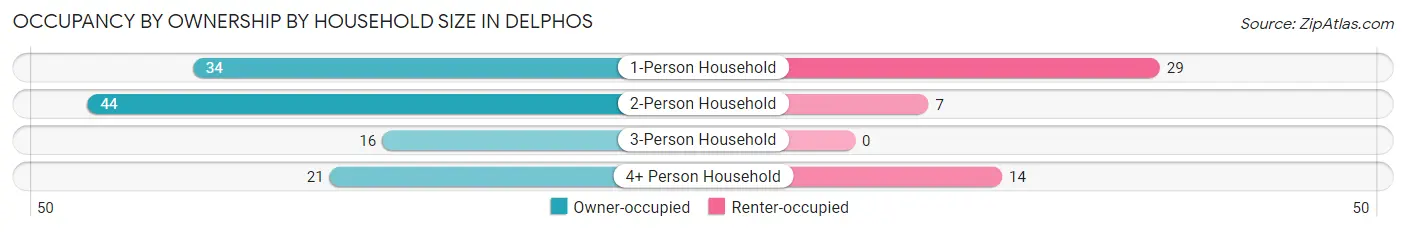
| Household Size | Owner-occupied | Renter-occupied |
| 1-Person Household | 34 (54.0%) | 29 (46.0%) |
| 2-Person Household | 44 (86.3%) | 7 (13.7%) |
| 3-Person Household | 16 (100.0%) | 0 (0.0%) |
| 4+ Person Household | 21 (60.0%) | 14 (40.0%) |
| Total Housing Units | 115 (69.7%) | 50 (30.3%) |
Occupancy by Educational Attainment in Delphos
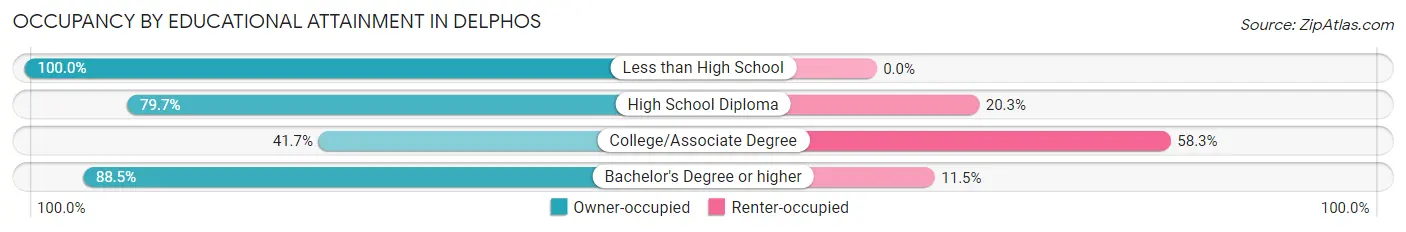
| Household Size | Owner-occupied | Renter-occupied |
| Less than High School | 20 (100.0%) | 0 (0.0%) |
| High School Diploma | 47 (79.7%) | 12 (20.3%) |
| College/Associate Degree | 25 (41.7%) | 35 (58.3%) |
| Bachelor's Degree or higher | 23 (88.5%) | 3 (11.5%) |
Occupancy by Age of Householder in Delphos
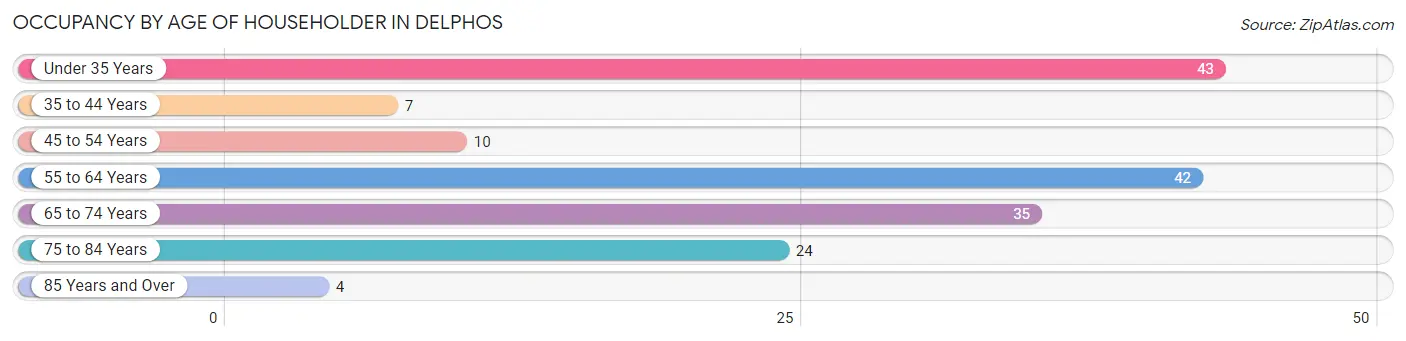
| Age Bracket | # Households | % Households |
| Under 35 Years | 43 | 26.1% |
| 35 to 44 Years | 7 | 4.2% |
| 45 to 54 Years | 10 | 6.1% |
| 55 to 64 Years | 42 | 25.5% |
| 65 to 74 Years | 35 | 21.2% |
| 75 to 84 Years | 24 | 14.5% |
| 85 Years and Over | 4 | 2.4% |
| Total | 165 | 100.0% |
Housing Finances in Delphos
Median Income by Occupancy in Delphos
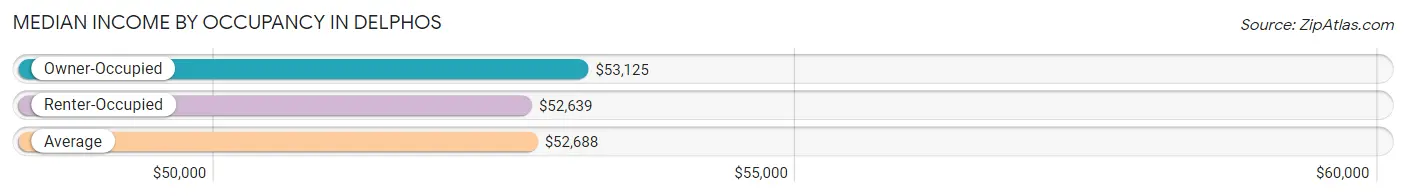
| Occupancy Type | # Households | Median Income |
| Owner-Occupied | 115 (69.7%) | $53,125 |
| Renter-Occupied | 50 (30.3%) | $52,639 |
| Average | 165 (100.0%) | $52,688 |
Occupancy by Householder Income Bracket in Delphos
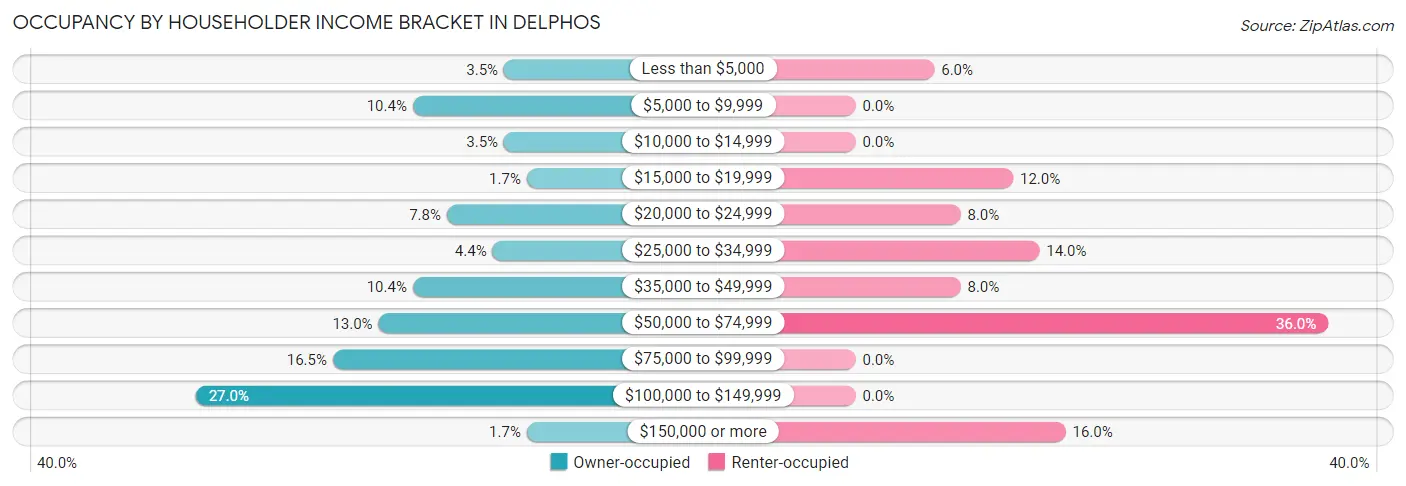
| Income Bracket | Owner-occupied | Renter-occupied |
| Less than $5,000 | 4 (3.5%) | 3 (6.0%) |
| $5,000 to $9,999 | 12 (10.4%) | 0 (0.0%) |
| $10,000 to $14,999 | 4 (3.5%) | 0 (0.0%) |
| $15,000 to $19,999 | 2 (1.7%) | 6 (12.0%) |
| $20,000 to $24,999 | 9 (7.8%) | 4 (8.0%) |
| $25,000 to $34,999 | 5 (4.3%) | 7 (14.0%) |
| $35,000 to $49,999 | 12 (10.4%) | 4 (8.0%) |
| $50,000 to $74,999 | 15 (13.0%) | 18 (36.0%) |
| $75,000 to $99,999 | 19 (16.5%) | 0 (0.0%) |
| $100,000 to $149,999 | 31 (27.0%) | 0 (0.0%) |
| $150,000 or more | 2 (1.7%) | 8 (16.0%) |
| Total | 115 (100.0%) | 50 (100.0%) |
Monthly Housing Cost Tiers in Delphos
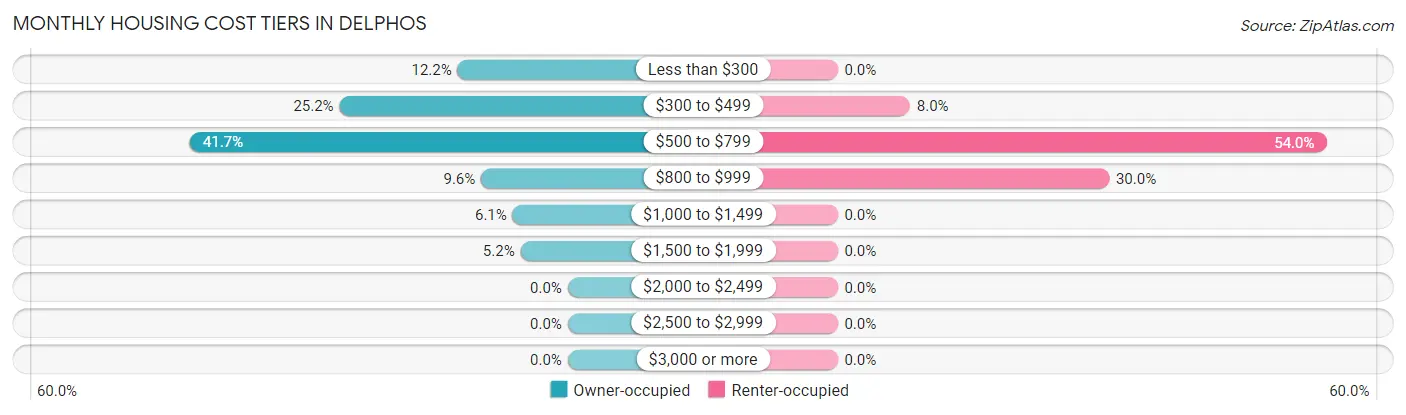
| Monthly Cost | Owner-occupied | Renter-occupied |
| Less than $300 | 14 (12.2%) | 0 (0.0%) |
| $300 to $499 | 29 (25.2%) | 4 (8.0%) |
| $500 to $799 | 48 (41.7%) | 27 (54.0%) |
| $800 to $999 | 11 (9.6%) | 15 (30.0%) |
| $1,000 to $1,499 | 7 (6.1%) | 0 (0.0%) |
| $1,500 to $1,999 | 6 (5.2%) | 0 (0.0%) |
| $2,000 to $2,499 | 0 (0.0%) | 0 (0.0%) |
| $2,500 to $2,999 | 0 (0.0%) | 0 (0.0%) |
| $3,000 or more | 0 (0.0%) | 0 (0.0%) |
| Total | 115 (100.0%) | 50 (100.0%) |
Physical Housing Characteristics in Delphos
Housing Structures in Delphos
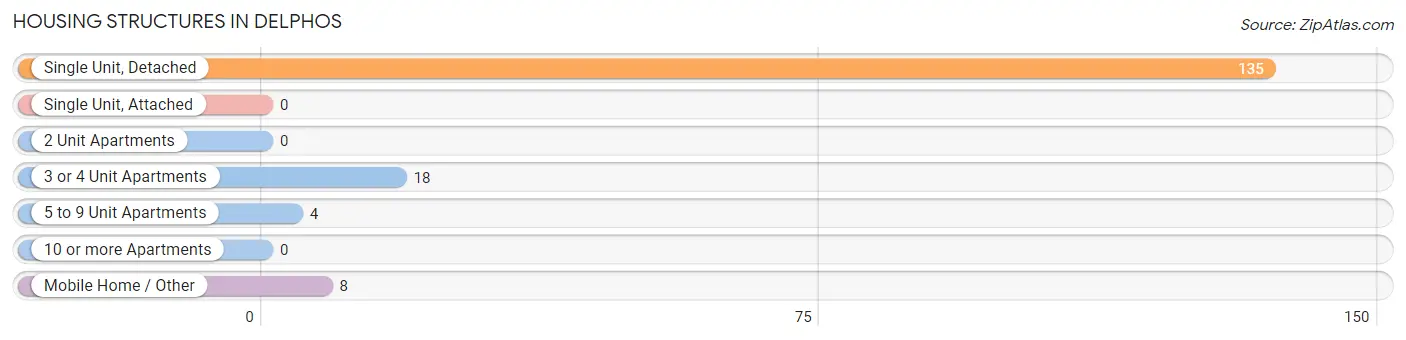
| Structure Type | # Housing Units | % Housing Units |
| Single Unit, Detached | 135 | 81.8% |
| Single Unit, Attached | 0 | 0.0% |
| 2 Unit Apartments | 0 | 0.0% |
| 3 or 4 Unit Apartments | 18 | 10.9% |
| 5 to 9 Unit Apartments | 4 | 2.4% |
| 10 or more Apartments | 0 | 0.0% |
| Mobile Home / Other | 8 | 4.9% |
| Total | 165 | 100.0% |
Housing Structures by Occupancy in Delphos
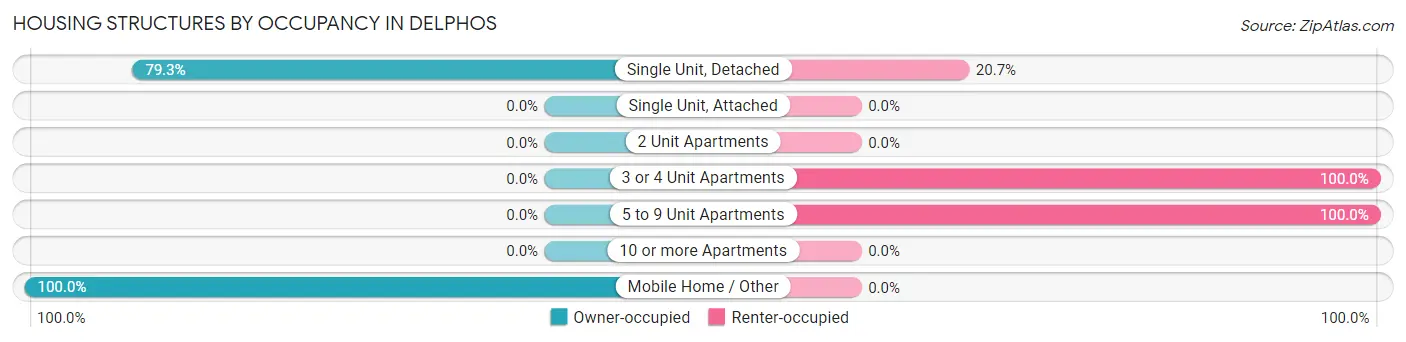
| Structure Type | Owner-occupied | Renter-occupied |
| Single Unit, Detached | 107 (79.3%) | 28 (20.7%) |
| Single Unit, Attached | 0 (0.0%) | 0 (0.0%) |
| 2 Unit Apartments | 0 (0.0%) | 0 (0.0%) |
| 3 or 4 Unit Apartments | 0 (0.0%) | 18 (100.0%) |
| 5 to 9 Unit Apartments | 0 (0.0%) | 4 (100.0%) |
| 10 or more Apartments | 0 (0.0%) | 0 (0.0%) |
| Mobile Home / Other | 8 (100.0%) | 0 (0.0%) |
| Total | 115 (69.7%) | 50 (30.3%) |
Housing Structures by Number of Rooms in Delphos
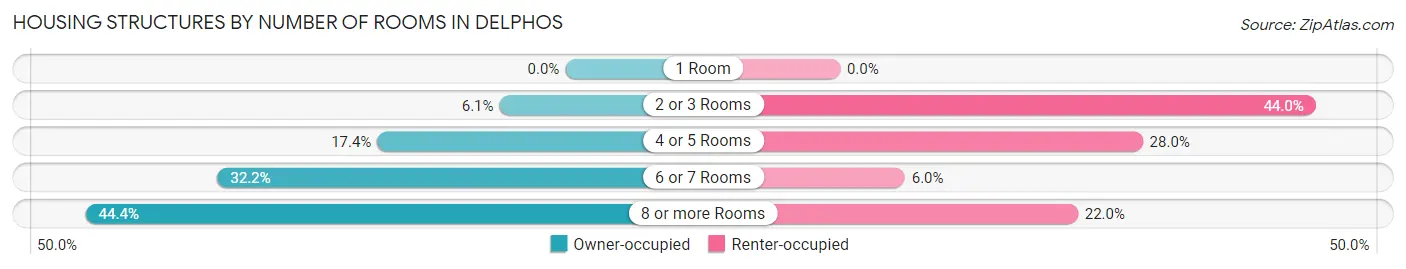
| Number of Rooms | Owner-occupied | Renter-occupied |
| 1 Room | 0 (0.0%) | 0 (0.0%) |
| 2 or 3 Rooms | 7 (6.1%) | 22 (44.0%) |
| 4 or 5 Rooms | 20 (17.4%) | 14 (28.0%) |
| 6 or 7 Rooms | 37 (32.2%) | 3 (6.0%) |
| 8 or more Rooms | 51 (44.4%) | 11 (22.0%) |
| Total | 115 (100.0%) | 50 (100.0%) |
Housing Structure by Heating Type in Delphos
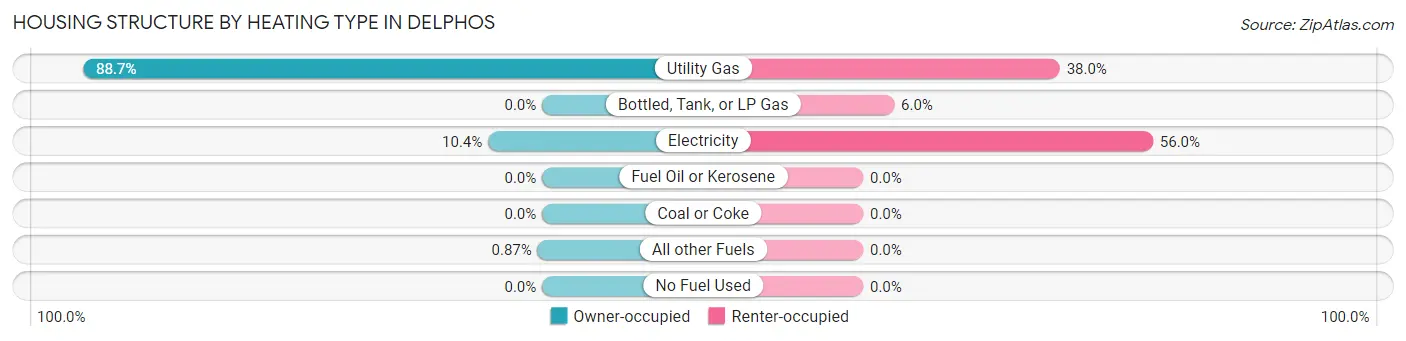
| Heating Type | Owner-occupied | Renter-occupied |
| Utility Gas | 102 (88.7%) | 19 (38.0%) |
| Bottled, Tank, or LP Gas | 0 (0.0%) | 3 (6.0%) |
| Electricity | 12 (10.4%) | 28 (56.0%) |
| Fuel Oil or Kerosene | 0 (0.0%) | 0 (0.0%) |
| Coal or Coke | 0 (0.0%) | 0 (0.0%) |
| All other Fuels | 1 (0.9%) | 0 (0.0%) |
| No Fuel Used | 0 (0.0%) | 0 (0.0%) |
| Total | 115 (100.0%) | 50 (100.0%) |
Household Vehicle Usage in Delphos
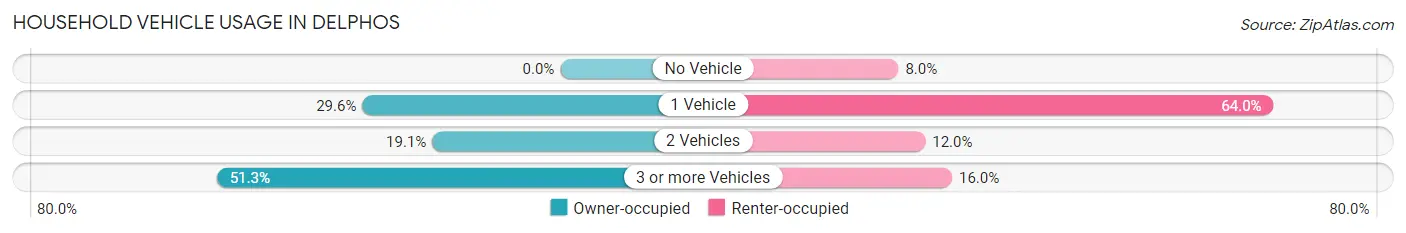
| Vehicles per Household | Owner-occupied | Renter-occupied |
| No Vehicle | 0 (0.0%) | 4 (8.0%) |
| 1 Vehicle | 34 (29.6%) | 32 (64.0%) |
| 2 Vehicles | 22 (19.1%) | 6 (12.0%) |
| 3 or more Vehicles | 59 (51.3%) | 8 (16.0%) |
| Total | 115 (100.0%) | 50 (100.0%) |
Real Estate & Mortgages in Delphos
Real Estate and Mortgage Overview in Delphos
| Characteristic | Without Mortgage | With Mortgage |
| Housing Units | 84 | 31 |
| Median Property Value | $47,700 | $45,600 |
| Median Household Income | $45,625 | $0 |
| Monthly Housing Costs | $495 | $0 |
| Real Estate Taxes | $986 | $0 |
Property Value by Mortgage Status in Delphos
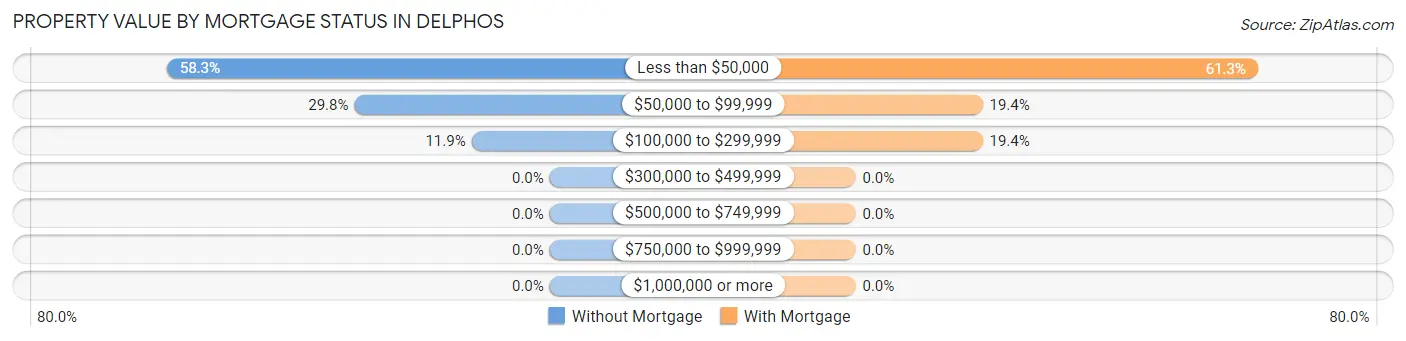
| Property Value | Without Mortgage | With Mortgage |
| Less than $50,000 | 49 (58.3%) | 19 (61.3%) |
| $50,000 to $99,999 | 25 (29.8%) | 6 (19.4%) |
| $100,000 to $299,999 | 10 (11.9%) | 6 (19.4%) |
| $300,000 to $499,999 | 0 (0.0%) | 0 (0.0%) |
| $500,000 to $749,999 | 0 (0.0%) | 0 (0.0%) |
| $750,000 to $999,999 | 0 (0.0%) | 0 (0.0%) |
| $1,000,000 or more | 0 (0.0%) | 0 (0.0%) |
| Total | 84 (100.0%) | 31 (100.0%) |
Household Income by Mortgage Status in Delphos
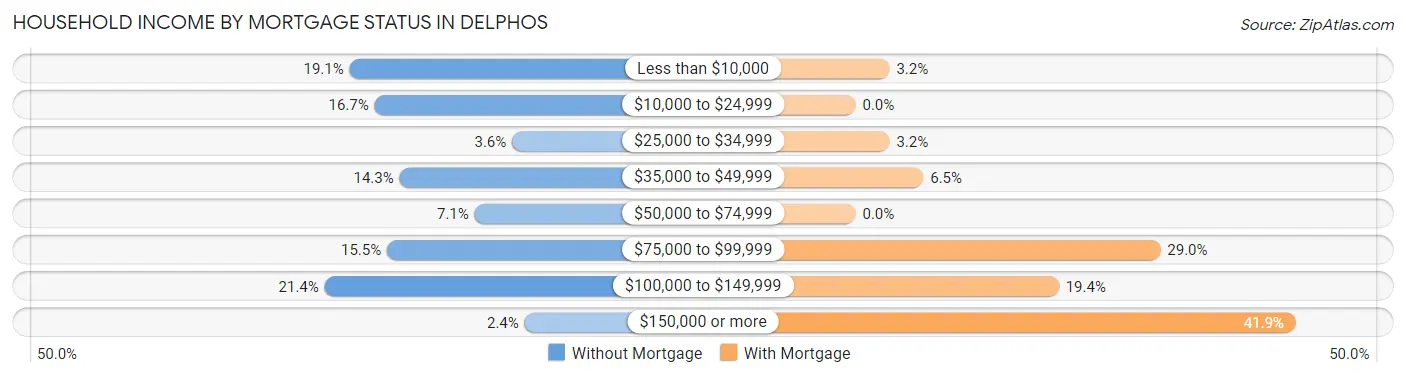
| Household Income | Without Mortgage | With Mortgage |
| Less than $10,000 | 16 (19.1%) | 1 (3.2%) |
| $10,000 to $24,999 | 14 (16.7%) | 0 (0.0%) |
| $25,000 to $34,999 | 3 (3.6%) | 1 (3.2%) |
| $35,000 to $49,999 | 12 (14.3%) | 2 (6.5%) |
| $50,000 to $74,999 | 6 (7.1%) | 0 (0.0%) |
| $75,000 to $99,999 | 13 (15.5%) | 9 (29.0%) |
| $100,000 to $149,999 | 18 (21.4%) | 6 (19.4%) |
| $150,000 or more | 2 (2.4%) | 13 (41.9%) |
| Total | 84 (100.0%) | 31 (100.0%) |
Property Value to Household Income Ratio in Delphos
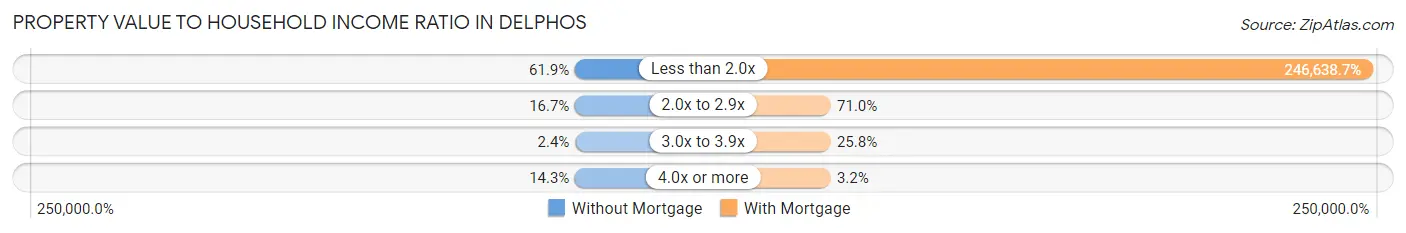
| Value-to-Income Ratio | Without Mortgage | With Mortgage |
| Less than 2.0x | 52 (61.9%) | 76,458 (246,638.7%) |
| 2.0x to 2.9x | 14 (16.7%) | 22 (71.0%) |
| 3.0x to 3.9x | 2 (2.4%) | 8 (25.8%) |
| 4.0x or more | 12 (14.3%) | 1 (3.2%) |
| Total | 84 (100.0%) | 31 (100.0%) |
Real Estate Taxes by Mortgage Status in Delphos
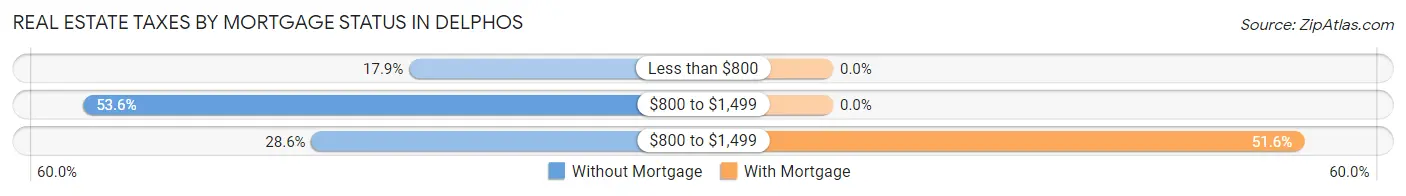
| Property Taxes | Without Mortgage | With Mortgage |
| Less than $800 | 15 (17.9%) | 0 (0.0%) |
| $800 to $1,499 | 45 (53.6%) | 0 (0.0%) |
| $800 to $1,499 | 24 (28.6%) | 16 (51.6%) |
| Total | 84 (100.0%) | 31 (100.0%) |
Health & Disability in Delphos
Health Insurance Coverage by Age in Delphos
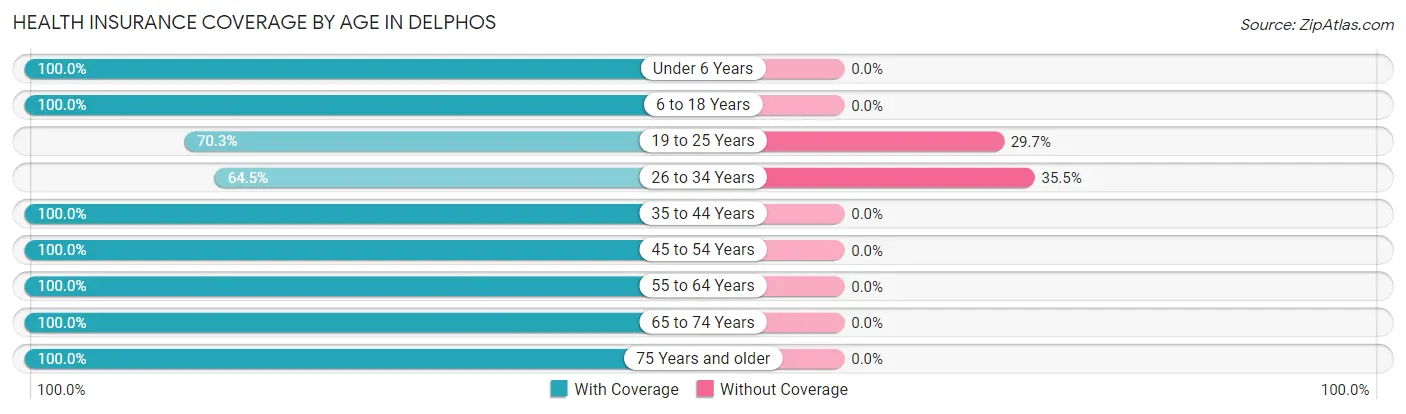
| Age Bracket | With Coverage | Without Coverage |
| Under 6 Years | 25 (100.0%) | 0 (0.0%) |
| 6 to 18 Years | 58 (100.0%) | 0 (0.0%) |
| 19 to 25 Years | 26 (70.3%) | 11 (29.7%) |
| 26 to 34 Years | 20 (64.5%) | 11 (35.5%) |
| 35 to 44 Years | 16 (100.0%) | 0 (0.0%) |
| 45 to 54 Years | 30 (100.0%) | 0 (0.0%) |
| 55 to 64 Years | 60 (100.0%) | 0 (0.0%) |
| 65 to 74 Years | 43 (100.0%) | 0 (0.0%) |
| 75 Years and older | 42 (100.0%) | 0 (0.0%) |
| Total | 320 (93.6%) | 22 (6.4%) |
Health Insurance Coverage by Citizenship Status in Delphos

| Citizenship Status | With Coverage | Without Coverage |
| Native Born | 25 (100.0%) | 0 (0.0%) |
| Foreign Born, Citizen | 58 (100.0%) | 0 (0.0%) |
| Foreign Born, not a Citizen | 26 (70.3%) | 11 (29.7%) |
Health Insurance Coverage by Household Income in Delphos
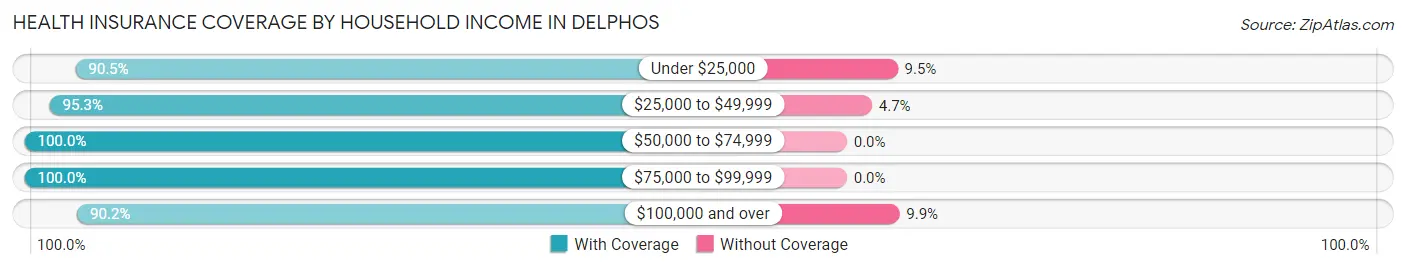
| Household Income | With Coverage | Without Coverage |
| Under $25,000 | 57 (90.5%) | 6 (9.5%) |
| $25,000 to $49,999 | 61 (95.3%) | 3 (4.7%) |
| $50,000 to $74,999 | 48 (100.0%) | 0 (0.0%) |
| $75,000 to $99,999 | 35 (100.0%) | 0 (0.0%) |
| $100,000 and over | 119 (90.1%) | 13 (9.9%) |
Public vs Private Health Insurance Coverage by Age in Delphos
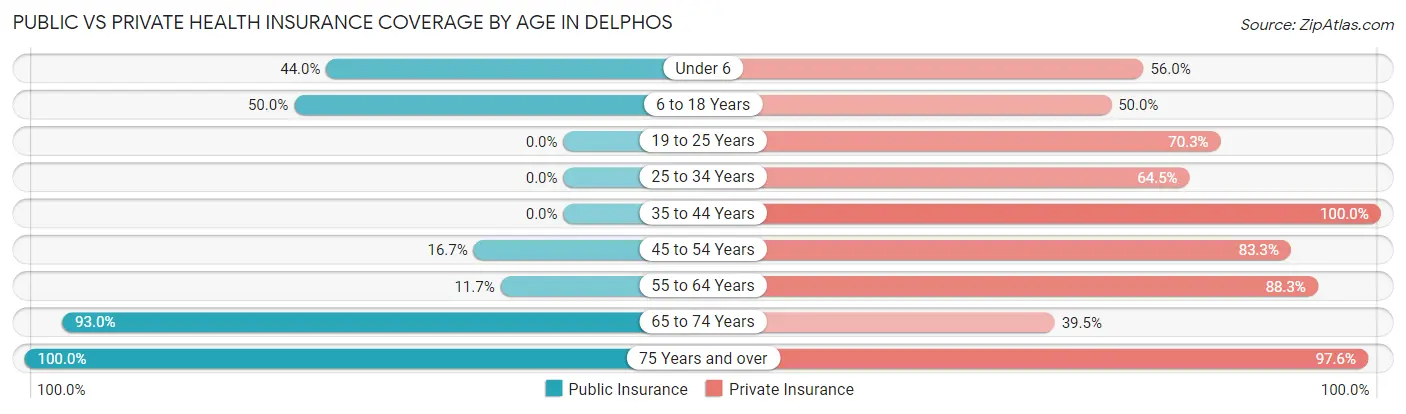
| Age Bracket | Public Insurance | Private Insurance |
| Under 6 | 11 (44.0%) | 14 (56.0%) |
| 6 to 18 Years | 29 (50.0%) | 29 (50.0%) |
| 19 to 25 Years | 0 (0.0%) | 26 (70.3%) |
| 25 to 34 Years | 0 (0.0%) | 20 (64.5%) |
| 35 to 44 Years | 0 (0.0%) | 16 (100.0%) |
| 45 to 54 Years | 5 (16.7%) | 25 (83.3%) |
| 55 to 64 Years | 7 (11.7%) | 53 (88.3%) |
| 65 to 74 Years | 40 (93.0%) | 17 (39.5%) |
| 75 Years and over | 42 (100.0%) | 41 (97.6%) |
| Total | 134 (39.2%) | 241 (70.5%) |
Disability Status by Sex by Age in Delphos
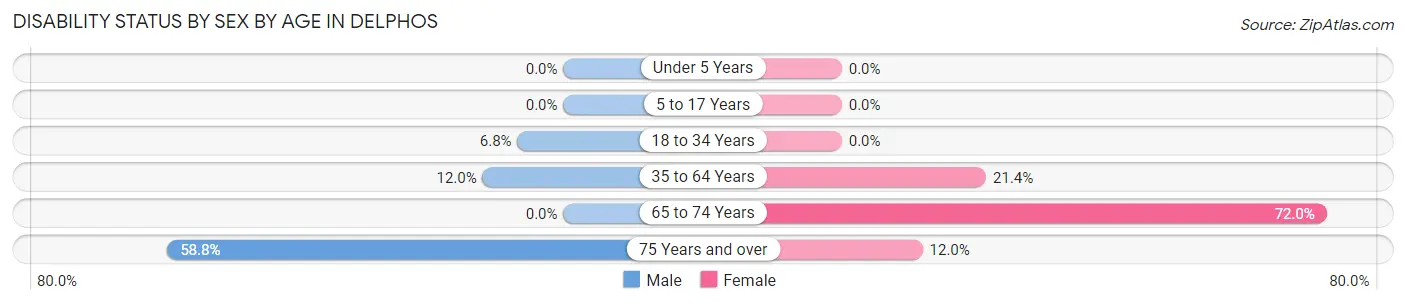
| Age Bracket | Male | Female |
| Under 5 Years | 0 (0.0%) | 0 (0.0%) |
| 5 to 17 Years | 0 (0.0%) | 0 (0.0%) |
| 18 to 34 Years | 3 (6.8%) | 0 (0.0%) |
| 35 to 64 Years | 6 (12.0%) | 12 (21.4%) |
| 65 to 74 Years | 0 (0.0%) | 18 (72.0%) |
| 75 Years and over | 10 (58.8%) | 3 (12.0%) |
Disability Class by Sex by Age in Delphos
Disability Class: Hearing Difficulty
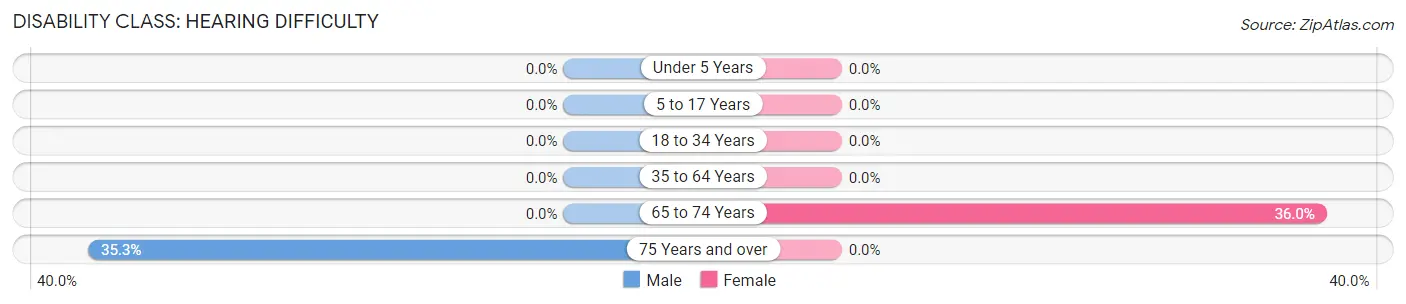
| Age Bracket | Male | Female |
| Under 5 Years | 0 (0.0%) | 0 (0.0%) |
| 5 to 17 Years | 0 (0.0%) | 0 (0.0%) |
| 18 to 34 Years | 0 (0.0%) | 0 (0.0%) |
| 35 to 64 Years | 0 (0.0%) | 0 (0.0%) |
| 65 to 74 Years | 0 (0.0%) | 9 (36.0%) |
| 75 Years and over | 6 (35.3%) | 0 (0.0%) |
Disability Class: Vision Difficulty
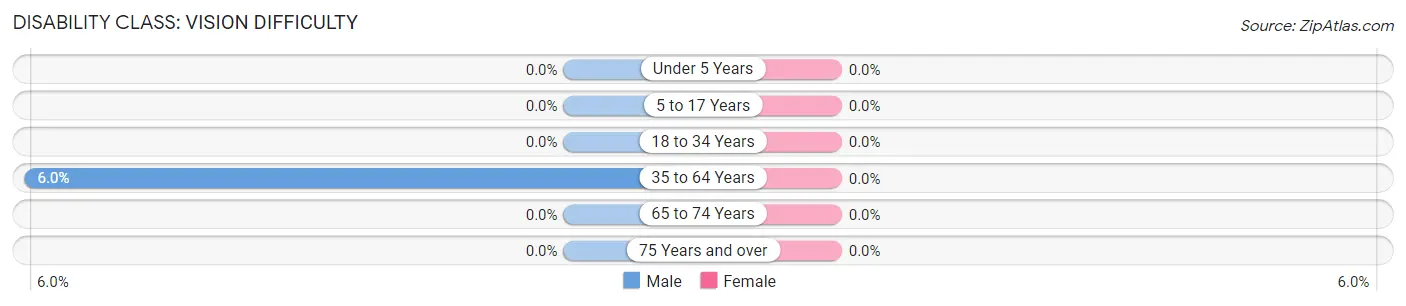
| Age Bracket | Male | Female |
| Under 5 Years | 0 (0.0%) | 0 (0.0%) |
| 5 to 17 Years | 0 (0.0%) | 0 (0.0%) |
| 18 to 34 Years | 0 (0.0%) | 0 (0.0%) |
| 35 to 64 Years | 3 (6.0%) | 0 (0.0%) |
| 65 to 74 Years | 0 (0.0%) | 0 (0.0%) |
| 75 Years and over | 0 (0.0%) | 0 (0.0%) |
Disability Class: Cognitive Difficulty
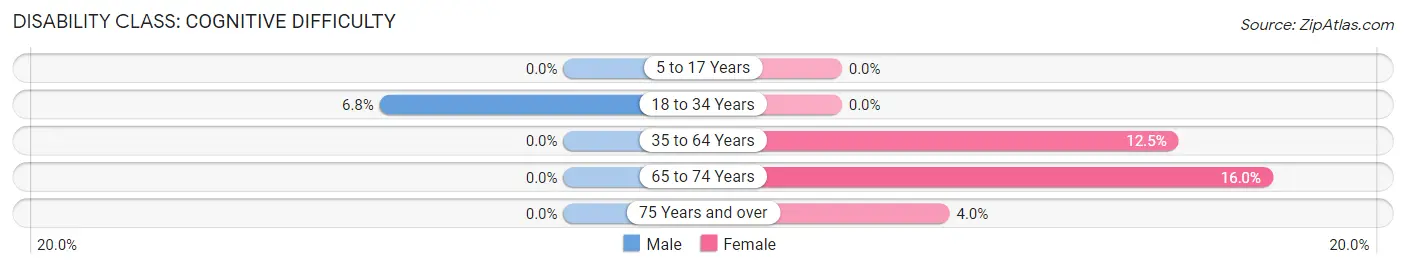
| Age Bracket | Male | Female |
| 5 to 17 Years | 0 (0.0%) | 0 (0.0%) |
| 18 to 34 Years | 3 (6.8%) | 0 (0.0%) |
| 35 to 64 Years | 0 (0.0%) | 7 (12.5%) |
| 65 to 74 Years | 0 (0.0%) | 4 (16.0%) |
| 75 Years and over | 0 (0.0%) | 1 (4.0%) |
Disability Class: Ambulatory Difficulty
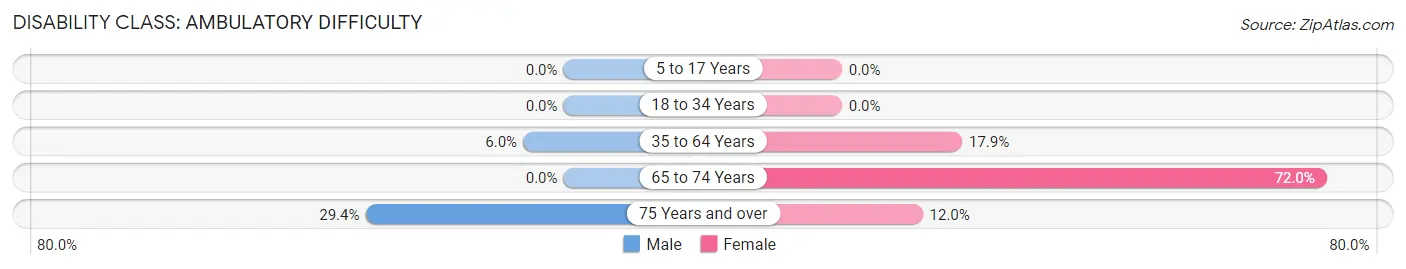
| Age Bracket | Male | Female |
| 5 to 17 Years | 0 (0.0%) | 0 (0.0%) |
| 18 to 34 Years | 0 (0.0%) | 0 (0.0%) |
| 35 to 64 Years | 3 (6.0%) | 10 (17.9%) |
| 65 to 74 Years | 0 (0.0%) | 18 (72.0%) |
| 75 Years and over | 5 (29.4%) | 3 (12.0%) |
Disability Class: Self-Care Difficulty
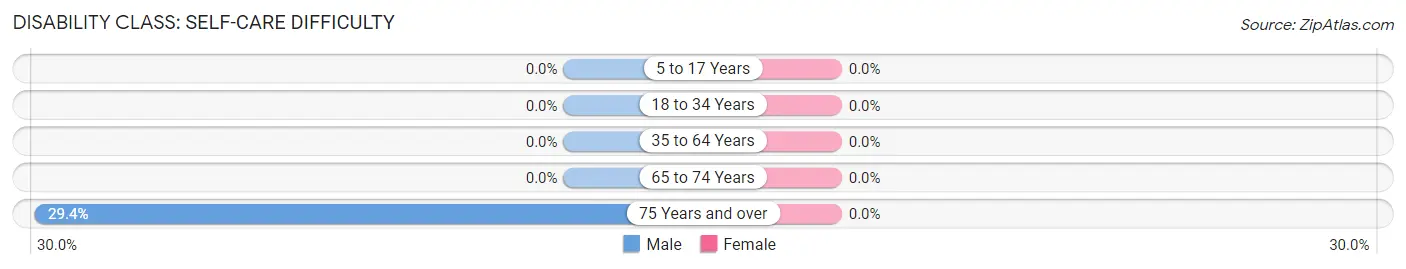
| Age Bracket | Male | Female |
| 5 to 17 Years | 0 (0.0%) | 0 (0.0%) |
| 18 to 34 Years | 0 (0.0%) | 0 (0.0%) |
| 35 to 64 Years | 0 (0.0%) | 0 (0.0%) |
| 65 to 74 Years | 0 (0.0%) | 0 (0.0%) |
| 75 Years and over | 5 (29.4%) | 0 (0.0%) |
Technology Access in Delphos
Computing Device Access in Delphos
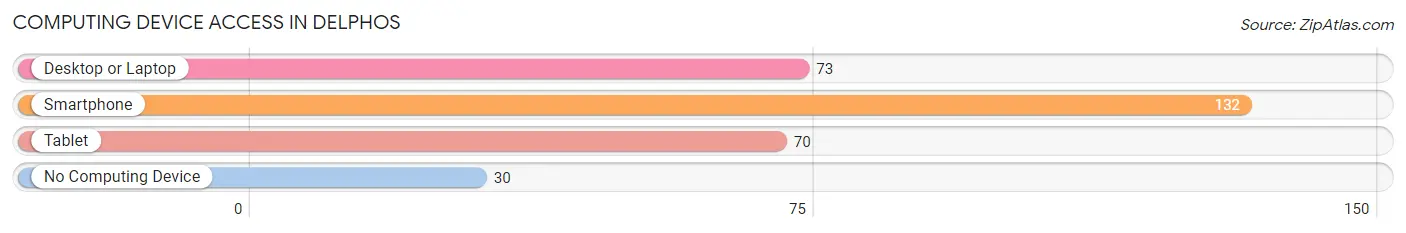
| Device Type | # Households | % Households |
| Desktop or Laptop | 73 | 44.2% |
| Smartphone | 132 | 80.0% |
| Tablet | 70 | 42.4% |
| No Computing Device | 30 | 18.2% |
| Total | 165 | 100.0% |
Internet Access in Delphos
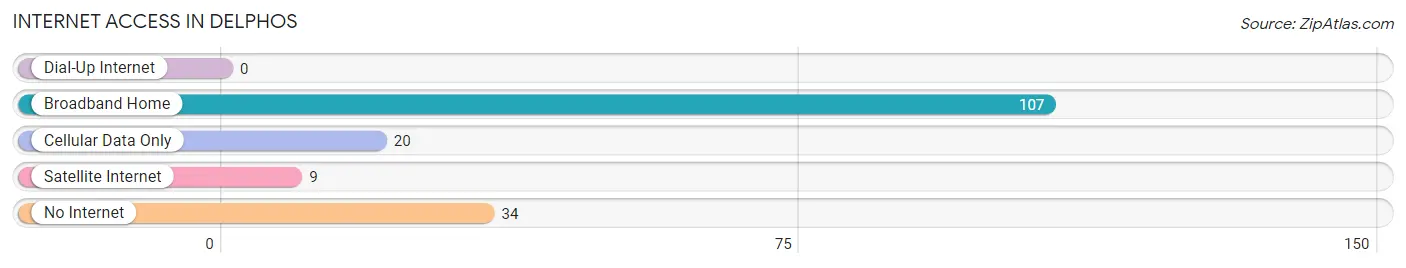
| Internet Type | # Households | % Households |
| Dial-Up Internet | 0 | 0.0% |
| Broadband Home | 107 | 64.8% |
| Cellular Data Only | 20 | 12.1% |
| Satellite Internet | 9 | 5.4% |
| No Internet | 34 | 20.6% |
| Total | 165 | 100.0% |
Delphos Summary
Delphos, Kansas is a small town located in the northwest corner of the state, near the Nebraska border. It is part of the Saline County, and is the county seat. The population of Delphos was estimated to be around 590 in 2020.
History
Delphos was founded in 1871 by a group of settlers from Ohio. The town was named after the ancient Greek city of Delphi, which was known for its oracle. The settlers chose the name because they believed that the town would be a place of great wisdom and knowledge.
The town was originally a farming community, and the main crops were wheat, corn, and hay. In the late 1800s, the town began to grow and prosper. The first school was built in 1876, and the first church was built in 1877.
In the early 1900s, the town began to experience a period of growth and development. The first bank was established in 1906, and the first newspaper was published in 1907. The town also had a post office, a hotel, and a variety of stores.
Geography
Delphos is located in the northwest corner of Kansas, near the Nebraska border. It is part of the Saline County, and is the county seat. The town is situated on the banks of the Republican River, and is surrounded by rolling hills and prairies.
The climate in Delphos is generally mild, with hot summers and cold winters. The average temperature in the summer is around 80 degrees Fahrenheit, and the average temperature in the winter is around 30 degrees Fahrenheit.
Economy
The economy of Delphos is largely based on agriculture. The main crops are wheat, corn, and hay. The town also has a few small businesses, such as a grocery store, a hardware store, and a few restaurants.
Demographics
The population of Delphos was estimated to be around 590 in 2020. The town is predominantly white, with a small Hispanic population. The median household income is around $45,000, and the median home value is around $90,000.
Delphos is a small town with a rich history and a bright future. It is a great place to live, work, and raise a family. The town is surrounded by beautiful scenery, and the people are friendly and welcoming. Delphos is a great place to call home.
Common Questions
What is Per Capita Income in Delphos?
Per Capita income in Delphos is $29,415.
What is the Median Family Income in Delphos?
Median Family Income in Delphos is $76,458.
What is the Median Household income in Delphos?
Median Household Income in Delphos is $52,688.
What is Income or Wage Gap in Delphos?
Income or Wage Gap in Delphos is 20.1%.
Women in Delphos earn 79.9 cents for every dollar earned by a man.
What is Inequality or Gini Index in Delphos?
Inequality or Gini Index in Delphos is 0.45.
What is the Total Population of Delphos?
Total Population of Delphos is 342.
What is the Total Male Population of Delphos?
Total Male Population of Delphos is 161.
What is the Total Female Population of Delphos?
Total Female Population of Delphos is 181.
What is the Ratio of Males per 100 Females in Delphos?
There are 88.95 Males per 100 Females in Delphos.
What is the Ratio of Females per 100 Males in Delphos?
There are 112.42 Females per 100 Males in Delphos.
What is the Median Population Age in Delphos?
Median Population Age in Delphos is 46.5 Years.
What is the Average Family Size in Delphos
Average Family Size in Delphos is 2.7 People.
What is the Average Household Size in Delphos
Average Household Size in Delphos is 2.1 People.
How Large is the Labor Force in Delphos?
There are 154 People in the Labor Forcein in Delphos.
What is the Percentage of People in the Labor Force in Delphos?
57.9% of People are in the Labor Force in Delphos.