Claflin, KS Map & Demographics
Claflin Map
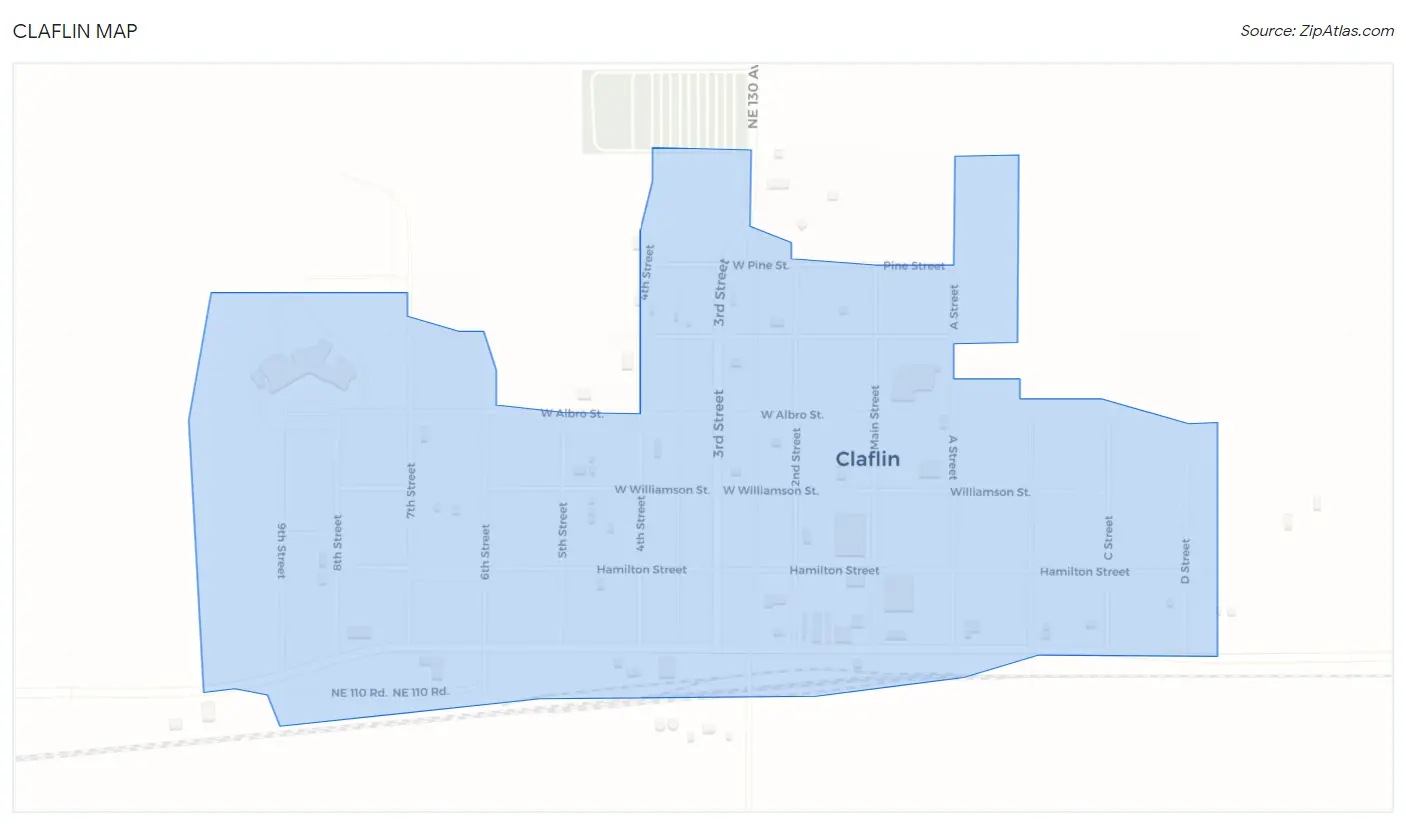
Claflin Overview
$27,971
PER CAPITA INCOME
$65,357
AVG FAMILY INCOME
$58,125
AVG HOUSEHOLD INCOME
45.0%
WAGE / INCOME GAP [ % ]
55.0¢/ $1
WAGE / INCOME GAP [ $ ]
0.42
INEQUALITY / GINI INDEX
487
TOTAL POPULATION
253
MALE POPULATION
234
FEMALE POPULATION
108.12
MALES / 100 FEMALES
92.49
FEMALES / 100 MALES
38.0
MEDIAN AGE
3.1
AVG FAMILY SIZE
2.4
AVG HOUSEHOLD SIZE
241
LABOR FORCE [ PEOPLE ]
65.7%
PERCENT IN LABOR FORCE
9.5%
UNEMPLOYMENT RATE
Claflin Zip Codes
Claflin Area Codes
Income in Claflin
Income Overview in Claflin
Per Capita Income in Claflin is $27,971, while median incomes of families and households are $65,357 and $58,125 respectively.
| Characteristic | Number | Measure |
| Per Capita Income | 487 | $27,971 |
| Median Family Income | 124 | $65,357 |
| Mean Family Income | 124 | $65,137 |
| Median Household Income | 203 | $58,125 |
| Mean Household Income | 203 | $63,772 |
| Income Deficit | 124 | $0 |
| Wage / Income Gap (%) | 487 | 45.02% |
| Wage / Income Gap ($) | 487 | 54.98¢ per $1 |
| Gini / Inequality Index | 487 | 0.42 |
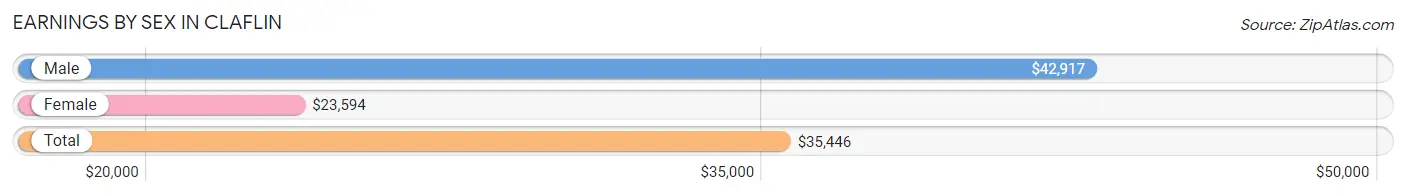
Earnings by Sex in Claflin
Average Earnings in Claflin are $35,446, $42,917 for men and $23,594 for women, a difference of 45.0%.
| Sex | Number | Average Earnings |
| Male | 126 (51.0%) | $42,917 |
| Female | 121 (49.0%) | $23,594 |
| Total | 247 (100.0%) | $35,446 |
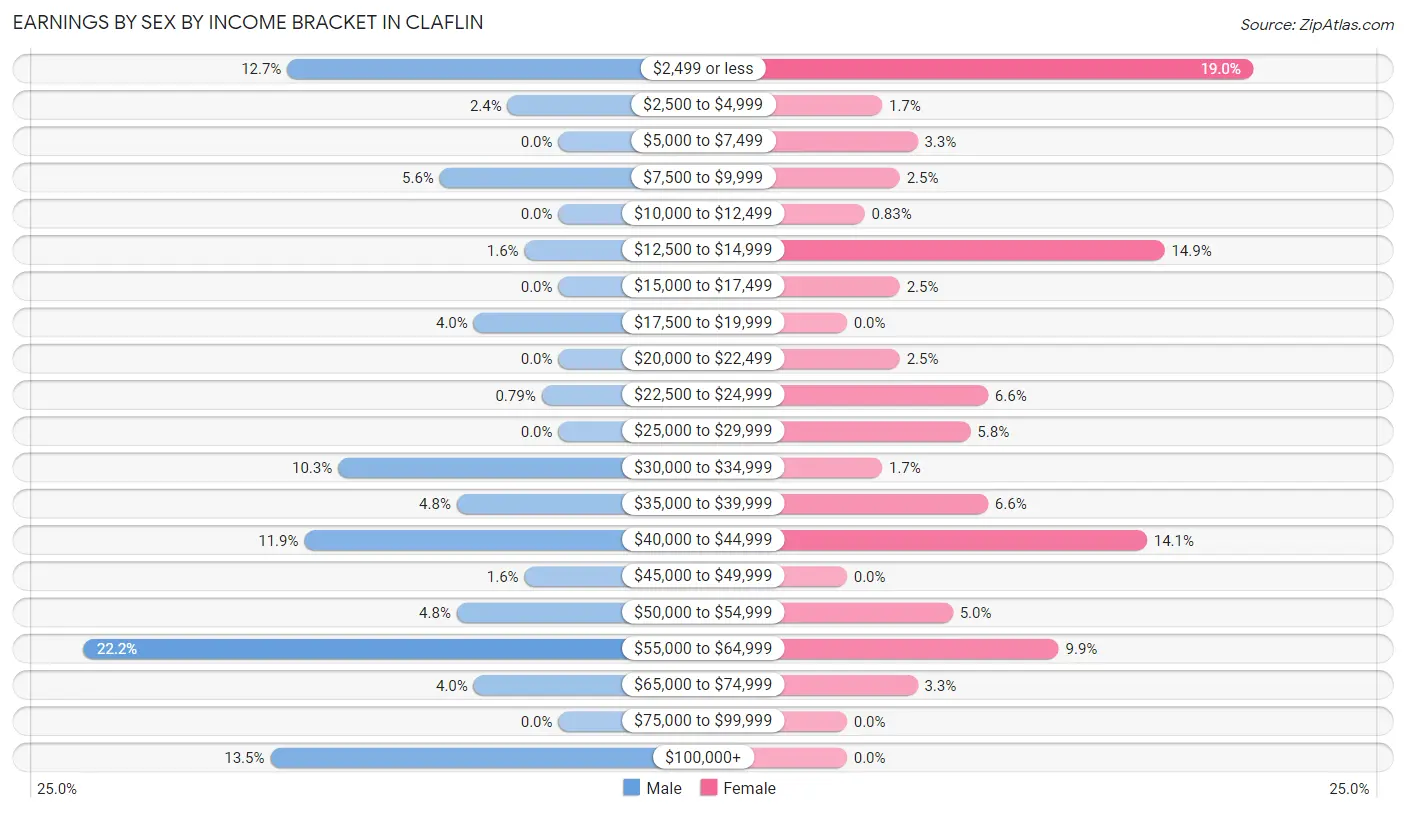
Earnings by Sex by Income Bracket in Claflin
The most common earnings brackets in Claflin are $55,000 to $64,999 for men (28 | 22.2%) and $2,499 or less for women (23 | 19.0%).
| Income | Male | Female |
| $2,499 or less | 16 (12.7%) | 23 (19.0%) |
| $2,500 to $4,999 | 3 (2.4%) | 2 (1.7%) |
| $5,000 to $7,499 | 0 (0.0%) | 4 (3.3%) |
| $7,500 to $9,999 | 7 (5.6%) | 3 (2.5%) |
| $10,000 to $12,499 | 0 (0.0%) | 1 (0.8%) |
| $12,500 to $14,999 | 2 (1.6%) | 18 (14.9%) |
| $15,000 to $17,499 | 0 (0.0%) | 3 (2.5%) |
| $17,500 to $19,999 | 5 (4.0%) | 0 (0.0%) |
| $20,000 to $22,499 | 0 (0.0%) | 3 (2.5%) |
| $22,500 to $24,999 | 1 (0.8%) | 8 (6.6%) |
| $25,000 to $29,999 | 0 (0.0%) | 7 (5.8%) |
| $30,000 to $34,999 | 13 (10.3%) | 2 (1.7%) |
| $35,000 to $39,999 | 6 (4.8%) | 8 (6.6%) |
| $40,000 to $44,999 | 15 (11.9%) | 17 (14.1%) |
| $45,000 to $49,999 | 2 (1.6%) | 0 (0.0%) |
| $50,000 to $54,999 | 6 (4.8%) | 6 (5.0%) |
| $55,000 to $64,999 | 28 (22.2%) | 12 (9.9%) |
| $65,000 to $74,999 | 5 (4.0%) | 4 (3.3%) |
| $75,000 to $99,999 | 0 (0.0%) | 0 (0.0%) |
| $100,000+ | 17 (13.5%) | 0 (0.0%) |
| Total | 126 (100.0%) | 121 (100.0%) |
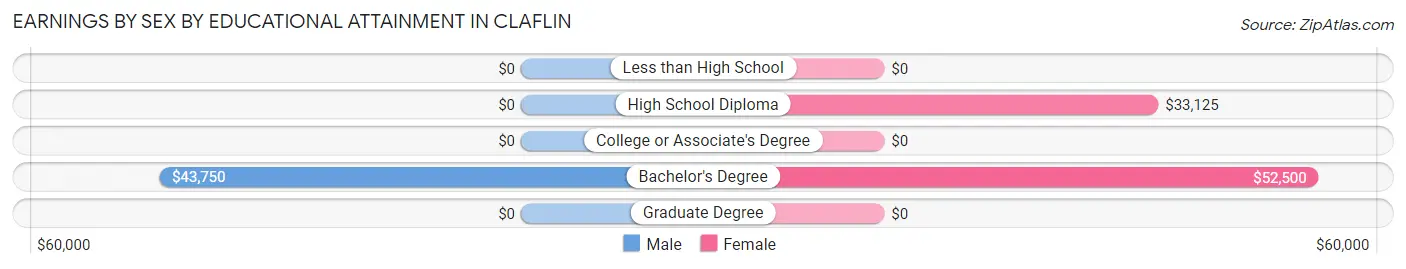
Earnings by Sex by Educational Attainment in Claflin
Average earnings in Claflin are $40,833 for men and $25,313 for women, a difference of 38.0%. Men with an educational attainment of bachelor's degree enjoy the highest average annual earnings of $43,750, while those with bachelor's degree education earn the least with $43,750. Women with an educational attainment of bachelor's degree earn the most with the average annual earnings of $52,500, while those with high school diploma education have the smallest earnings of $33,125.
| Educational Attainment | Male Income | Female Income |
| Less than High School | - | - |
| High School Diploma | - | - |
| College or Associate's Degree | - | - |
| Bachelor's Degree | $43,750 | $52,500 |
| Graduate Degree | - | - |
| Total | $40,833 | $25,313 |
Family Income in Claflin
Family Income Brackets in Claflin
According to the Claflin family income data, there are 38 families falling into the $50,000 to $74,999 income range, which is the most common income bracket and makes up 30.6% of all families.
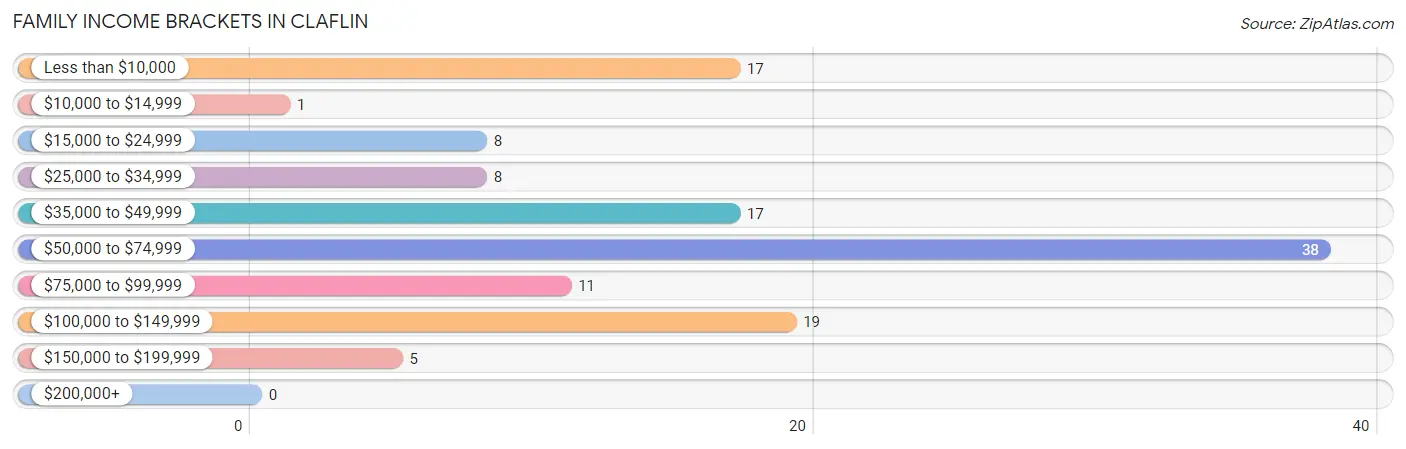
| Income Bracket | # Families | % Families |
| Less than $10,000 | 17 | 13.7% |
| $10,000 to $14,999 | 1 | 0.8% |
| $15,000 to $24,999 | 8 | 6.5% |
| $25,000 to $34,999 | 8 | 6.5% |
| $35,000 to $49,999 | 17 | 13.7% |
| $50,000 to $74,999 | 38 | 30.6% |
| $75,000 to $99,999 | 11 | 8.9% |
| $100,000 to $149,999 | 19 | 15.3% |
| $150,000 to $199,999 | 5 | 4.0% |
| $200,000+ | 0 | 0.0% |
Family Income by Famaliy Size in Claflin
2-person families (74 | 59.7%) account for the highest median family income in Claflin with $72,647 per family, while 2-person families (74 | 59.7%) have the highest median income of $36,324 per family member.
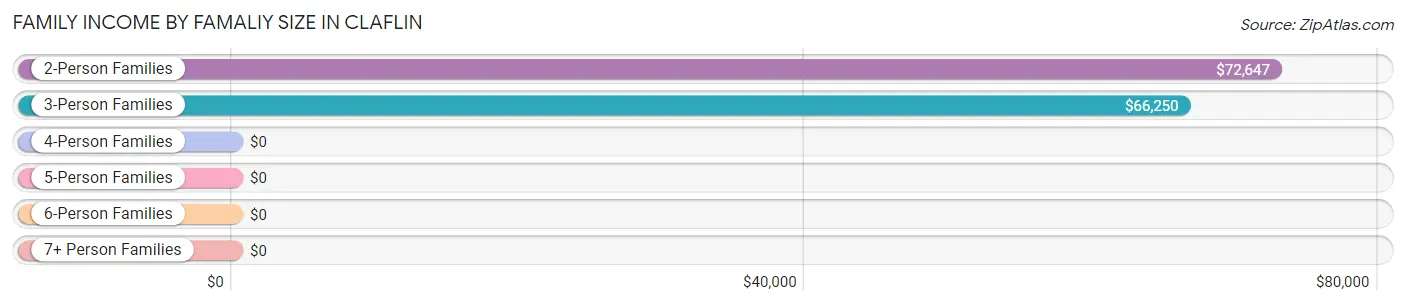
| Income Bracket | # Families | Median Income |
| 2-Person Families | 74 (59.7%) | $72,647 |
| 3-Person Families | 17 (13.7%) | $66,250 |
| 4-Person Families | 13 (10.5%) | $0 |
| 5-Person Families | 17 (13.7%) | $0 |
| 6-Person Families | 2 (1.6%) | $0 |
| 7+ Person Families | 1 (0.8%) | $0 |
| Total | 124 (100.0%) | $65,357 |
Family Income by Number of Earners in Claflin
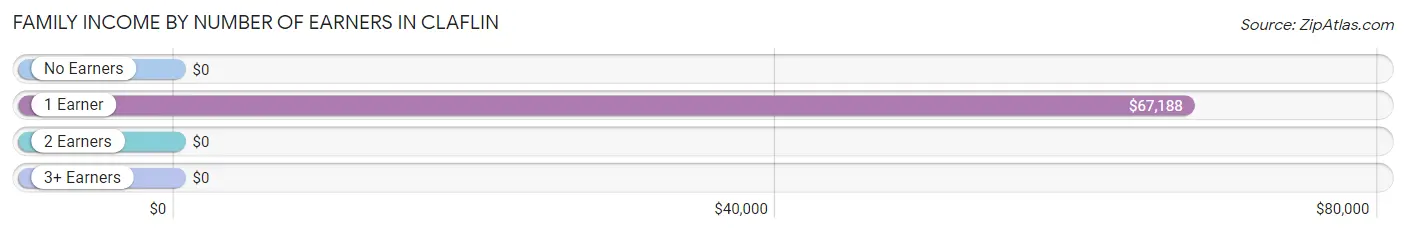
| Number of Earners | # Families | Median Income |
| No Earners | 7 (5.7%) | $0 |
| 1 Earner | 67 (54.0%) | $67,188 |
| 2 Earners | 45 (36.3%) | $0 |
| 3+ Earners | 5 (4.0%) | $0 |
| Total | 124 (100.0%) | $65,357 |
Household Income in Claflin
Household Income Brackets in Claflin
With 67 households falling in the category, the $50,000 to $74,999 income range is the most frequent in Claflin, accounting for 33.0% of all households. In contrast, only 5 households (2.5%) fall into the $150,000 to $199,999 income bracket, making it the least populous group.
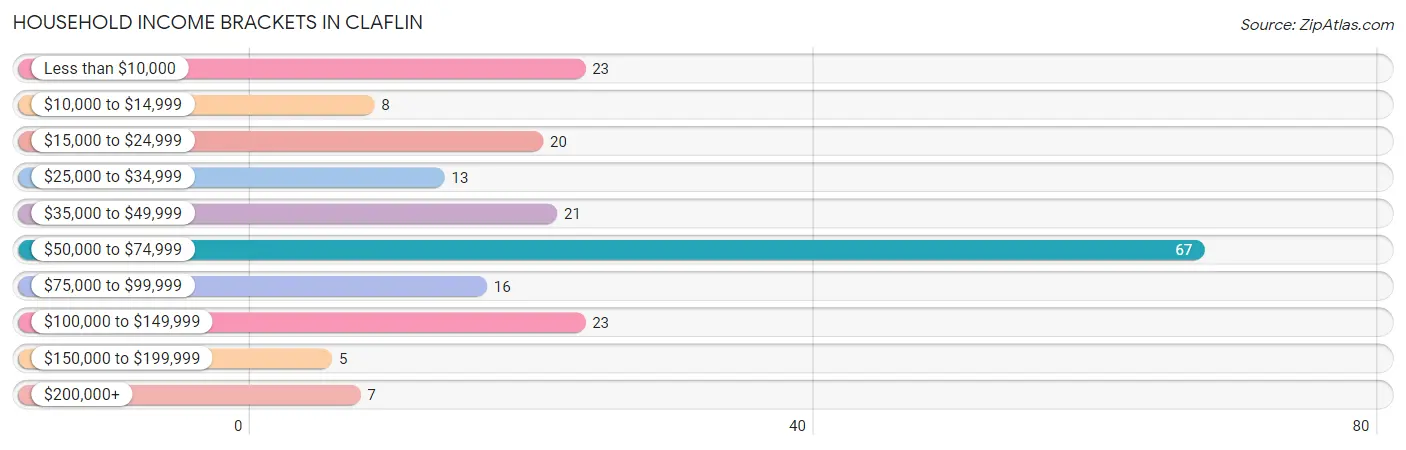
| Income Bracket | # Households | % Households |
| Less than $10,000 | 23 | 11.3% |
| $10,000 to $14,999 | 8 | 3.9% |
| $15,000 to $24,999 | 20 | 9.9% |
| $25,000 to $34,999 | 13 | 6.4% |
| $35,000 to $49,999 | 21 | 10.3% |
| $50,000 to $74,999 | 67 | 33.0% |
| $75,000 to $99,999 | 16 | 7.9% |
| $100,000 to $149,999 | 23 | 11.3% |
| $150,000 to $199,999 | 5 | 2.5% |
| $200,000+ | 7 | 3.4% |
Household Income by Householder Age in Claflin
The median household income in Claflin is $58,125, with the highest median household income of $67,188 found in the 45 to 64 years age bracket for the primary householder. A total of 53 households (26.1%) fall into this category. Meanwhile, the 15 to 24 years age bracket for the primary householder has the lowest median household income of $0, with 1 households (0.5%) in this group.
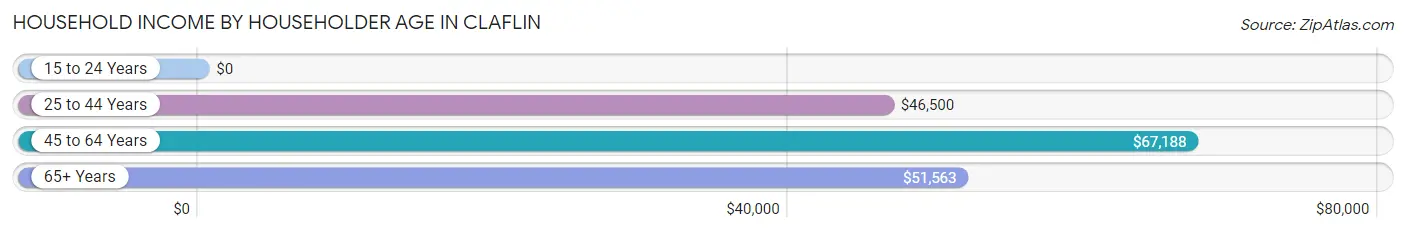
| Income Bracket | # Households | Median Income |
| 15 to 24 Years | 1 (0.5%) | $0 |
| 25 to 44 Years | 74 (36.4%) | $46,500 |
| 45 to 64 Years | 53 (26.1%) | $67,188 |
| 65+ Years | 75 (36.9%) | $51,563 |
| Total | 203 (100.0%) | $58,125 |
Poverty in Claflin
Income Below Poverty by Sex and Age in Claflin
With 26.9% poverty level for males and 17.1% for females among the residents of Claflin, 12 to 14 year old males and 16 and 17 year old females are the most vulnerable to poverty, with 15 males (78.9%) and 8 females (44.4%) in their respective age groups living below the poverty level.
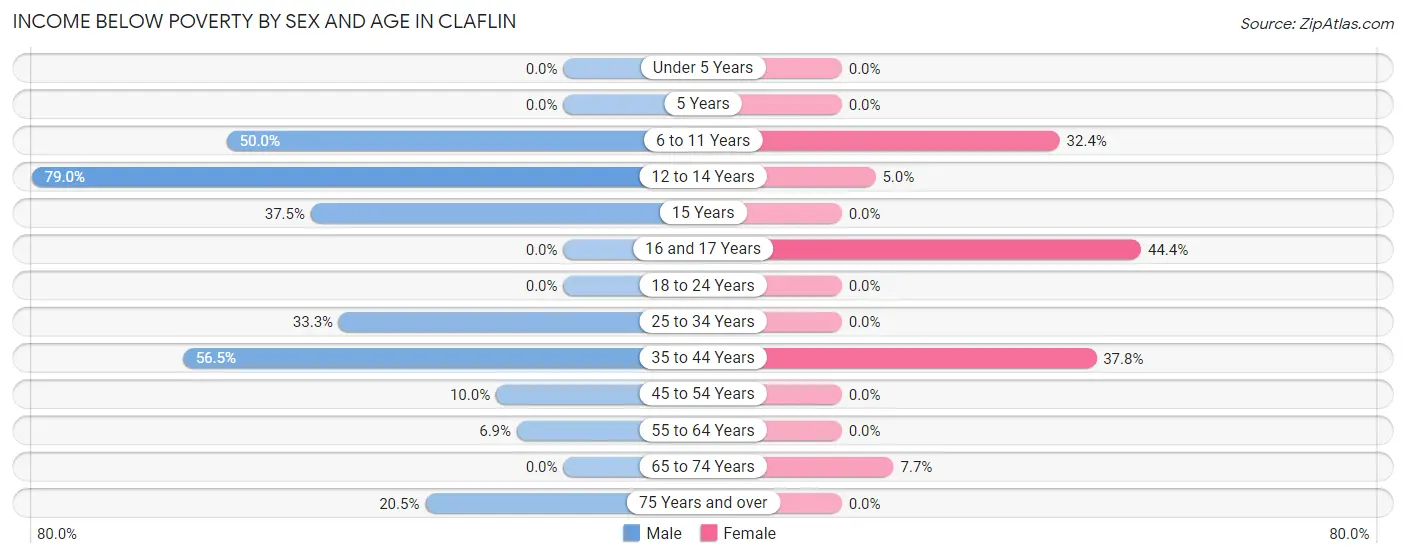
| Age Bracket | Male | Female |
| Under 5 Years | 0 (0.0%) | 0 (0.0%) |
| 5 Years | 0 (0.0%) | 0 (0.0%) |
| 6 to 11 Years | 15 (50.0%) | 11 (32.4%) |
| 12 to 14 Years | 15 (78.9%) | 1 (5.0%) |
| 15 Years | 3 (37.5%) | 0 (0.0%) |
| 16 and 17 Years | 0 (0.0%) | 8 (44.4%) |
| 18 to 24 Years | 0 (0.0%) | 0 (0.0%) |
| 25 to 34 Years | 10 (33.3%) | 0 (0.0%) |
| 35 to 44 Years | 13 (56.5%) | 17 (37.8%) |
| 45 to 54 Years | 2 (10.0%) | 0 (0.0%) |
| 55 to 64 Years | 2 (6.9%) | 0 (0.0%) |
| 65 to 74 Years | 0 (0.0%) | 3 (7.7%) |
| 75 Years and over | 8 (20.5%) | 0 (0.0%) |
| Total | 68 (26.9%) | 40 (17.1%) |
Income Above Poverty by Sex and Age in Claflin
According to the poverty statistics in Claflin, males aged 5 years and females aged under 5 years are the age groups that are most secure financially, with 100.0% of males and 100.0% of females in these age groups living above the poverty line.
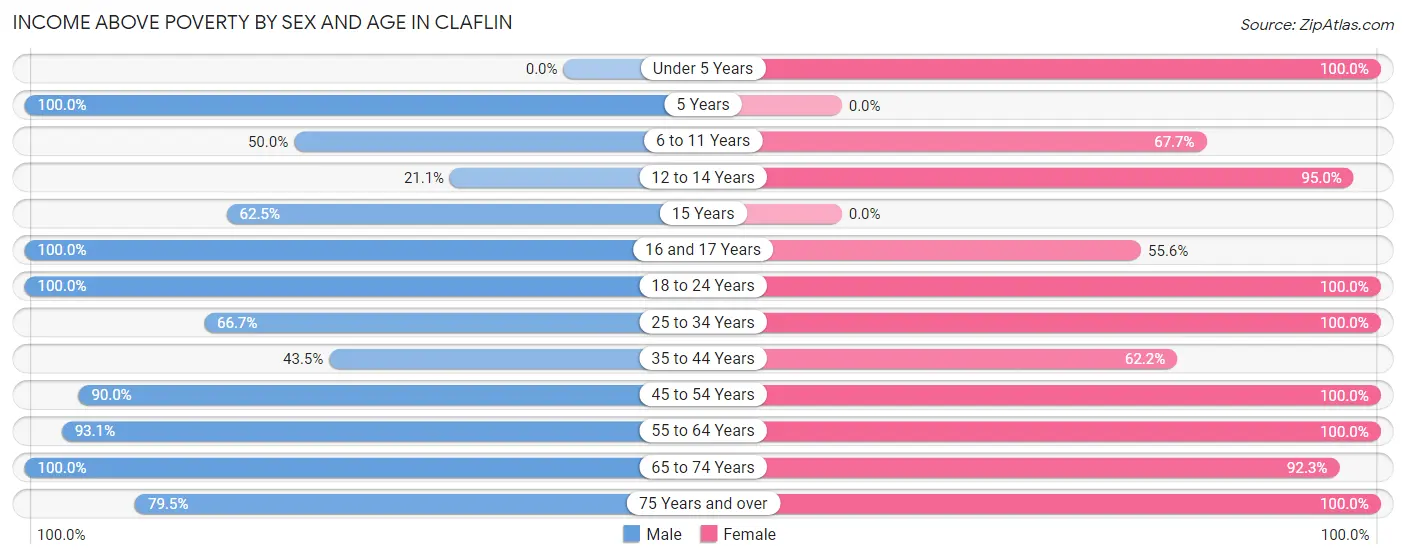
| Age Bracket | Male | Female |
| Under 5 Years | 0 (0.0%) | 2 (100.0%) |
| 5 Years | 7 (100.0%) | 0 (0.0%) |
| 6 to 11 Years | 15 (50.0%) | 23 (67.6%) |
| 12 to 14 Years | 4 (21.0%) | 19 (95.0%) |
| 15 Years | 5 (62.5%) | 0 (0.0%) |
| 16 and 17 Years | 18 (100.0%) | 10 (55.6%) |
| 18 to 24 Years | 16 (100.0%) | 5 (100.0%) |
| 25 to 34 Years | 20 (66.7%) | 12 (100.0%) |
| 35 to 44 Years | 10 (43.5%) | 28 (62.2%) |
| 45 to 54 Years | 18 (90.0%) | 15 (100.0%) |
| 55 to 64 Years | 27 (93.1%) | 26 (100.0%) |
| 65 to 74 Years | 14 (100.0%) | 36 (92.3%) |
| 75 Years and over | 31 (79.5%) | 18 (100.0%) |
| Total | 185 (73.1%) | 194 (82.9%) |
Income Below Poverty Among Married-Couple Families in Claflin
The poverty statistics for married-couple families in Claflin show that 18.2% or 16 of the total 88 families live below the poverty line. Families with 3 or 4 children have the highest poverty rate of 75.0%, comprising of 15 families. On the other hand, families with 1 or 2 children have the lowest poverty rate of 0.0%, which includes 0 families.
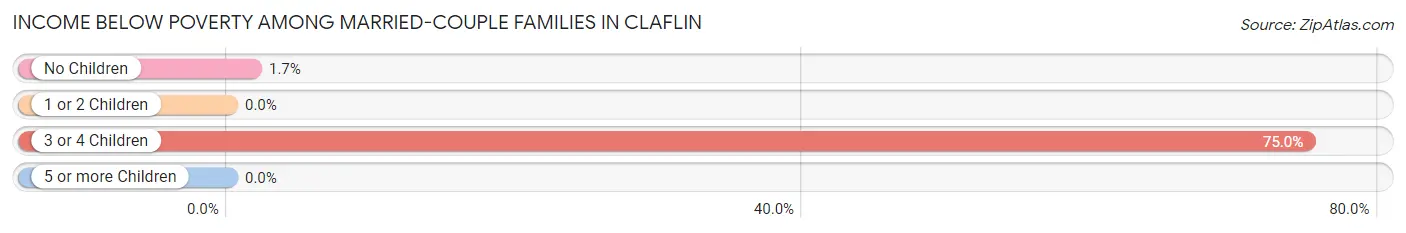
| Children | Above Poverty | Below Poverty |
| No Children | 59 (98.3%) | 1 (1.7%) |
| 1 or 2 Children | 8 (100.0%) | 0 (0.0%) |
| 3 or 4 Children | 5 (25.0%) | 15 (75.0%) |
| 5 or more Children | 0 (0.0%) | 0 (0.0%) |
| Total | 72 (81.8%) | 16 (18.2%) |
Income Below Poverty Among Single-Parent Households in Claflin
According to the poverty data in Claflin, 22.2% or 2 single-father households and 7.4% or 2 single-mother households are living below the poverty line. Among single-father households, those with 1 or 2 children have the highest poverty rate, with 2 households (22.2%) experiencing poverty. Likewise, among single-mother households, those with 3 or 4 children have the highest poverty rate, with 2 households (25.0%) falling below the poverty line.
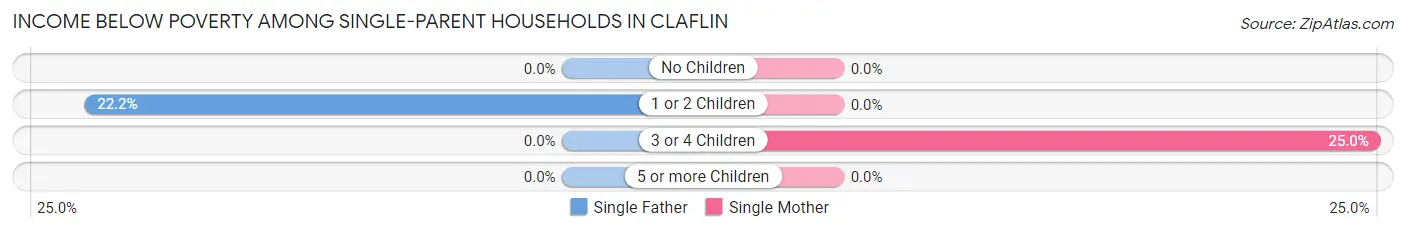
| Children | Single Father | Single Mother |
| No Children | 0 (0.0%) | 0 (0.0%) |
| 1 or 2 Children | 2 (22.2%) | 0 (0.0%) |
| 3 or 4 Children | 0 (0.0%) | 2 (25.0%) |
| 5 or more Children | 0 (0.0%) | 0 (0.0%) |
| Total | 2 (22.2%) | 2 (7.4%) |
Income Below Poverty Among Married-Couple vs Single-Parent Households in Claflin
The poverty data for Claflin shows that 16 of the married-couple family households (18.2%) and 4 of the single-parent households (11.1%) are living below the poverty level. Within the married-couple family households, those with 3 or 4 children have the highest poverty rate, with 15 households (75.0%) falling below the poverty line. Among the single-parent households, those with 3 or 4 children have the highest poverty rate, with 2 household (25.0%) living below poverty.
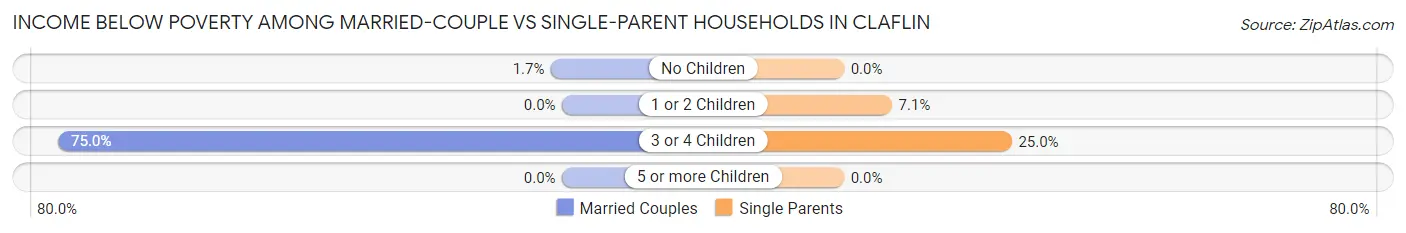
| Children | Married-Couple Families | Single-Parent Households |
| No Children | 1 (1.7%) | 0 (0.0%) |
| 1 or 2 Children | 0 (0.0%) | 2 (7.1%) |
| 3 or 4 Children | 15 (75.0%) | 2 (25.0%) |
| 5 or more Children | 0 (0.0%) | 0 (0.0%) |
| Total | 16 (18.2%) | 4 (11.1%) |
Race in Claflin
The most populous races in Claflin are White / Caucasian (487 | 100.0%), and Hispanic or Latino (5 | 1.0%).
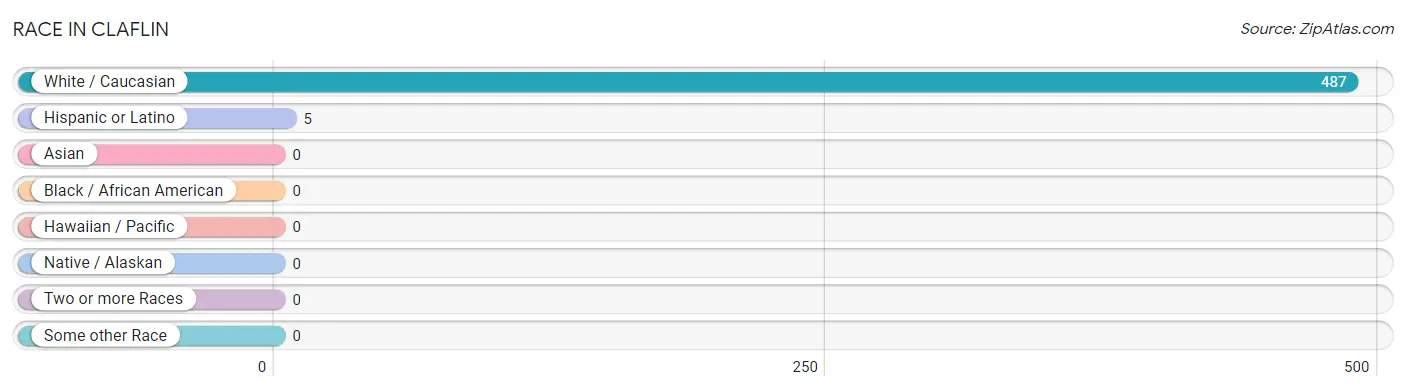
| Race | # Population | % Population |
| Asian | 0 | 0.0% |
| Black / African American | 0 | 0.0% |
| Hawaiian / Pacific | 0 | 0.0% |
| Hispanic or Latino | 5 | 1.0% |
| Native / Alaskan | 0 | 0.0% |
| White / Caucasian | 487 | 100.0% |
| Two or more Races | 0 | 0.0% |
| Some other Race | 0 | 0.0% |
| Total | 487 | 100.0% |
Ancestry in Claflin
The most populous ancestries reported in Claflin are German (233 | 47.8%), Irish (77 | 15.8%), French (45 | 9.2%), English (42 | 8.6%), and Russian (36 | 7.4%), together accounting for 88.9% of all Claflin residents.
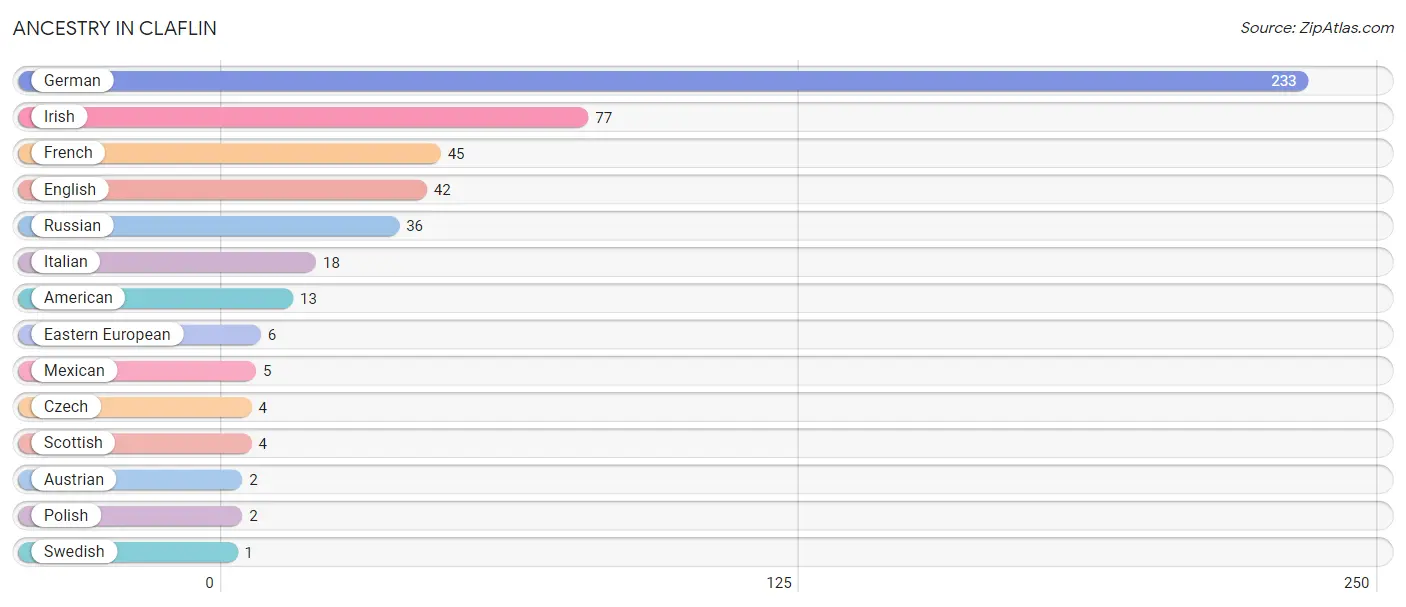
| Ancestry | # Population | % Population |
| American | 13 | 2.7% |
| Austrian | 2 | 0.4% |
| Czech | 4 | 0.8% |
| Eastern European | 6 | 1.2% |
| English | 42 | 8.6% |
| French | 45 | 9.2% |
| German | 233 | 47.8% |
| Irish | 77 | 15.8% |
| Italian | 18 | 3.7% |
| Mexican | 5 | 1.0% |
| Polish | 2 | 0.4% |
| Russian | 36 | 7.4% |
| Scottish | 4 | 0.8% |
| Swedish | 1 | 0.2% | View All 14 Rows |
Immigrants in Claflin
The most numerous immigrant groups reported in Claflin came from Europe (14 | 2.9%), Italy (8 | 1.6%), Southern Europe (8 | 1.6%), Germany (6 | 1.2%), and Western Europe (6 | 1.2%), together accounting for 8.6% of all Claflin residents.
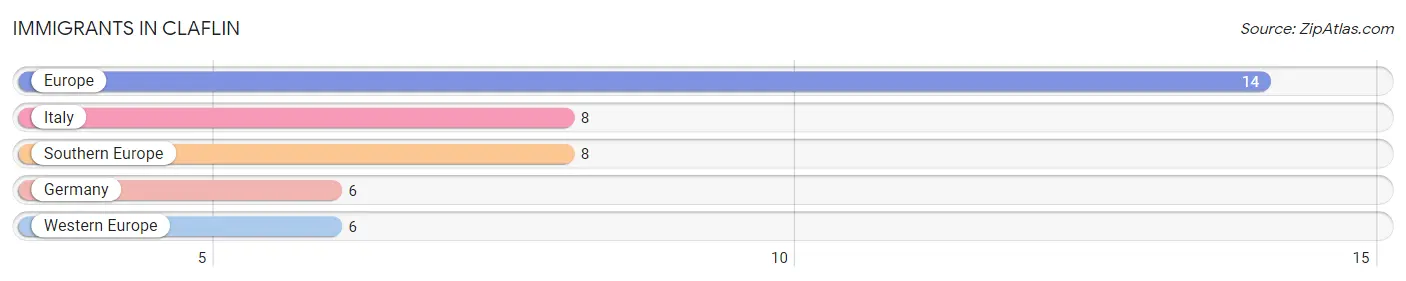
| Immigration Origin | # Population | % Population |
| Europe | 14 | 2.9% |
| Germany | 6 | 1.2% |
| Italy | 8 | 1.6% |
| Southern Europe | 8 | 1.6% |
| Western Europe | 6 | 1.2% | View All 5 Rows |
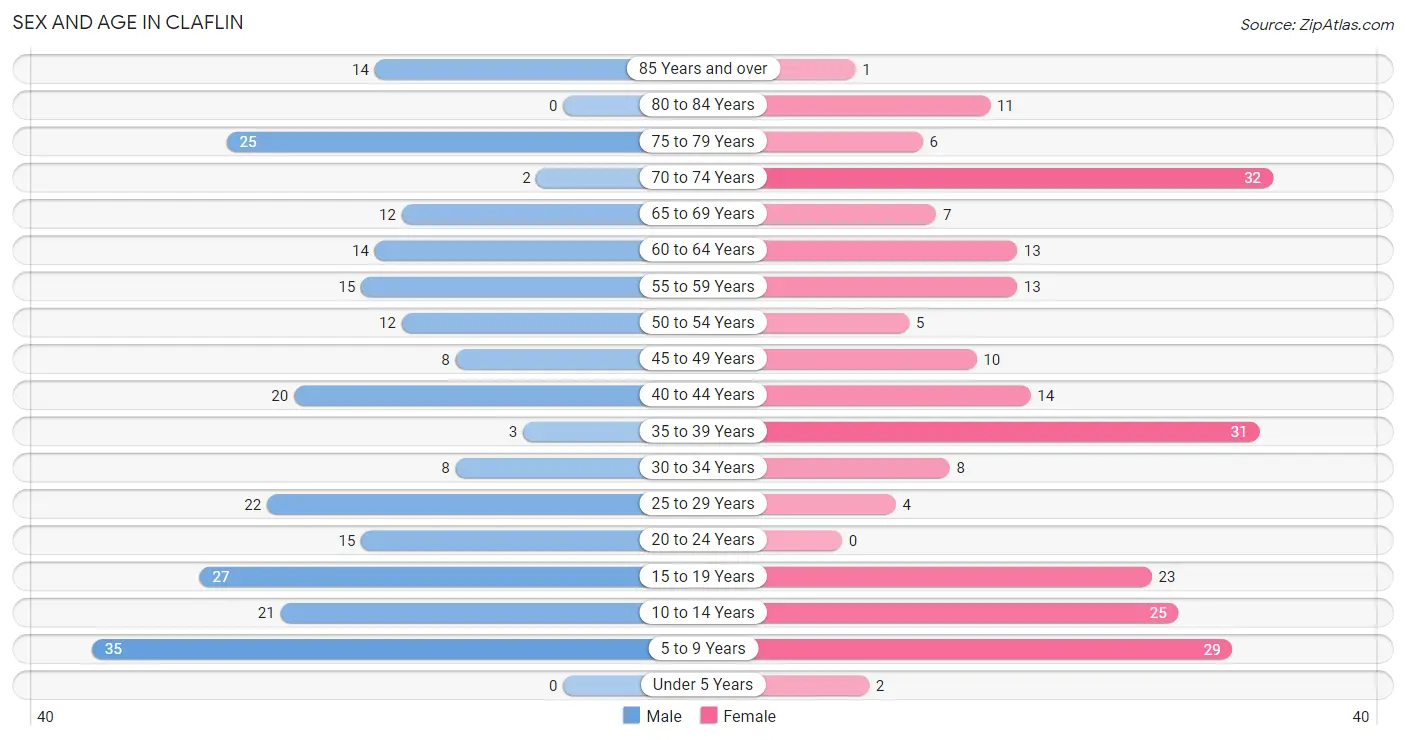
Sex and Age in Claflin
Sex and Age in Claflin
The most populous age groups in Claflin are 5 to 9 Years (35 | 13.8%) for men and 70 to 74 Years (32 | 13.7%) for women.
| Age Bracket | Male | Female |
| Under 5 Years | 0 (0.0%) | 2 (0.9%) |
| 5 to 9 Years | 35 (13.8%) | 29 (12.4%) |
| 10 to 14 Years | 21 (8.3%) | 25 (10.7%) |
| 15 to 19 Years | 27 (10.7%) | 23 (9.8%) |
| 20 to 24 Years | 15 (5.9%) | 0 (0.0%) |
| 25 to 29 Years | 22 (8.7%) | 4 (1.7%) |
| 30 to 34 Years | 8 (3.2%) | 8 (3.4%) |
| 35 to 39 Years | 3 (1.2%) | 31 (13.3%) |
| 40 to 44 Years | 20 (7.9%) | 14 (6.0%) |
| 45 to 49 Years | 8 (3.2%) | 10 (4.3%) |
| 50 to 54 Years | 12 (4.7%) | 5 (2.1%) |
| 55 to 59 Years | 15 (5.9%) | 13 (5.6%) |
| 60 to 64 Years | 14 (5.5%) | 13 (5.6%) |
| 65 to 69 Years | 12 (4.7%) | 7 (3.0%) |
| 70 to 74 Years | 2 (0.8%) | 32 (13.7%) |
| 75 to 79 Years | 25 (9.9%) | 6 (2.6%) |
| 80 to 84 Years | 0 (0.0%) | 11 (4.7%) |
| 85 Years and over | 14 (5.5%) | 1 (0.4%) |
| Total | 253 (100.0%) | 234 (100.0%) |
Families and Households in Claflin
Median Family Size in Claflin
The median family size in Claflin is 3.11 persons per family, with single female/mother families (27 | 21.8%) accounting for the largest median family size of 3.26 persons per family. On the other hand, single male/father families (9 | 7.3%) represent the smallest median family size with 2.44 persons per family.
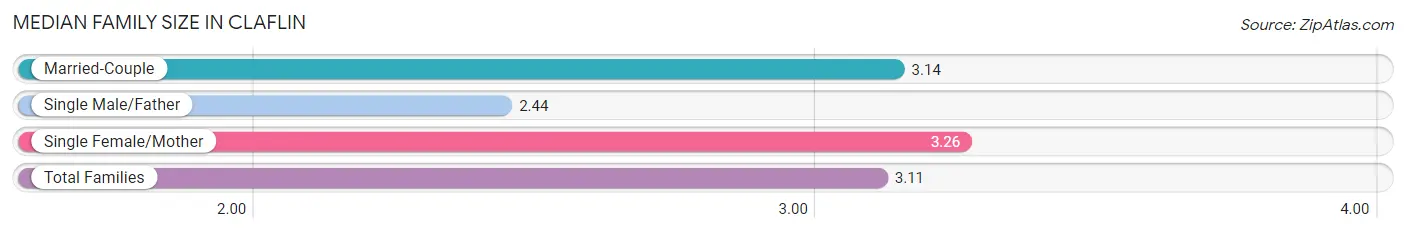
| Family Type | # Families | Family Size |
| Married-Couple | 88 (71.0%) | 3.14 |
| Single Male/Father | 9 (7.3%) | 2.44 |
| Single Female/Mother | 27 (21.8%) | 3.26 |
| Total Families | 124 (100.0%) | 3.11 |
Median Household Size in Claflin
The median household size in Claflin is 2.40 persons per household, with single female/mother households (27 | 13.3%) accounting for the largest median household size of 3.56 persons per household. non-family households (79 | 38.9%) represent the smallest median household size with 1.18 persons per household.
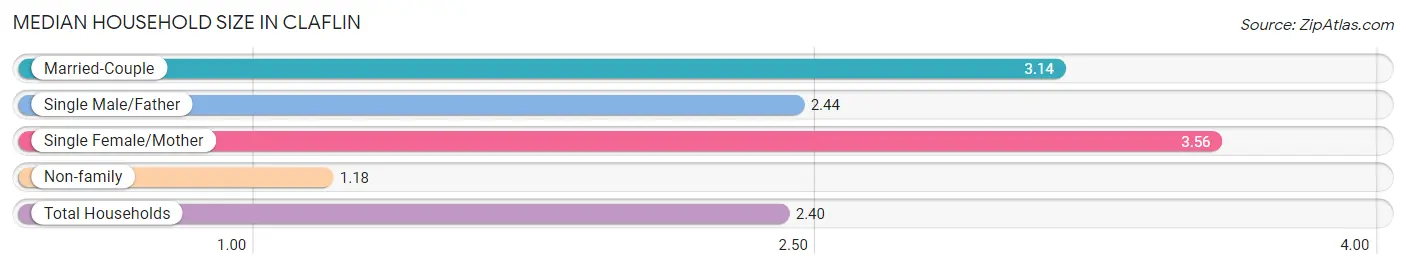
| Household Type | # Households | Household Size |
| Married-Couple | 88 (43.3%) | 3.14 |
| Single Male/Father | 9 (4.4%) | 2.44 |
| Single Female/Mother | 27 (13.3%) | 3.56 |
| Non-family | 79 (38.9%) | 1.18 |
| Total Households | 203 (100.0%) | 2.40 |
Household Size by Marriage Status in Claflin
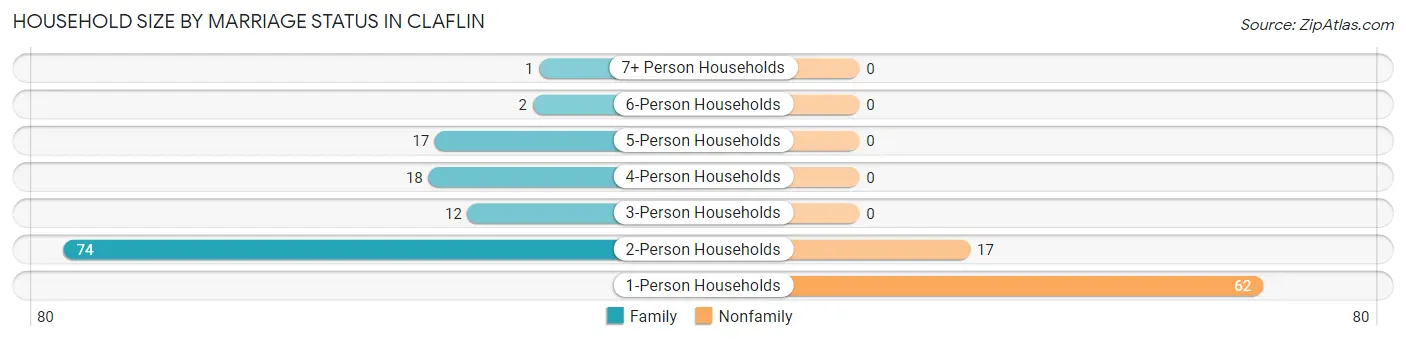
Out of a total of 203 households in Claflin, 124 (61.1%) are family households, while 79 (38.9%) are nonfamily households. The most numerous type of family households are 2-person households, comprising 74, and the most common type of nonfamily households are 1-person households, comprising 62.
| Household Size | Family Households | Nonfamily Households |
| 1-Person Households | - | 62 (30.5%) |
| 2-Person Households | 74 (36.4%) | 17 (8.4%) |
| 3-Person Households | 12 (5.9%) | 0 (0.0%) |
| 4-Person Households | 18 (8.9%) | 0 (0.0%) |
| 5-Person Households | 17 (8.4%) | 0 (0.0%) |
| 6-Person Households | 2 (1.0%) | 0 (0.0%) |
| 7+ Person Households | 1 (0.5%) | 0 (0.0%) |
| Total | 124 (61.1%) | 79 (38.9%) |
Female Fertility in Claflin
Fertility by Age in Claflin
| Age Bracket | Women with Births | Births / 1,000 Women |
| 15 to 19 years | 0 (0.0%) | 0.0 |
| 20 to 34 years | 0 (0.0%) | 0.0 |
| 35 to 50 years | 0 (0.0%) | 0.0 |
| Total | 0 (0.0%) | 0.0 |
Fertility by Age by Marriage Status in Claflin
| Age Bracket | Married | Unmarried |
| 15 to 19 years | 0 (0.0%) | 0 (0.0%) |
| 20 to 34 years | 0 (0.0%) | 0 (0.0%) |
| 35 to 50 years | 0 (0.0%) | 0 (0.0%) |
| Total | 0 (0.0%) | 0 (0.0%) |
Fertility by Education in Claflin
| Educational Attainment | Women with Births | Births / 1,000 Women |
| Less than High School | 0 (0.0%) | 0.0 |
| High School Diploma | 0 (0.0%) | 0.0 |
| College or Associate's Degree | 0 (0.0%) | 0.0 |
| Bachelor's Degree | 0 (0.0%) | 0.0 |
| Graduate Degree | 0 (0.0%) | 0.0 |
| Total | 0 (0.0%) | 0.0 |
Fertility by Education by Marriage Status in Claflin
| Educational Attainment | Married | Unmarried |
| Less than High School | 0 (0.0%) | 0 (0.0%) |
| High School Diploma | 0 (0.0%) | 0 (0.0%) |
| College or Associate's Degree | 0 (0.0%) | 0 (0.0%) |
| Bachelor's Degree | 0 (0.0%) | 0 (0.0%) |
| Graduate Degree | 0 (0.0%) | 0 (0.0%) |
| Total | 0 (0.0%) | 0 (0.0%) |
Employment Characteristics in Claflin
Employment by Class of Employer in Claflin
Among the 215 employed individuals in Claflin, private company employees (64 | 29.8%), self-employed (not incorporated) (59 | 27.4%), and not-for-profit organizations (41 | 19.1%) make up the most common classes of employment.
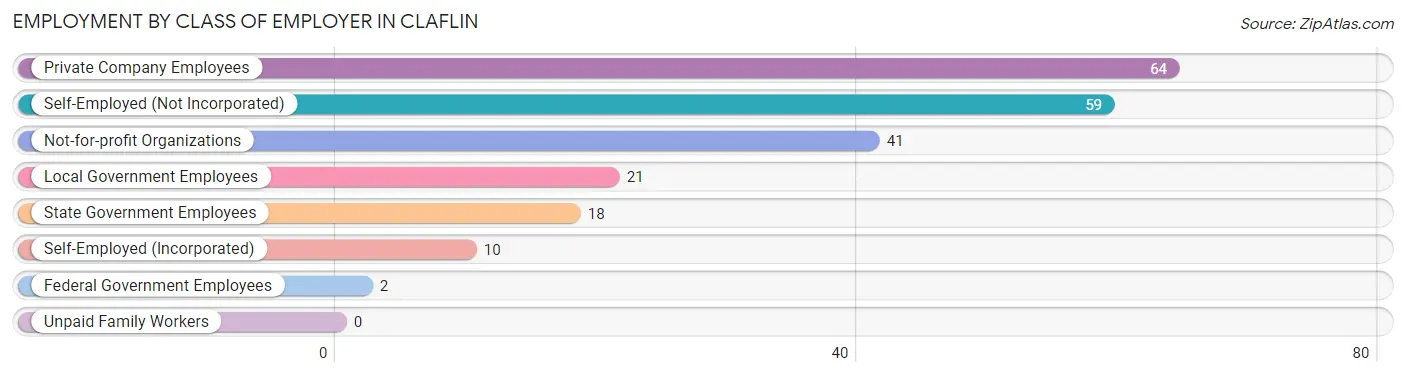
| Employer Class | # Employees | % Employees |
| Private Company Employees | 64 | 29.8% |
| Self-Employed (Incorporated) | 10 | 4.6% |
| Self-Employed (Not Incorporated) | 59 | 27.4% |
| Not-for-profit Organizations | 41 | 19.1% |
| Local Government Employees | 21 | 9.8% |
| State Government Employees | 18 | 8.4% |
| Federal Government Employees | 2 | 0.9% |
| Unpaid Family Workers | 0 | 0.0% |
| Total | 215 | 100.0% |
Employment Status by Age in Claflin
According to the labor force statistics for Claflin, out of the total population over 16 years of age (367), 65.7% or 241 individuals are in the labor force, with 9.5% or 23 of them unemployed. The age group with the highest labor force participation rate is 20 to 24 years, with 100.0% or 15 individuals in the labor force. Within the labor force, the 25 to 29 years age range has the highest percentage of unemployed individuals, with 26.9% or 7 of them being unemployed.
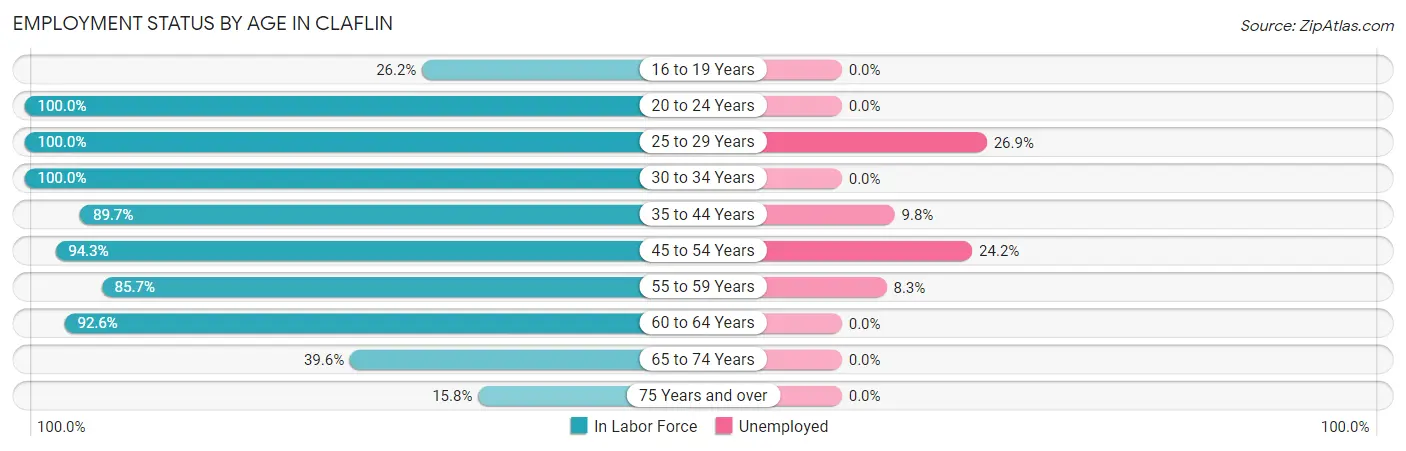
| Age Bracket | In Labor Force | Unemployed |
| 16 to 19 Years | 11 (26.2%) | 0 (0.0%) |
| 20 to 24 Years | 15 (100.0%) | 0 (0.0%) |
| 25 to 29 Years | 26 (100.0%) | 7 (26.9%) |
| 30 to 34 Years | 16 (100.0%) | 0 (0.0%) |
| 35 to 44 Years | 61 (89.7%) | 6 (9.8%) |
| 45 to 54 Years | 33 (94.3%) | 8 (24.2%) |
| 55 to 59 Years | 24 (85.7%) | 2 (8.3%) |
| 60 to 64 Years | 25 (92.6%) | 0 (0.0%) |
| 65 to 74 Years | 21 (39.6%) | 0 (0.0%) |
| 75 Years and over | 9 (15.8%) | 0 (0.0%) |
| Total | 241 (65.7%) | 23 (9.5%) |
Employment Status by Educational Attainment in Claflin
According to labor force statistics for Claflin, 92.5% of individuals (185) out of the total population between 25 and 64 years of age (200) are in the labor force, with 12.4% or 23 of them being unemployed. The group with the highest labor force participation rate are those with the educational attainment of college / associate degree, with 94.7% or 71 individuals in the labor force. Within the labor force, individuals with high school diploma education have the highest percentage of unemployment, with 27.9% or 19 of them being unemployed.
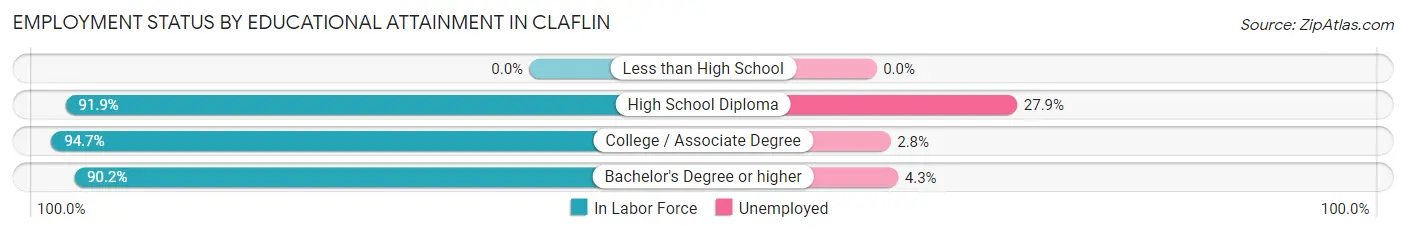
| Educational Attainment | In Labor Force | Unemployed |
| Less than High School | 0 (0.0%) | 0 (0.0%) |
| High School Diploma | 68 (91.9%) | 21 (27.9%) |
| College / Associate Degree | 71 (94.7%) | 2 (2.8%) |
| Bachelor's Degree or higher | 46 (90.2%) | 2 (4.3%) |
| Total | 185 (92.5%) | 25 (12.4%) |
Employment Occupations by Sex in Claflin
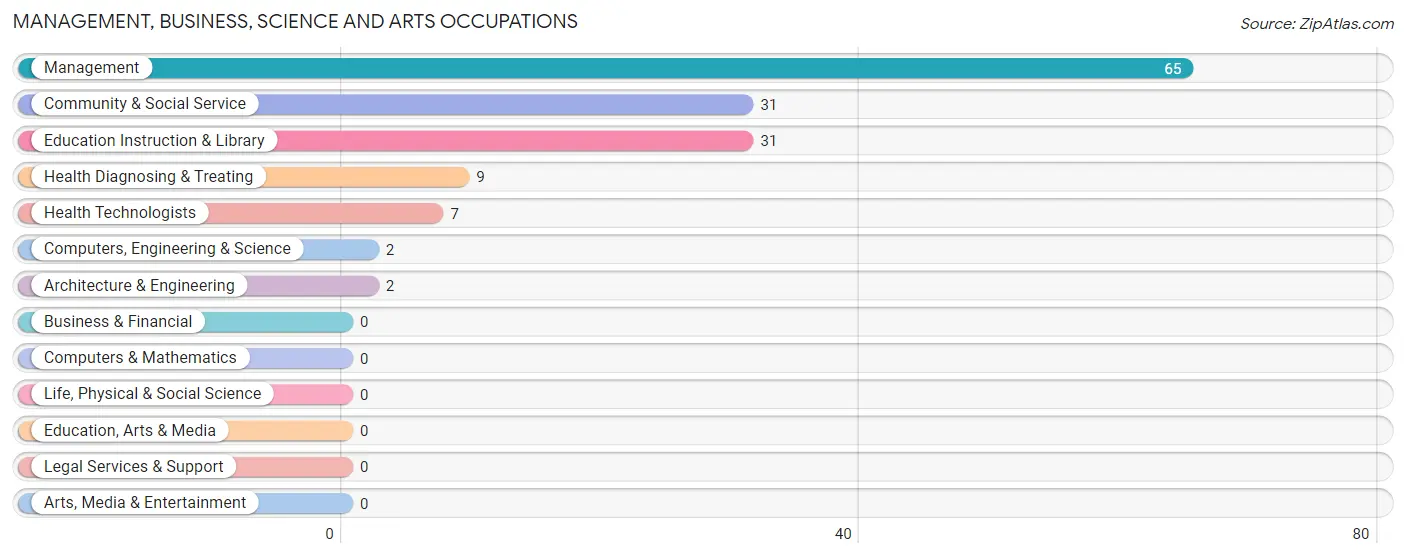
Management, Business, Science and Arts Occupations
The most common Management, Business, Science and Arts occupations in Claflin are Management (65 | 29.8%), Community & Social Service (31 | 14.2%), Education Instruction & Library (31 | 14.2%), Health Diagnosing & Treating (9 | 4.1%), and Health Technologists (7 | 3.2%).
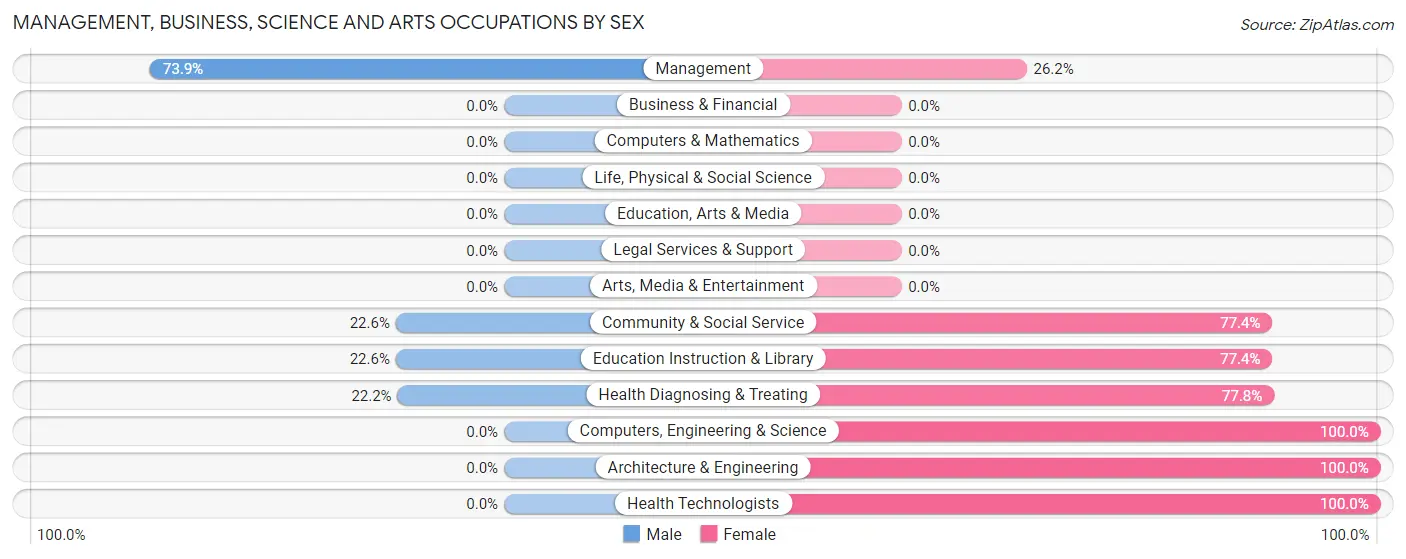
Management, Business, Science and Arts Occupations by Sex
Within the Management, Business, Science and Arts occupations in Claflin, the most male-oriented occupations are Management (73.9%), Community & Social Service (22.6%), and Education Instruction & Library (22.6%), while the most female-oriented occupations are Computers, Engineering & Science (100.0%), Architecture & Engineering (100.0%), and Health Technologists (100.0%).
| Occupation | Male | Female |
| Management | 48 (73.9%) | 17 (26.2%) |
| Business & Financial | 0 (0.0%) | 0 (0.0%) |
| Computers, Engineering & Science | 0 (0.0%) | 2 (100.0%) |
| Computers & Mathematics | 0 (0.0%) | 0 (0.0%) |
| Architecture & Engineering | 0 (0.0%) | 2 (100.0%) |
| Life, Physical & Social Science | 0 (0.0%) | 0 (0.0%) |
| Community & Social Service | 7 (22.6%) | 24 (77.4%) |
| Education, Arts & Media | 0 (0.0%) | 0 (0.0%) |
| Legal Services & Support | 0 (0.0%) | 0 (0.0%) |
| Education Instruction & Library | 7 (22.6%) | 24 (77.4%) |
| Arts, Media & Entertainment | 0 (0.0%) | 0 (0.0%) |
| Health Diagnosing & Treating | 2 (22.2%) | 7 (77.8%) |
| Health Technologists | 0 (0.0%) | 7 (100.0%) |
| Total (Category) | 57 (53.3%) | 50 (46.7%) |
| Total (Overall) | 111 (50.9%) | 107 (49.1%) |
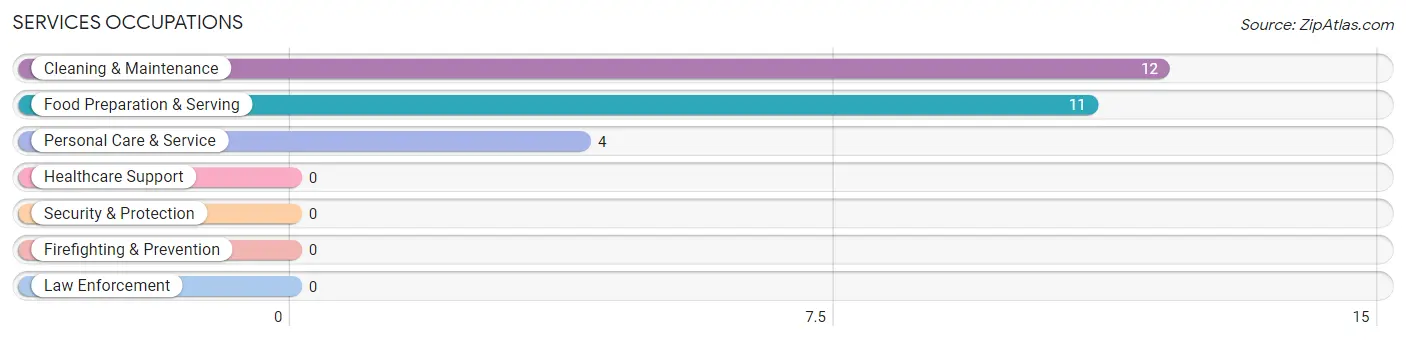
Services Occupations
The most common Services occupations in Claflin are Cleaning & Maintenance (12 | 5.5%), Food Preparation & Serving (11 | 5.1%), and Personal Care & Service (4 | 1.8%).
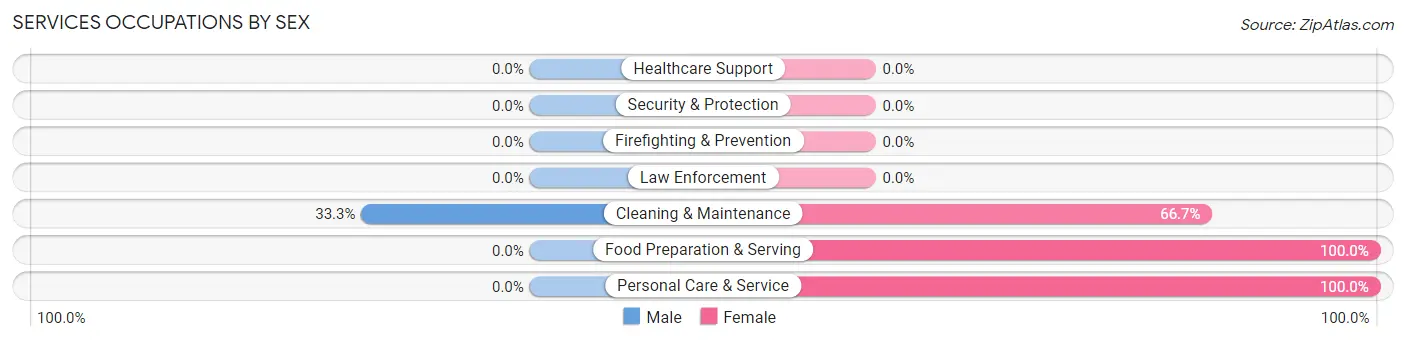
Services Occupations by Sex
| Occupation | Male | Female |
| Healthcare Support | 0 (0.0%) | 0 (0.0%) |
| Security & Protection | 0 (0.0%) | 0 (0.0%) |
| Firefighting & Prevention | 0 (0.0%) | 0 (0.0%) |
| Law Enforcement | 0 (0.0%) | 0 (0.0%) |
| Food Preparation & Serving | 0 (0.0%) | 11 (100.0%) |
| Cleaning & Maintenance | 4 (33.3%) | 8 (66.7%) |
| Personal Care & Service | 0 (0.0%) | 4 (100.0%) |
| Total (Category) | 4 (14.8%) | 23 (85.2%) |
| Total (Overall) | 111 (50.9%) | 107 (49.1%) |
Sales and Office Occupations
The most common Sales and Office occupations in Claflin are Office & Administration (21 | 9.6%), and Sales & Related (7 | 3.2%).
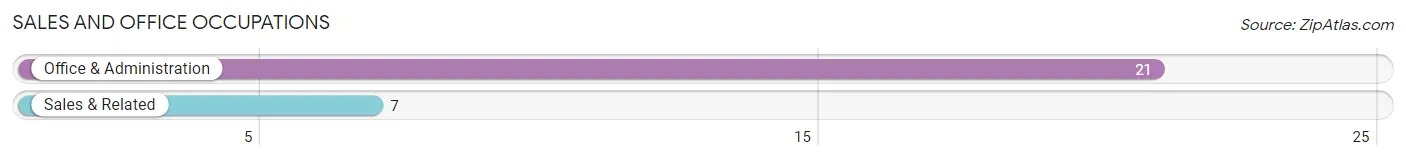
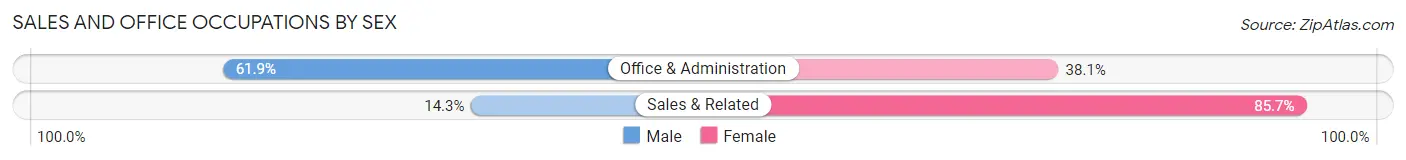
Sales and Office Occupations by Sex
| Occupation | Male | Female |
| Sales & Related | 1 (14.3%) | 6 (85.7%) |
| Office & Administration | 13 (61.9%) | 8 (38.1%) |
| Total (Category) | 14 (50.0%) | 14 (50.0%) |
| Total (Overall) | 111 (50.9%) | 107 (49.1%) |
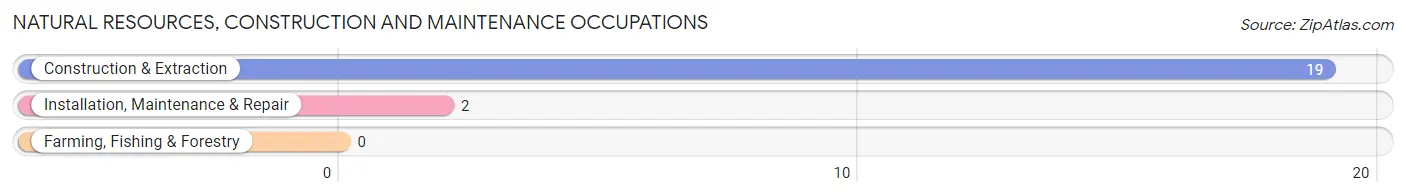
Natural Resources, Construction and Maintenance Occupations
The most common Natural Resources, Construction and Maintenance occupations in Claflin are Construction & Extraction (19 | 8.7%), and Installation, Maintenance & Repair (2 | 0.9%).
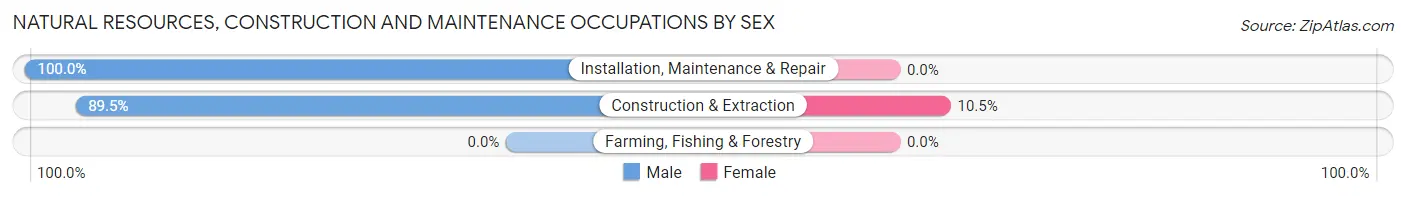
Natural Resources, Construction and Maintenance Occupations by Sex
| Occupation | Male | Female |
| Farming, Fishing & Forestry | 0 (0.0%) | 0 (0.0%) |
| Construction & Extraction | 17 (89.5%) | 2 (10.5%) |
| Installation, Maintenance & Repair | 2 (100.0%) | 0 (0.0%) |
| Total (Category) | 19 (90.5%) | 2 (9.5%) |
| Total (Overall) | 111 (50.9%) | 107 (49.1%) |
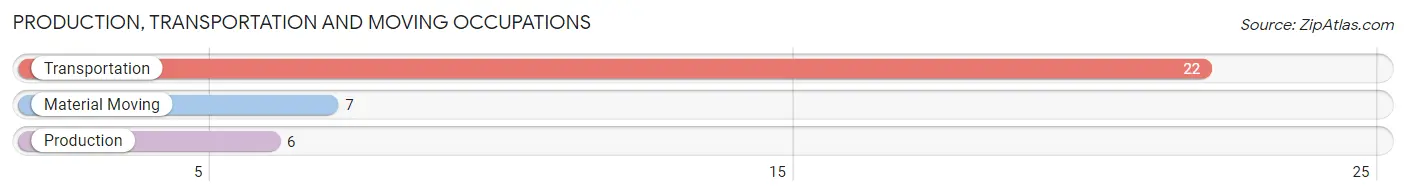
Production, Transportation and Moving Occupations
The most common Production, Transportation and Moving occupations in Claflin are Transportation (22 | 10.1%), Material Moving (7 | 3.2%), and Production (6 | 2.8%).
Production, Transportation and Moving Occupations by Sex
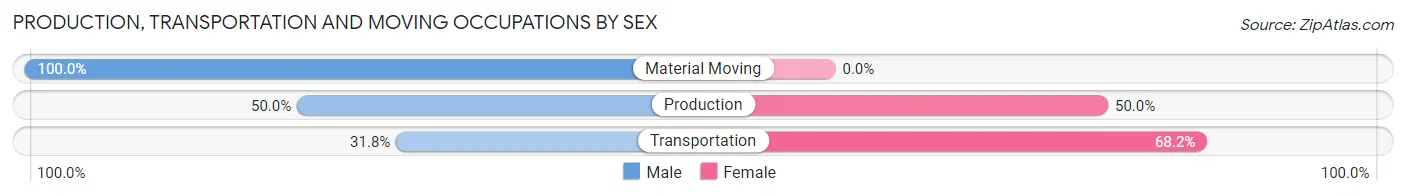
| Occupation | Male | Female |
| Production | 3 (50.0%) | 3 (50.0%) |
| Transportation | 7 (31.8%) | 15 (68.2%) |
| Material Moving | 7 (100.0%) | 0 (0.0%) |
| Total (Category) | 17 (48.6%) | 18 (51.4%) |
| Total (Overall) | 111 (50.9%) | 107 (49.1%) |
Employment Industries by Sex in Claflin
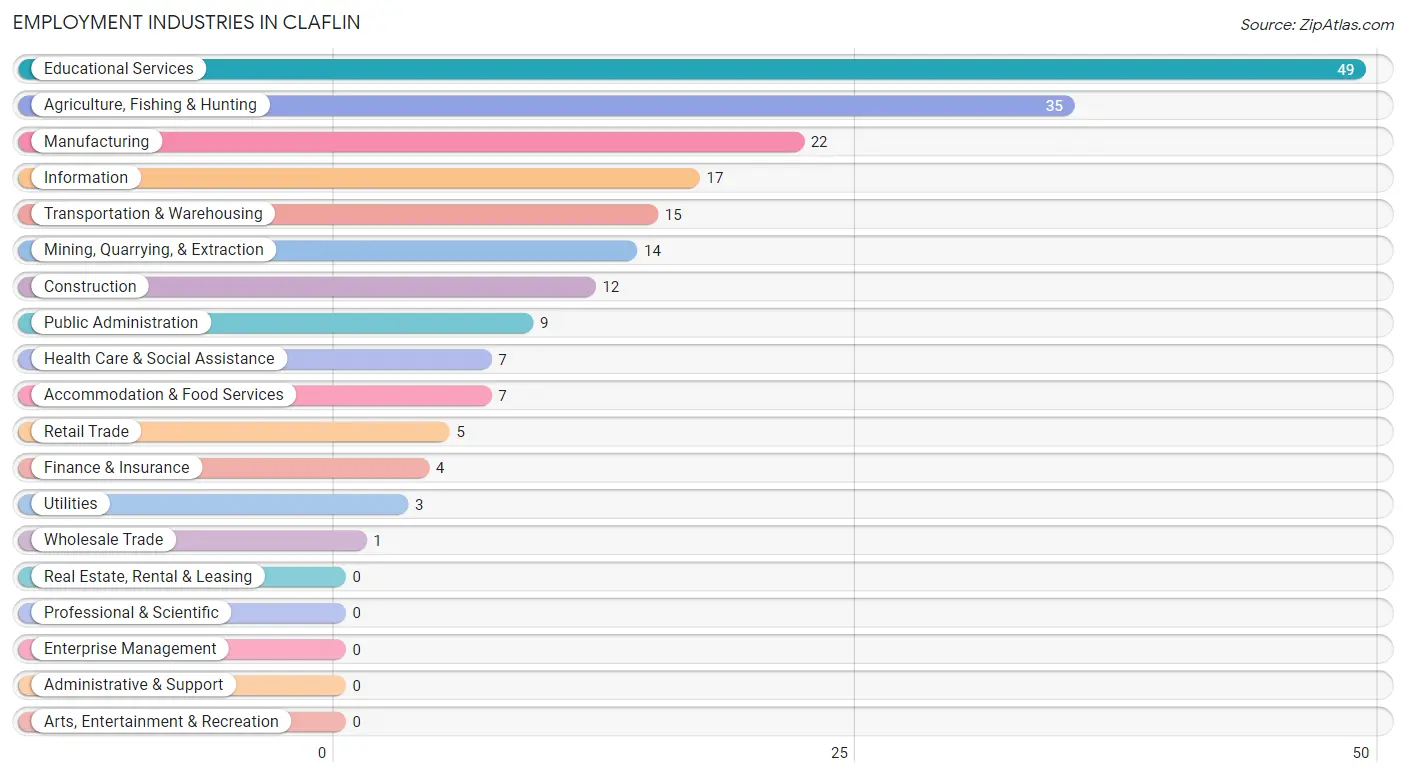
Employment Industries in Claflin
The major employment industries in Claflin include Educational Services (49 | 22.5%), Agriculture, Fishing & Hunting (35 | 16.1%), Manufacturing (22 | 10.1%), Information (17 | 7.8%), and Transportation & Warehousing (15 | 6.9%).
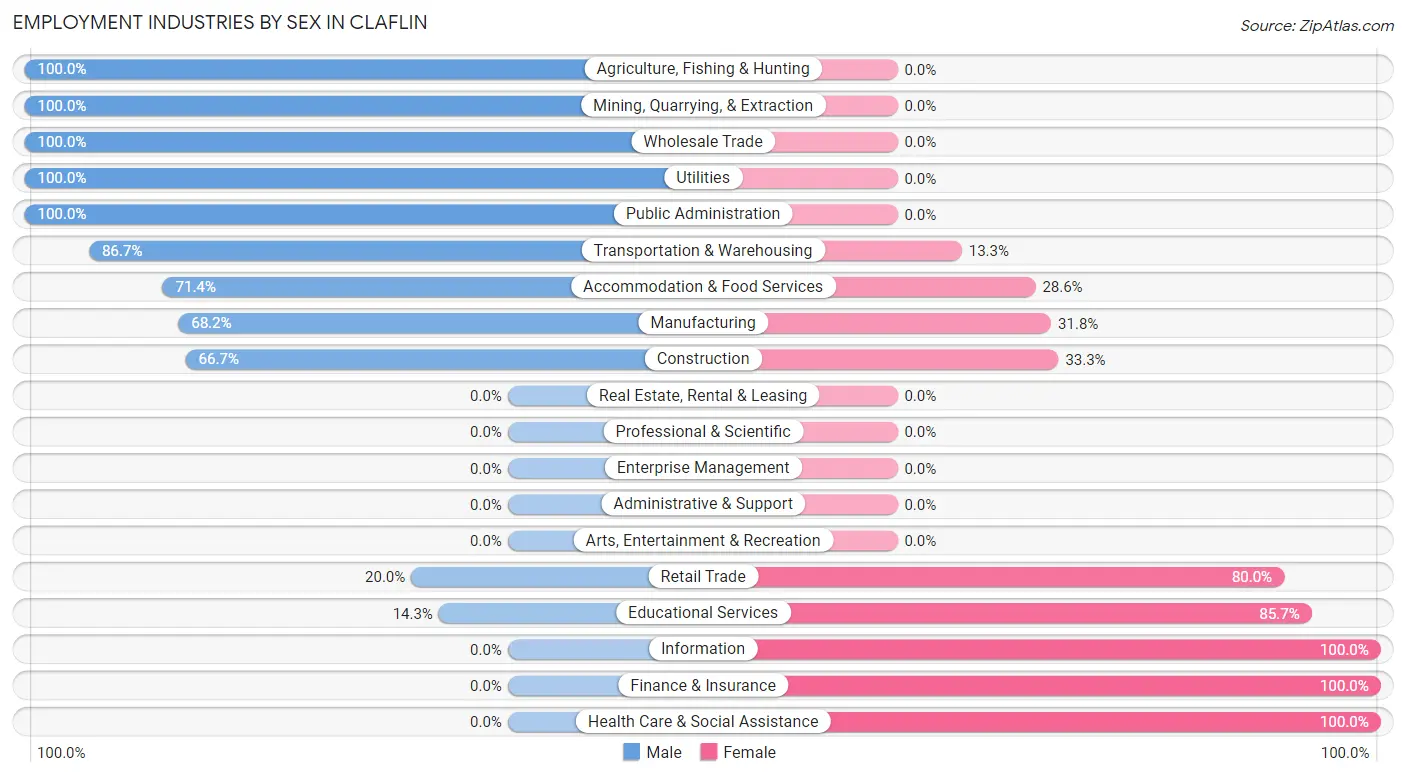
Employment Industries by Sex in Claflin
The Claflin industries that see more men than women are Agriculture, Fishing & Hunting (100.0%), Mining, Quarrying, & Extraction (100.0%), and Wholesale Trade (100.0%), whereas the industries that tend to have a higher number of women are Information (100.0%), Finance & Insurance (100.0%), and Health Care & Social Assistance (100.0%).
| Industry | Male | Female |
| Agriculture, Fishing & Hunting | 35 (100.0%) | 0 (0.0%) |
| Mining, Quarrying, & Extraction | 14 (100.0%) | 0 (0.0%) |
| Construction | 8 (66.7%) | 4 (33.3%) |
| Manufacturing | 15 (68.2%) | 7 (31.8%) |
| Wholesale Trade | 1 (100.0%) | 0 (0.0%) |
| Retail Trade | 1 (20.0%) | 4 (80.0%) |
| Transportation & Warehousing | 13 (86.7%) | 2 (13.3%) |
| Utilities | 3 (100.0%) | 0 (0.0%) |
| Information | 0 (0.0%) | 17 (100.0%) |
| Finance & Insurance | 0 (0.0%) | 4 (100.0%) |
| Real Estate, Rental & Leasing | 0 (0.0%) | 0 (0.0%) |
| Professional & Scientific | 0 (0.0%) | 0 (0.0%) |
| Enterprise Management | 0 (0.0%) | 0 (0.0%) |
| Administrative & Support | 0 (0.0%) | 0 (0.0%) |
| Educational Services | 7 (14.3%) | 42 (85.7%) |
| Health Care & Social Assistance | 0 (0.0%) | 7 (100.0%) |
| Arts, Entertainment & Recreation | 0 (0.0%) | 0 (0.0%) |
| Accommodation & Food Services | 5 (71.4%) | 2 (28.6%) |
| Public Administration | 9 (100.0%) | 0 (0.0%) |
| Total | 111 (50.9%) | 107 (49.1%) |
Education in Claflin
School Enrollment in Claflin
The most common levels of schooling among the 161 students in Claflin are elementary school (53 | 32.9%), high school (49 | 30.4%), and middle school (41 | 25.5%).
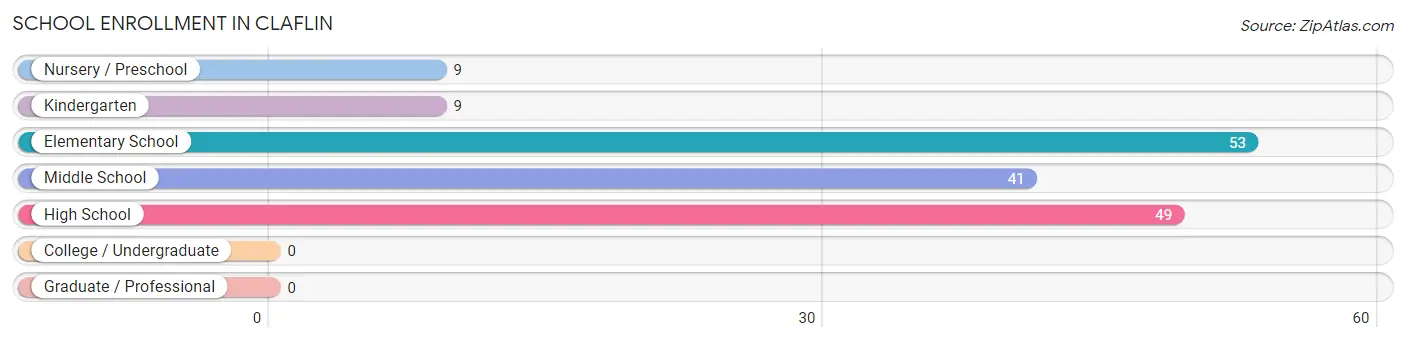
| School Level | # Students | % Students |
| Nursery / Preschool | 9 | 5.6% |
| Kindergarten | 9 | 5.6% |
| Elementary School | 53 | 32.9% |
| Middle School | 41 | 25.5% |
| High School | 49 | 30.4% |
| College / Undergraduate | 0 | 0.0% |
| Graduate / Professional | 0 | 0.0% |
| Total | 161 | 100.0% |
School Enrollment by Age by Funding Source in Claflin
Out of a total of 161 students who are enrolled in schools in Claflin, 4 (2.5%) attend a private institution, while the remaining 157 (97.5%) are enrolled in public schools. The age group of 3 to 4 year olds has the highest likelihood of being enrolled in private schools, with 2 (100.0% in the age bracket) enrolled. Conversely, the age group of 10 to 14 year olds has the lowest likelihood of being enrolled in a private school, with 46 (100.0% in the age bracket) attending a public institution.
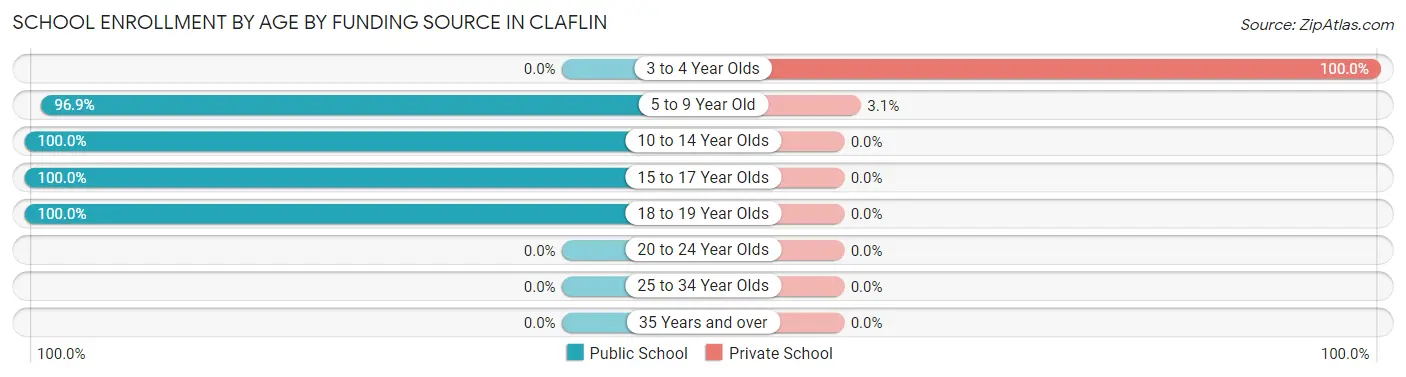
| Age Bracket | Public School | Private School |
| 3 to 4 Year Olds | 0 (0.0%) | 2 (100.0%) |
| 5 to 9 Year Old | 62 (96.9%) | 2 (3.1%) |
| 10 to 14 Year Olds | 46 (100.0%) | 0 (0.0%) |
| 15 to 17 Year Olds | 44 (100.0%) | 0 (0.0%) |
| 18 to 19 Year Olds | 5 (100.0%) | 0 (0.0%) |
| 20 to 24 Year Olds | 0 (0.0%) | 0 (0.0%) |
| 25 to 34 Year Olds | 0 (0.0%) | 0 (0.0%) |
| 35 Years and over | 0 (0.0%) | 0 (0.0%) |
| Total | 157 (97.5%) | 4 (2.5%) |
Educational Attainment by Field of Study in Claflin
Business (19 | 28.8%), education (17 | 25.8%), liberal arts & history (9 | 13.6%), science & technology (7 | 10.6%), and computers & mathematics (3 | 4.5%) are the most common fields of study among 66 individuals in Claflin who have obtained a bachelor's degree or higher.
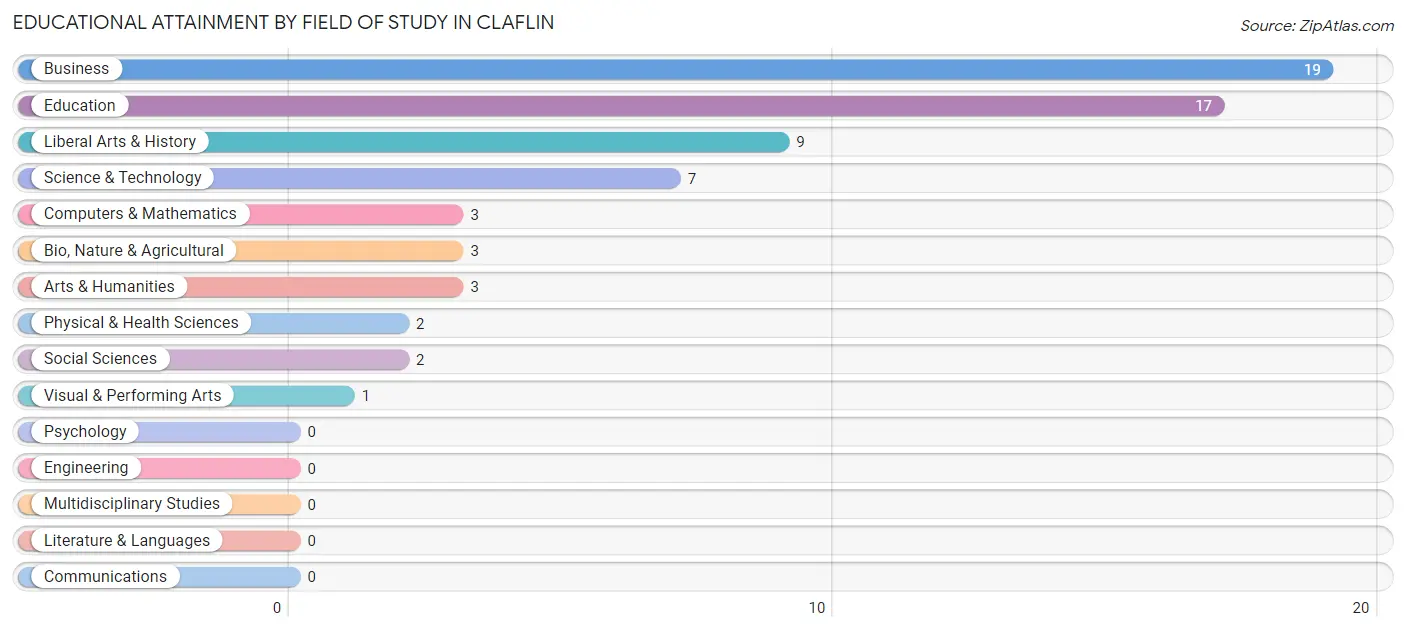
| Field of Study | # Graduates | % Graduates |
| Computers & Mathematics | 3 | 4.5% |
| Bio, Nature & Agricultural | 3 | 4.5% |
| Physical & Health Sciences | 2 | 3.0% |
| Psychology | 0 | 0.0% |
| Social Sciences | 2 | 3.0% |
| Engineering | 0 | 0.0% |
| Multidisciplinary Studies | 0 | 0.0% |
| Science & Technology | 7 | 10.6% |
| Business | 19 | 28.8% |
| Education | 17 | 25.8% |
| Literature & Languages | 0 | 0.0% |
| Liberal Arts & History | 9 | 13.6% |
| Visual & Performing Arts | 1 | 1.5% |
| Communications | 0 | 0.0% |
| Arts & Humanities | 3 | 4.5% |
| Total | 66 | 100.0% |
Transportation & Commute in Claflin
Vehicle Availability by Sex in Claflin
The most prevalent vehicle ownership categories in Claflin are males with 3 vehicles (59, accounting for 53.1%) and females with 3 vehicles (27, making up 56.7%).
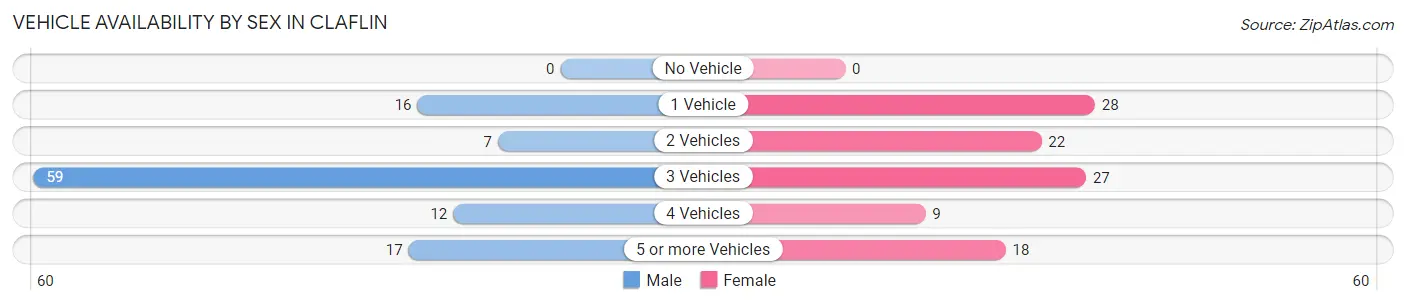
| Vehicles Available | Male | Female |
| No Vehicle | 0 (0.0%) | 0 (0.0%) |
| 1 Vehicle | 16 (14.4%) | 28 (26.9%) |
| 2 Vehicles | 7 (6.3%) | 22 (21.1%) |
| 3 Vehicles | 59 (53.1%) | 27 (26.0%) |
| 4 Vehicles | 12 (10.8%) | 9 (8.6%) |
| 5 or more Vehicles | 17 (15.3%) | 18 (17.3%) |
| Total | 111 (100.0%) | 104 (100.0%) |
Commute Time in Claflin
The most frequently occuring commute durations in Claflin are 20 to 24 minutes (69 commuters, 34.7%), 5 to 9 minutes (33 commuters, 16.6%), and less than 5 minutes (30 commuters, 15.1%).
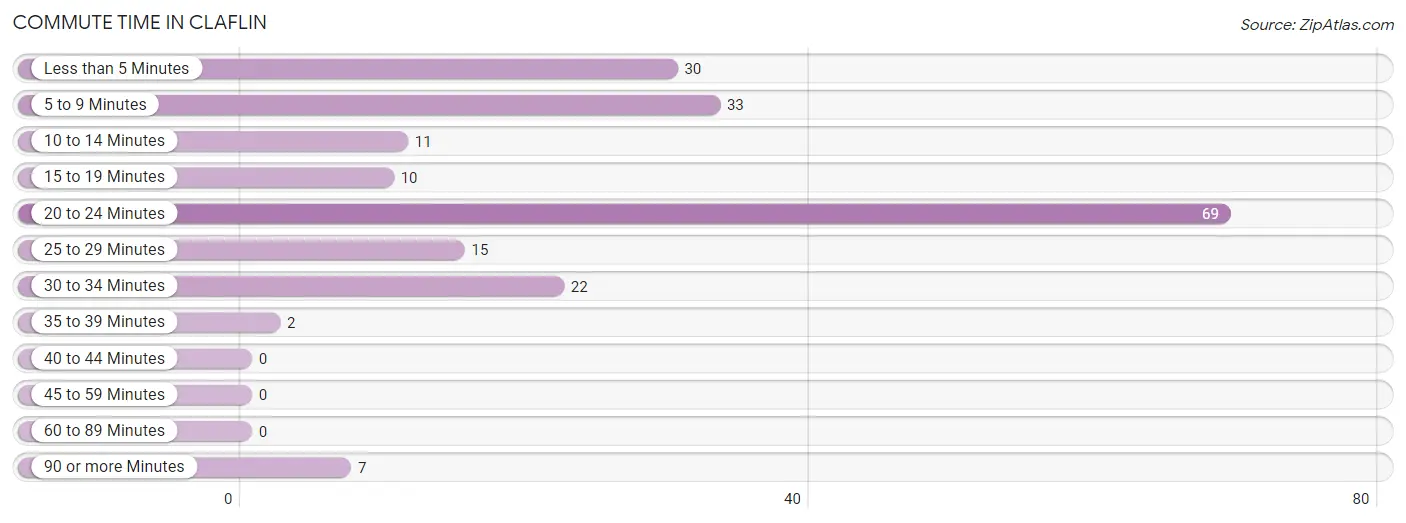
| Commute Time | # Commuters | % Commuters |
| Less than 5 Minutes | 30 | 15.1% |
| 5 to 9 Minutes | 33 | 16.6% |
| 10 to 14 Minutes | 11 | 5.5% |
| 15 to 19 Minutes | 10 | 5.0% |
| 20 to 24 Minutes | 69 | 34.7% |
| 25 to 29 Minutes | 15 | 7.5% |
| 30 to 34 Minutes | 22 | 11.1% |
| 35 to 39 Minutes | 2 | 1.0% |
| 40 to 44 Minutes | 0 | 0.0% |
| 45 to 59 Minutes | 0 | 0.0% |
| 60 to 89 Minutes | 0 | 0.0% |
| 90 or more Minutes | 7 | 3.5% |
Commute Time by Sex in Claflin
The most common commute times in Claflin are 20 to 24 minutes (50 commuters, 50.5%) for males and 20 to 24 minutes (19 commuters, 19.0%) for females.
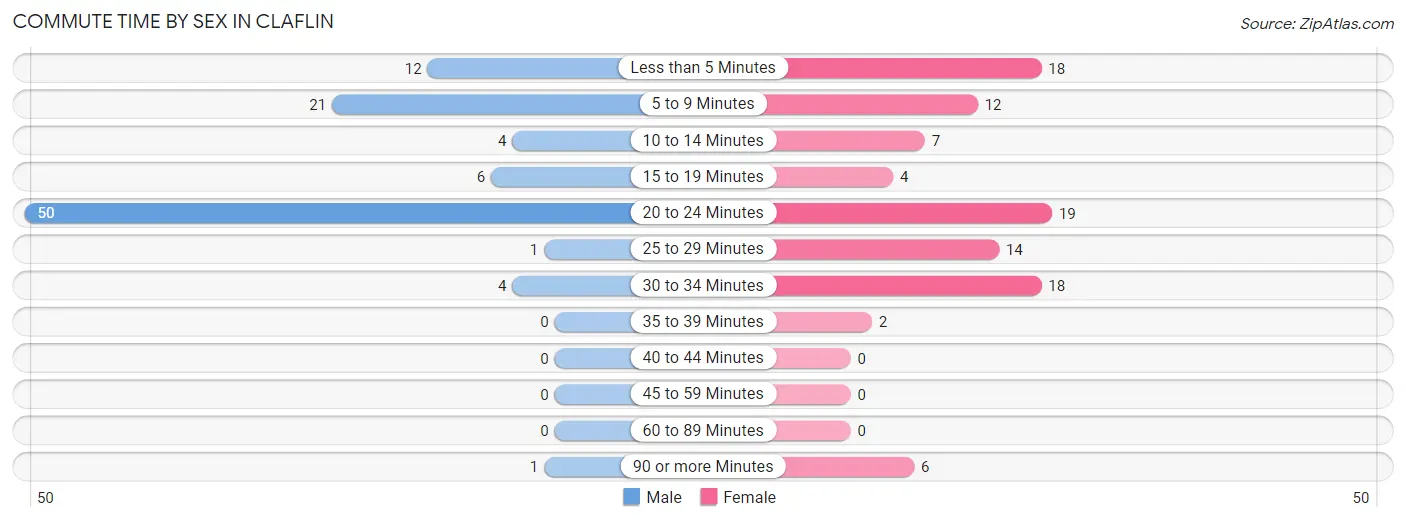
| Commute Time | Male | Female |
| Less than 5 Minutes | 12 (12.1%) | 18 (18.0%) |
| 5 to 9 Minutes | 21 (21.2%) | 12 (12.0%) |
| 10 to 14 Minutes | 4 (4.0%) | 7 (7.0%) |
| 15 to 19 Minutes | 6 (6.1%) | 4 (4.0%) |
| 20 to 24 Minutes | 50 (50.5%) | 19 (19.0%) |
| 25 to 29 Minutes | 1 (1.0%) | 14 (14.0%) |
| 30 to 34 Minutes | 4 (4.0%) | 18 (18.0%) |
| 35 to 39 Minutes | 0 (0.0%) | 2 (2.0%) |
| 40 to 44 Minutes | 0 (0.0%) | 0 (0.0%) |
| 45 to 59 Minutes | 0 (0.0%) | 0 (0.0%) |
| 60 to 89 Minutes | 0 (0.0%) | 0 (0.0%) |
| 90 or more Minutes | 1 (1.0%) | 6 (6.0%) |
Time of Departure to Work by Sex in Claflin
The most frequent times of departure to work in Claflin are 7:00 AM to 7:29 AM (42, 42.4%) for males and 7:30 AM to 7:59 AM (23, 23.0%) for females.
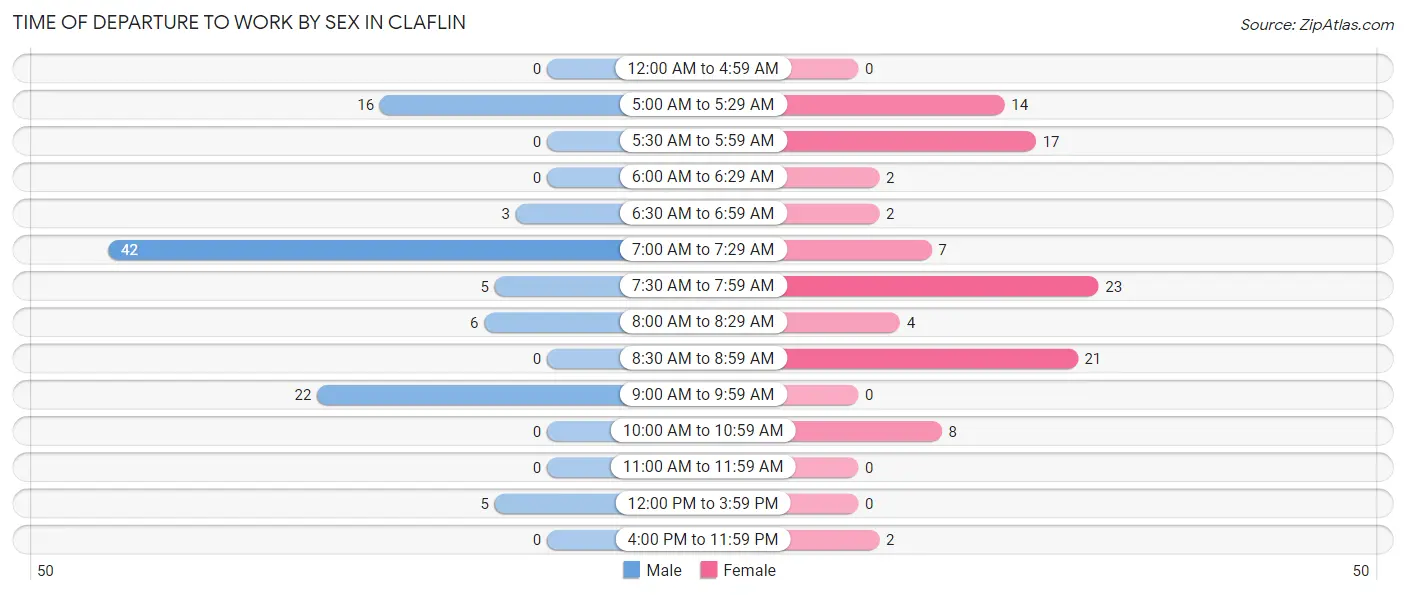
| Time of Departure | Male | Female |
| 12:00 AM to 4:59 AM | 0 (0.0%) | 0 (0.0%) |
| 5:00 AM to 5:29 AM | 16 (16.2%) | 14 (14.0%) |
| 5:30 AM to 5:59 AM | 0 (0.0%) | 17 (17.0%) |
| 6:00 AM to 6:29 AM | 0 (0.0%) | 2 (2.0%) |
| 6:30 AM to 6:59 AM | 3 (3.0%) | 2 (2.0%) |
| 7:00 AM to 7:29 AM | 42 (42.4%) | 7 (7.0%) |
| 7:30 AM to 7:59 AM | 5 (5.1%) | 23 (23.0%) |
| 8:00 AM to 8:29 AM | 6 (6.1%) | 4 (4.0%) |
| 8:30 AM to 8:59 AM | 0 (0.0%) | 21 (21.0%) |
| 9:00 AM to 9:59 AM | 22 (22.2%) | 0 (0.0%) |
| 10:00 AM to 10:59 AM | 0 (0.0%) | 8 (8.0%) |
| 11:00 AM to 11:59 AM | 0 (0.0%) | 0 (0.0%) |
| 12:00 PM to 3:59 PM | 5 (5.1%) | 0 (0.0%) |
| 4:00 PM to 11:59 PM | 0 (0.0%) | 2 (2.0%) |
| Total | 99 (100.0%) | 100 (100.0%) |
Housing Occupancy in Claflin
Occupancy by Ownership in Claflin
Of the total 203 dwellings in Claflin, owner-occupied units account for 169 (83.3%), while renter-occupied units make up 34 (16.8%).
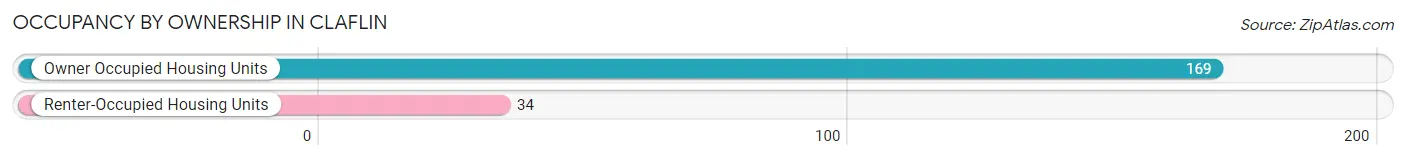
| Occupancy | # Housing Units | % Housing Units |
| Owner Occupied Housing Units | 169 | 83.3% |
| Renter-Occupied Housing Units | 34 | 16.8% |
| Total Occupied Housing Units | 203 | 100.0% |
Occupancy by Household Size in Claflin
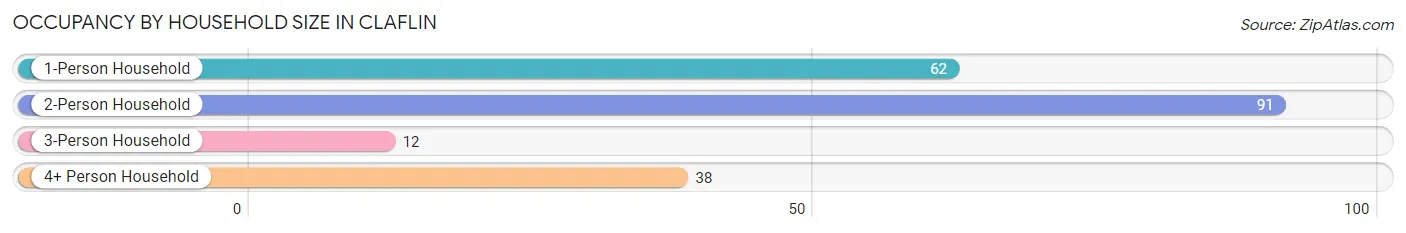
| Household Size | # Housing Units | % Housing Units |
| 1-Person Household | 62 | 30.5% |
| 2-Person Household | 91 | 44.8% |
| 3-Person Household | 12 | 5.9% |
| 4+ Person Household | 38 | 18.7% |
| Total Housing Units | 203 | 100.0% |
Occupancy by Ownership by Household Size in Claflin
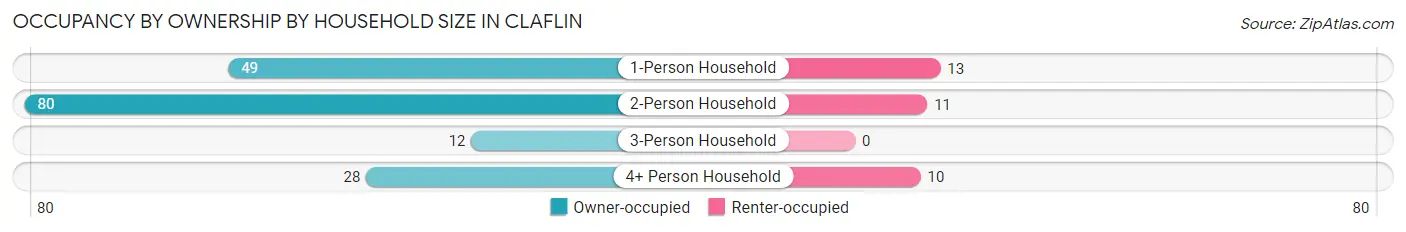
| Household Size | Owner-occupied | Renter-occupied |
| 1-Person Household | 49 (79.0%) | 13 (21.0%) |
| 2-Person Household | 80 (87.9%) | 11 (12.1%) |
| 3-Person Household | 12 (100.0%) | 0 (0.0%) |
| 4+ Person Household | 28 (73.7%) | 10 (26.3%) |
| Total Housing Units | 169 (83.3%) | 34 (16.8%) |
Occupancy by Educational Attainment in Claflin
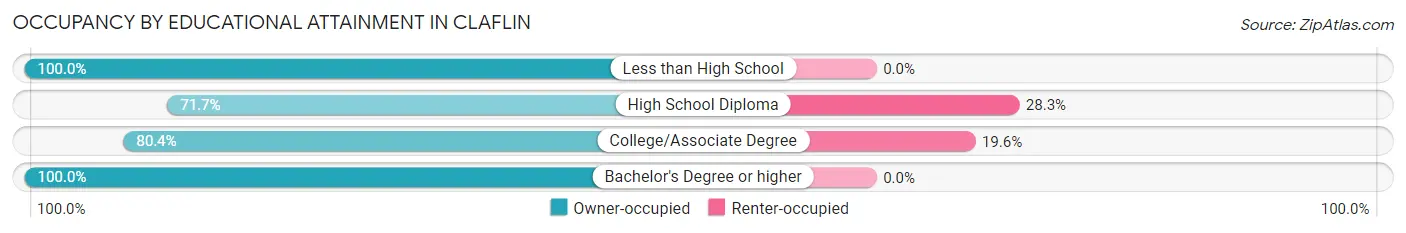
| Household Size | Owner-occupied | Renter-occupied |
| Less than High School | 7 (100.0%) | 0 (0.0%) |
| High School Diploma | 38 (71.7%) | 15 (28.3%) |
| College/Associate Degree | 78 (80.4%) | 19 (19.6%) |
| Bachelor's Degree or higher | 46 (100.0%) | 0 (0.0%) |
Occupancy by Age of Householder in Claflin
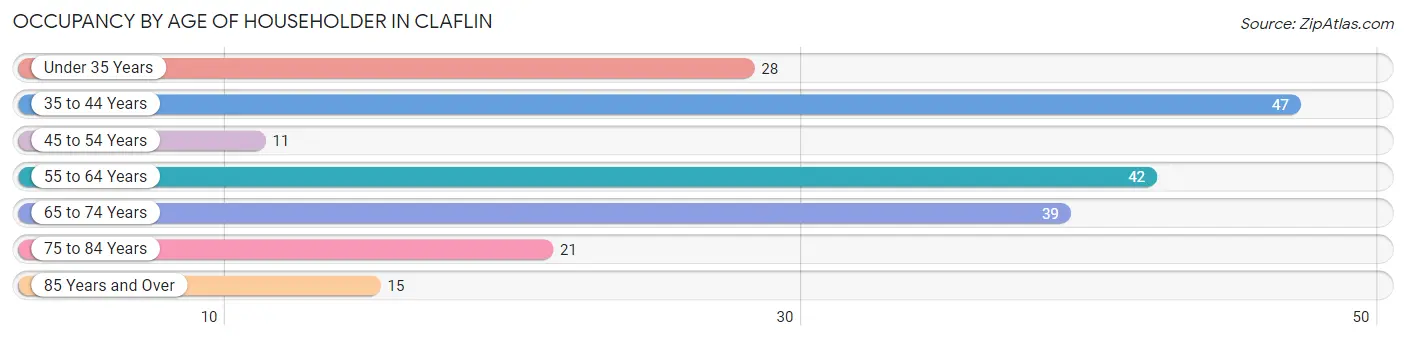
| Age Bracket | # Households | % Households |
| Under 35 Years | 28 | 13.8% |
| 35 to 44 Years | 47 | 23.2% |
| 45 to 54 Years | 11 | 5.4% |
| 55 to 64 Years | 42 | 20.7% |
| 65 to 74 Years | 39 | 19.2% |
| 75 to 84 Years | 21 | 10.3% |
| 85 Years and Over | 15 | 7.4% |
| Total | 203 | 100.0% |
Housing Finances in Claflin
Median Income by Occupancy in Claflin
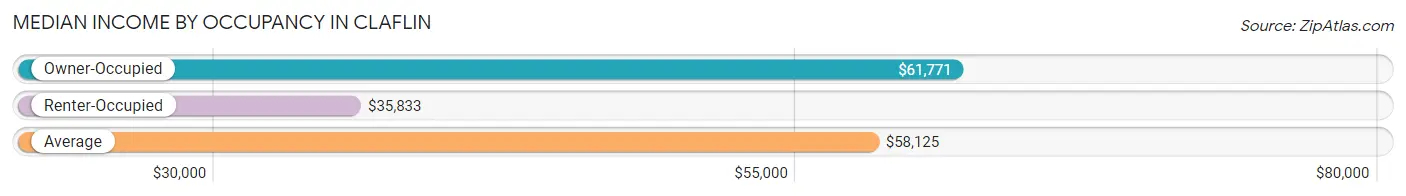
| Occupancy Type | # Households | Median Income |
| Owner-Occupied | 169 (83.3%) | $61,771 |
| Renter-Occupied | 34 (16.8%) | $35,833 |
| Average | 203 (100.0%) | $58,125 |
Occupancy by Householder Income Bracket in Claflin
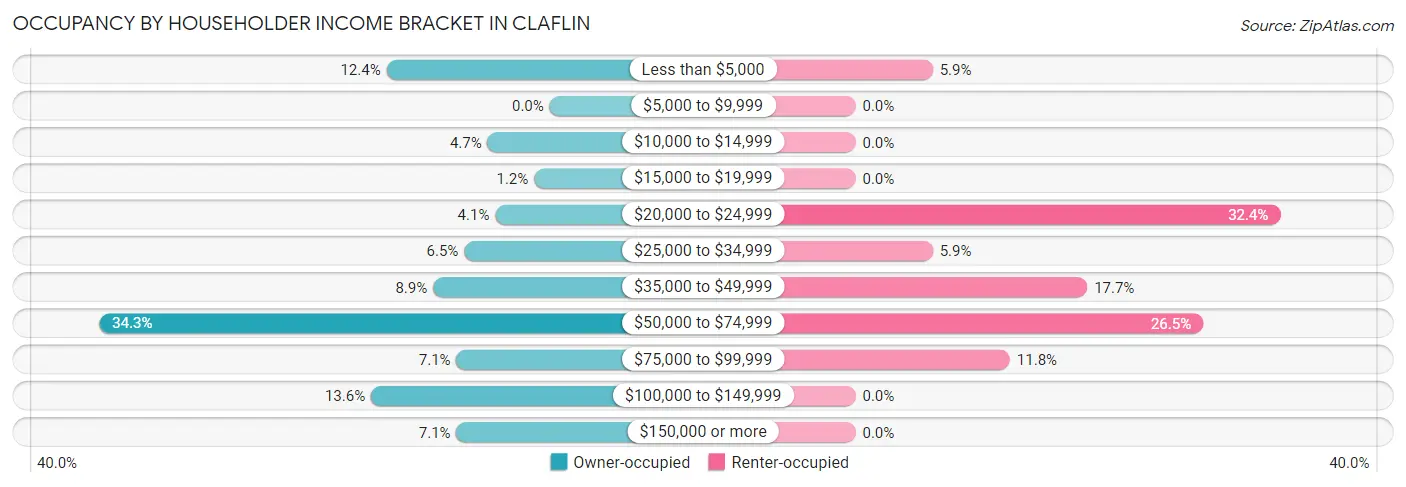
| Income Bracket | Owner-occupied | Renter-occupied |
| Less than $5,000 | 21 (12.4%) | 2 (5.9%) |
| $5,000 to $9,999 | 0 (0.0%) | 0 (0.0%) |
| $10,000 to $14,999 | 8 (4.7%) | 0 (0.0%) |
| $15,000 to $19,999 | 2 (1.2%) | 0 (0.0%) |
| $20,000 to $24,999 | 7 (4.1%) | 11 (32.4%) |
| $25,000 to $34,999 | 11 (6.5%) | 2 (5.9%) |
| $35,000 to $49,999 | 15 (8.9%) | 6 (17.6%) |
| $50,000 to $74,999 | 58 (34.3%) | 9 (26.5%) |
| $75,000 to $99,999 | 12 (7.1%) | 4 (11.8%) |
| $100,000 to $149,999 | 23 (13.6%) | 0 (0.0%) |
| $150,000 or more | 12 (7.1%) | 0 (0.0%) |
| Total | 169 (100.0%) | 34 (100.0%) |
Monthly Housing Cost Tiers in Claflin
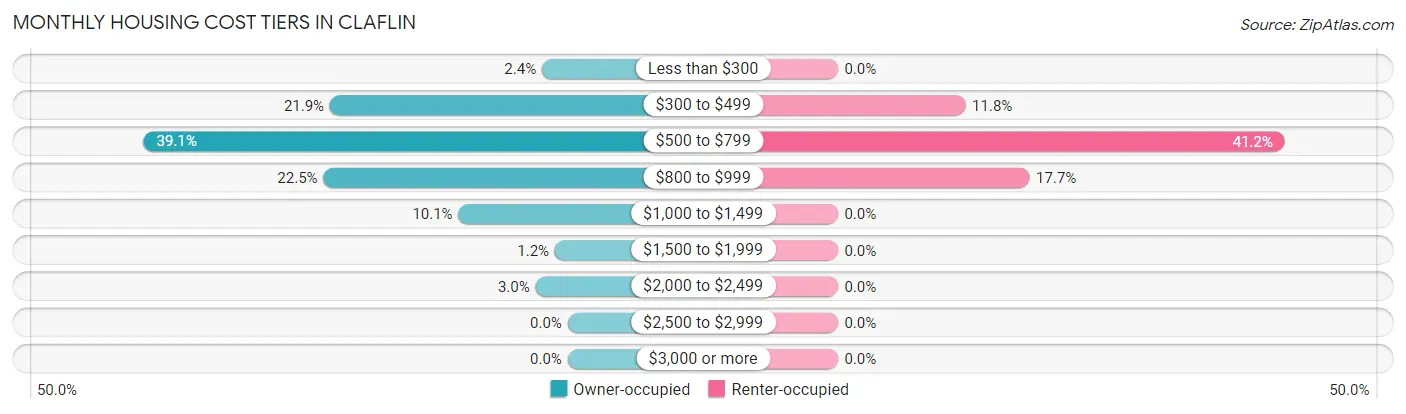
| Monthly Cost | Owner-occupied | Renter-occupied |
| Less than $300 | 4 (2.4%) | 0 (0.0%) |
| $300 to $499 | 37 (21.9%) | 4 (11.8%) |
| $500 to $799 | 66 (39.1%) | 14 (41.2%) |
| $800 to $999 | 38 (22.5%) | 6 (17.6%) |
| $1,000 to $1,499 | 17 (10.1%) | 0 (0.0%) |
| $1,500 to $1,999 | 2 (1.2%) | 0 (0.0%) |
| $2,000 to $2,499 | 5 (3.0%) | 0 (0.0%) |
| $2,500 to $2,999 | 0 (0.0%) | 0 (0.0%) |
| $3,000 or more | 0 (0.0%) | 0 (0.0%) |
| Total | 169 (100.0%) | 34 (100.0%) |
Physical Housing Characteristics in Claflin
Housing Structures in Claflin
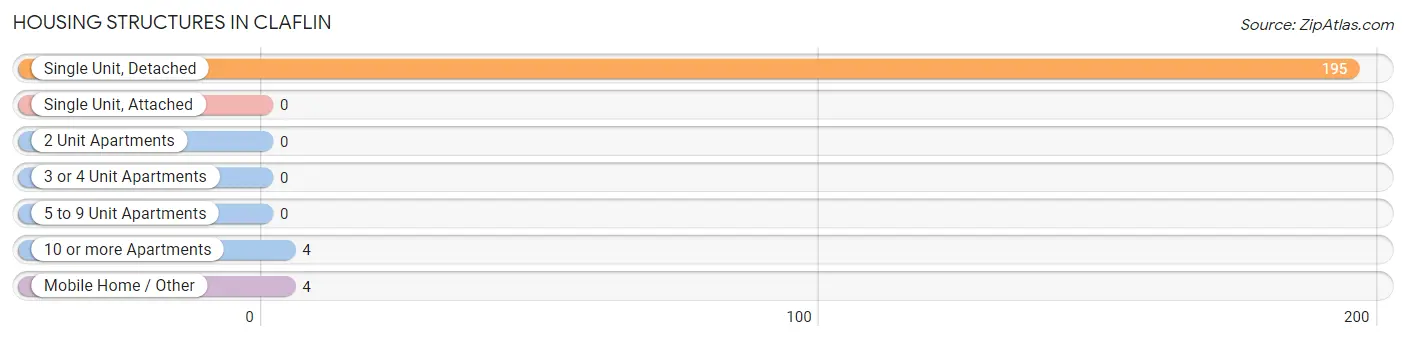
| Structure Type | # Housing Units | % Housing Units |
| Single Unit, Detached | 195 | 96.1% |
| Single Unit, Attached | 0 | 0.0% |
| 2 Unit Apartments | 0 | 0.0% |
| 3 or 4 Unit Apartments | 0 | 0.0% |
| 5 to 9 Unit Apartments | 0 | 0.0% |
| 10 or more Apartments | 4 | 2.0% |
| Mobile Home / Other | 4 | 2.0% |
| Total | 203 | 100.0% |
Housing Structures by Occupancy in Claflin
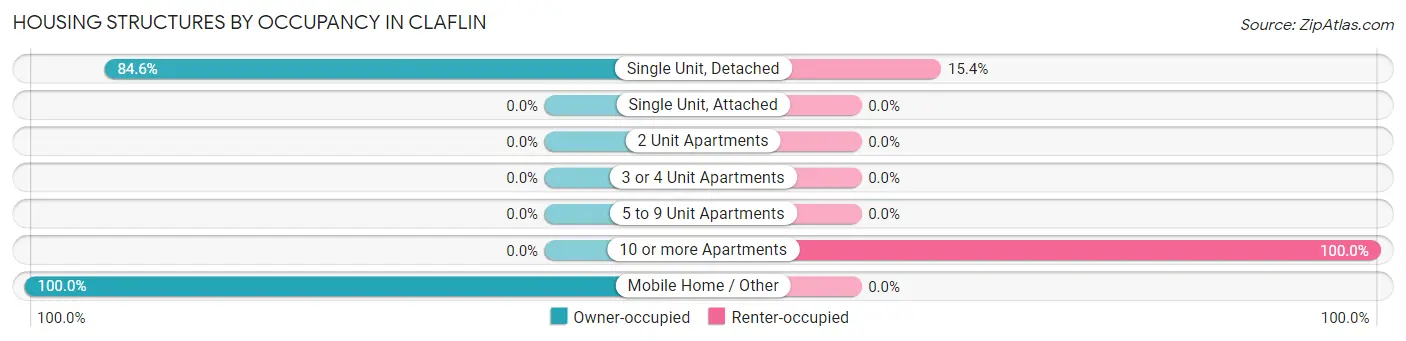
| Structure Type | Owner-occupied | Renter-occupied |
| Single Unit, Detached | 165 (84.6%) | 30 (15.4%) |
| Single Unit, Attached | 0 (0.0%) | 0 (0.0%) |
| 2 Unit Apartments | 0 (0.0%) | 0 (0.0%) |
| 3 or 4 Unit Apartments | 0 (0.0%) | 0 (0.0%) |
| 5 to 9 Unit Apartments | 0 (0.0%) | 0 (0.0%) |
| 10 or more Apartments | 0 (0.0%) | 4 (100.0%) |
| Mobile Home / Other | 4 (100.0%) | 0 (0.0%) |
| Total | 169 (83.3%) | 34 (16.8%) |
Housing Structures by Number of Rooms in Claflin
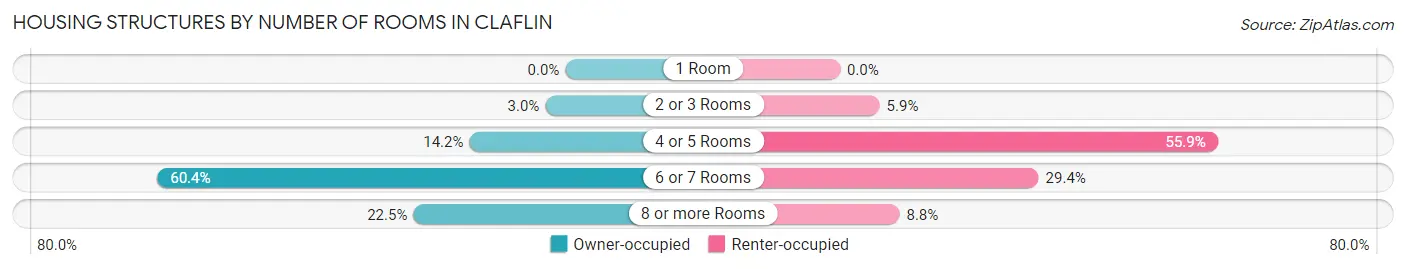
| Number of Rooms | Owner-occupied | Renter-occupied |
| 1 Room | 0 (0.0%) | 0 (0.0%) |
| 2 or 3 Rooms | 5 (3.0%) | 2 (5.9%) |
| 4 or 5 Rooms | 24 (14.2%) | 19 (55.9%) |
| 6 or 7 Rooms | 102 (60.4%) | 10 (29.4%) |
| 8 or more Rooms | 38 (22.5%) | 3 (8.8%) |
| Total | 169 (100.0%) | 34 (100.0%) |
Housing Structure by Heating Type in Claflin
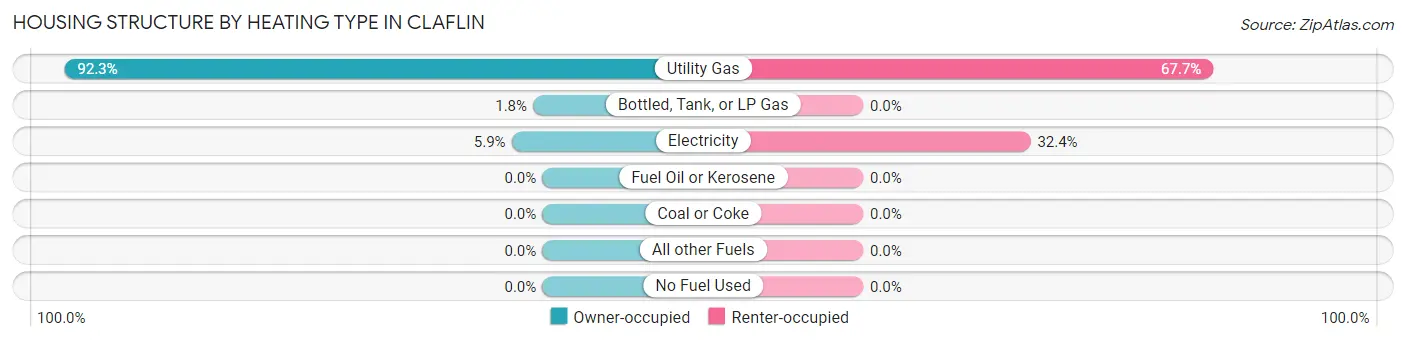
| Heating Type | Owner-occupied | Renter-occupied |
| Utility Gas | 156 (92.3%) | 23 (67.6%) |
| Bottled, Tank, or LP Gas | 3 (1.8%) | 0 (0.0%) |
| Electricity | 10 (5.9%) | 11 (32.4%) |
| Fuel Oil or Kerosene | 0 (0.0%) | 0 (0.0%) |
| Coal or Coke | 0 (0.0%) | 0 (0.0%) |
| All other Fuels | 0 (0.0%) | 0 (0.0%) |
| No Fuel Used | 0 (0.0%) | 0 (0.0%) |
| Total | 169 (100.0%) | 34 (100.0%) |
Household Vehicle Usage in Claflin
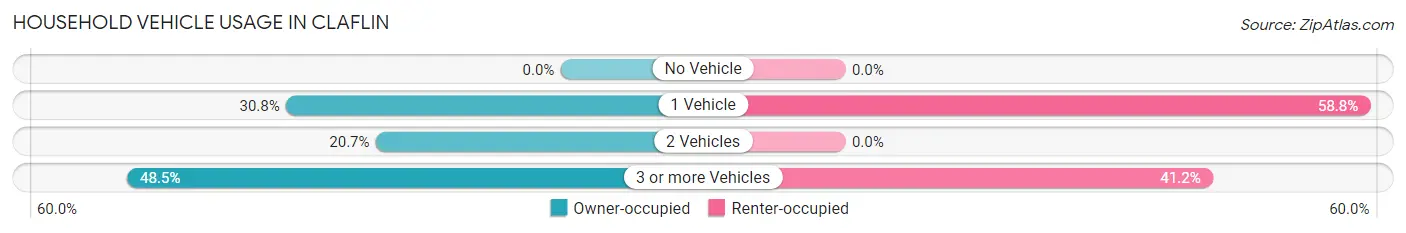
| Vehicles per Household | Owner-occupied | Renter-occupied |
| No Vehicle | 0 (0.0%) | 0 (0.0%) |
| 1 Vehicle | 52 (30.8%) | 20 (58.8%) |
| 2 Vehicles | 35 (20.7%) | 0 (0.0%) |
| 3 or more Vehicles | 82 (48.5%) | 14 (41.2%) |
| Total | 169 (100.0%) | 34 (100.0%) |
Real Estate & Mortgages in Claflin
Real Estate and Mortgage Overview in Claflin
| Characteristic | Without Mortgage | With Mortgage |
| Housing Units | 98 | 71 |
| Median Property Value | $106,300 | $86,100 |
| Median Household Income | $73,529 | $1 |
| Monthly Housing Costs | $521 | $0 |
| Real Estate Taxes | $1,961 | $0 |
Property Value by Mortgage Status in Claflin
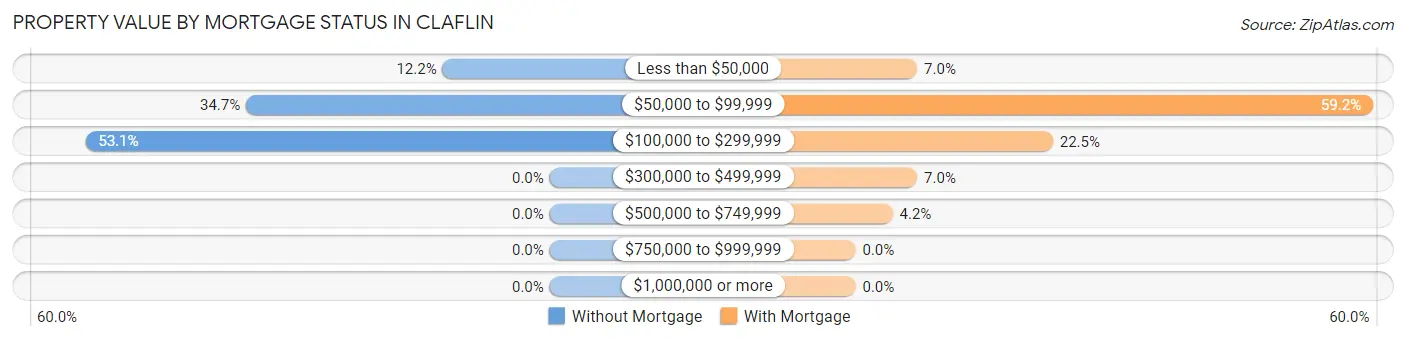
| Property Value | Without Mortgage | With Mortgage |
| Less than $50,000 | 12 (12.2%) | 5 (7.0%) |
| $50,000 to $99,999 | 34 (34.7%) | 42 (59.2%) |
| $100,000 to $299,999 | 52 (53.1%) | 16 (22.5%) |
| $300,000 to $499,999 | 0 (0.0%) | 5 (7.0%) |
| $500,000 to $749,999 | 0 (0.0%) | 3 (4.2%) |
| $750,000 to $999,999 | 0 (0.0%) | 0 (0.0%) |
| $1,000,000 or more | 0 (0.0%) | 0 (0.0%) |
| Total | 98 (100.0%) | 71 (100.0%) |
Household Income by Mortgage Status in Claflin
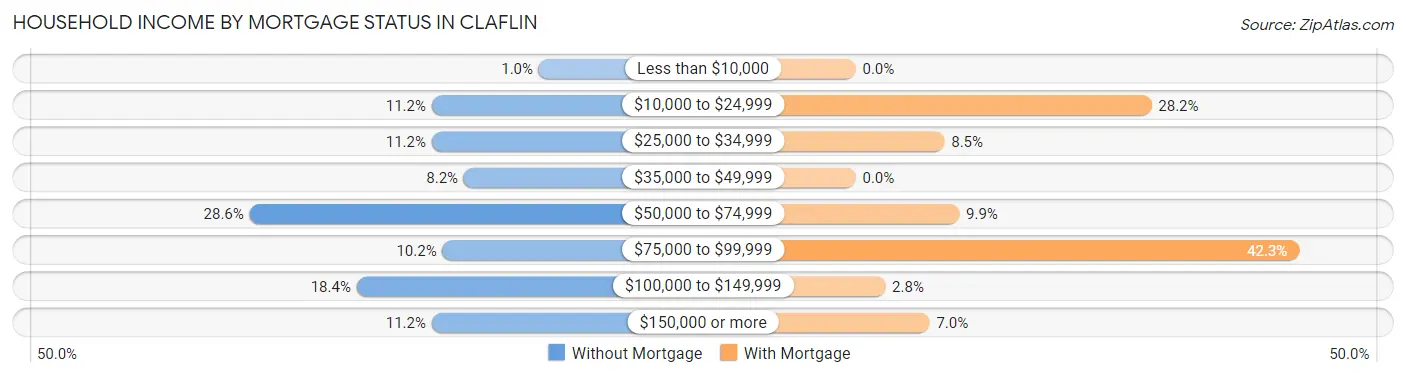
| Household Income | Without Mortgage | With Mortgage |
| Less than $10,000 | 1 (1.0%) | 0 (0.0%) |
| $10,000 to $24,999 | 11 (11.2%) | 20 (28.2%) |
| $25,000 to $34,999 | 11 (11.2%) | 6 (8.5%) |
| $35,000 to $49,999 | 8 (8.2%) | 0 (0.0%) |
| $50,000 to $74,999 | 28 (28.6%) | 7 (9.9%) |
| $75,000 to $99,999 | 10 (10.2%) | 30 (42.2%) |
| $100,000 to $149,999 | 18 (18.4%) | 2 (2.8%) |
| $150,000 or more | 11 (11.2%) | 5 (7.0%) |
| Total | 98 (100.0%) | 71 (100.0%) |
Property Value to Household Income Ratio in Claflin
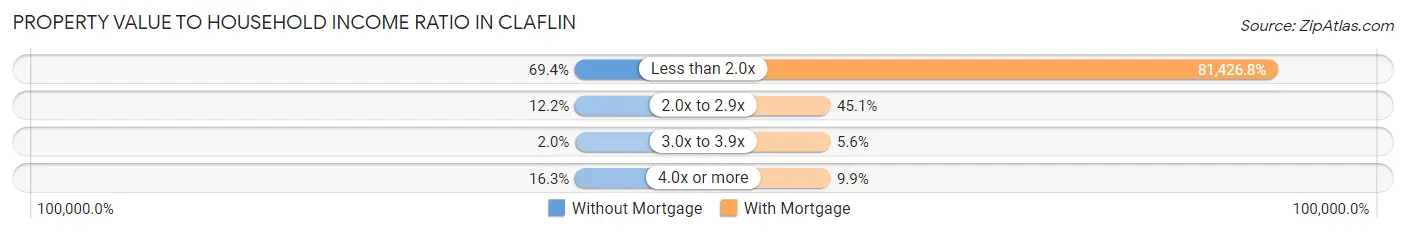
| Value-to-Income Ratio | Without Mortgage | With Mortgage |
| Less than 2.0x | 68 (69.4%) | 57,813 (81,426.8%) |
| 2.0x to 2.9x | 12 (12.2%) | 32 (45.1%) |
| 3.0x to 3.9x | 2 (2.0%) | 4 (5.6%) |
| 4.0x or more | 16 (16.3%) | 7 (9.9%) |
| Total | 98 (100.0%) | 71 (100.0%) |
Real Estate Taxes by Mortgage Status in Claflin
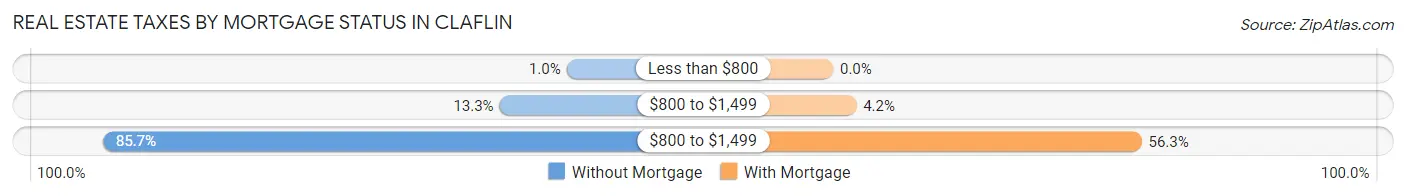
| Property Taxes | Without Mortgage | With Mortgage |
| Less than $800 | 1 (1.0%) | 0 (0.0%) |
| $800 to $1,499 | 13 (13.3%) | 3 (4.2%) |
| $800 to $1,499 | 84 (85.7%) | 40 (56.3%) |
| Total | 98 (100.0%) | 71 (100.0%) |
Health & Disability in Claflin
Health Insurance Coverage by Age in Claflin
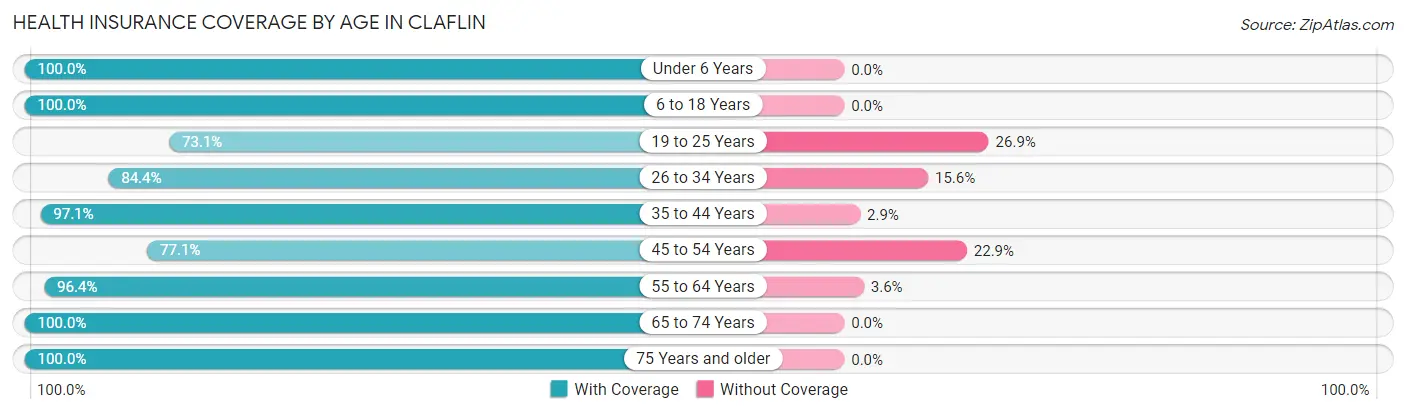
| Age Bracket | With Coverage | Without Coverage |
| Under 6 Years | 9 (100.0%) | 0 (0.0%) |
| 6 to 18 Years | 152 (100.0%) | 0 (0.0%) |
| 19 to 25 Years | 19 (73.1%) | 7 (26.9%) |
| 26 to 34 Years | 27 (84.4%) | 5 (15.6%) |
| 35 to 44 Years | 66 (97.1%) | 2 (2.9%) |
| 45 to 54 Years | 27 (77.1%) | 8 (22.9%) |
| 55 to 64 Years | 53 (96.4%) | 2 (3.6%) |
| 65 to 74 Years | 53 (100.0%) | 0 (0.0%) |
| 75 Years and older | 57 (100.0%) | 0 (0.0%) |
| Total | 463 (95.1%) | 24 (4.9%) |
Health Insurance Coverage by Citizenship Status in Claflin
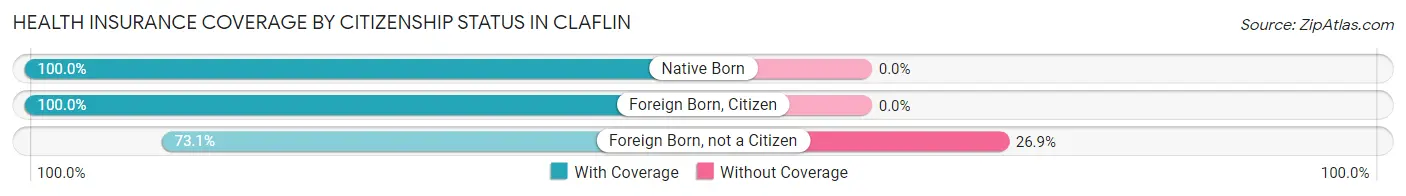
| Citizenship Status | With Coverage | Without Coverage |
| Native Born | 9 (100.0%) | 0 (0.0%) |
| Foreign Born, Citizen | 152 (100.0%) | 0 (0.0%) |
| Foreign Born, not a Citizen | 19 (73.1%) | 7 (26.9%) |
Health Insurance Coverage by Household Income in Claflin
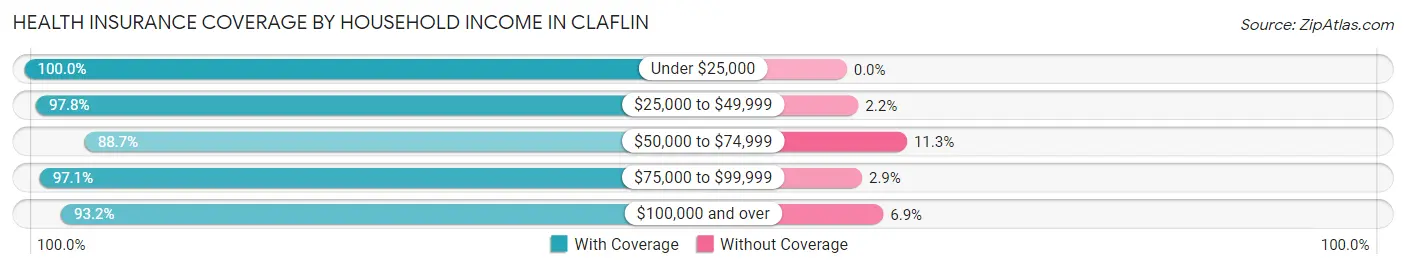
| Household Income | With Coverage | Without Coverage |
| Under $25,000 | 119 (100.0%) | 0 (0.0%) |
| $25,000 to $49,999 | 90 (97.8%) | 2 (2.2%) |
| $50,000 to $74,999 | 118 (88.7%) | 15 (11.3%) |
| $75,000 to $99,999 | 68 (97.1%) | 2 (2.9%) |
| $100,000 and over | 68 (93.1%) | 5 (6.9%) |
Public vs Private Health Insurance Coverage by Age in Claflin
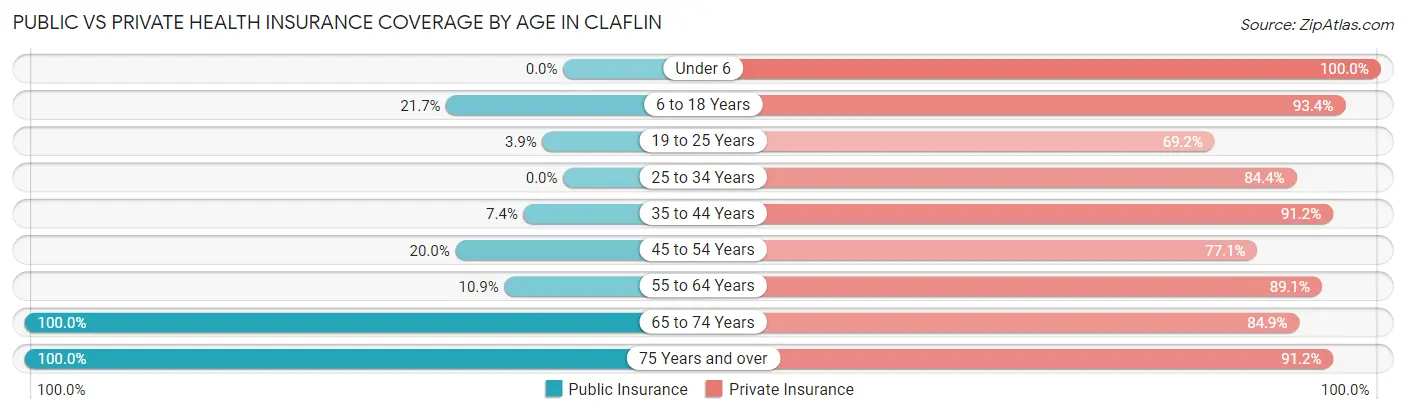
| Age Bracket | Public Insurance | Private Insurance |
| Under 6 | 0 (0.0%) | 9 (100.0%) |
| 6 to 18 Years | 33 (21.7%) | 142 (93.4%) |
| 19 to 25 Years | 1 (3.8%) | 18 (69.2%) |
| 25 to 34 Years | 0 (0.0%) | 27 (84.4%) |
| 35 to 44 Years | 5 (7.3%) | 62 (91.2%) |
| 45 to 54 Years | 7 (20.0%) | 27 (77.1%) |
| 55 to 64 Years | 6 (10.9%) | 49 (89.1%) |
| 65 to 74 Years | 53 (100.0%) | 45 (84.9%) |
| 75 Years and over | 57 (100.0%) | 52 (91.2%) |
| Total | 162 (33.3%) | 431 (88.5%) |
Disability Status by Sex by Age in Claflin
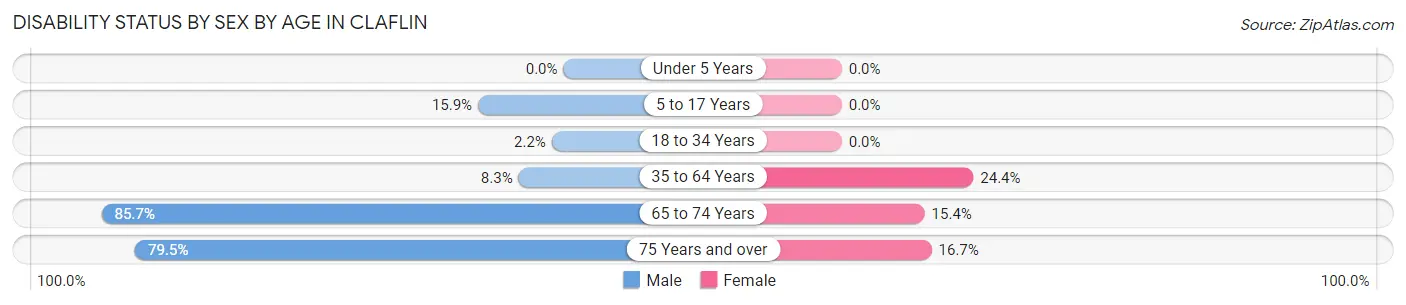
| Age Bracket | Male | Female |
| Under 5 Years | 0 (0.0%) | 0 (0.0%) |
| 5 to 17 Years | 13 (15.9%) | 0 (0.0%) |
| 18 to 34 Years | 1 (2.2%) | 0 (0.0%) |
| 35 to 64 Years | 6 (8.3%) | 21 (24.4%) |
| 65 to 74 Years | 12 (85.7%) | 6 (15.4%) |
| 75 Years and over | 31 (79.5%) | 3 (16.7%) |
Disability Class by Sex by Age in Claflin
Disability Class: Hearing Difficulty
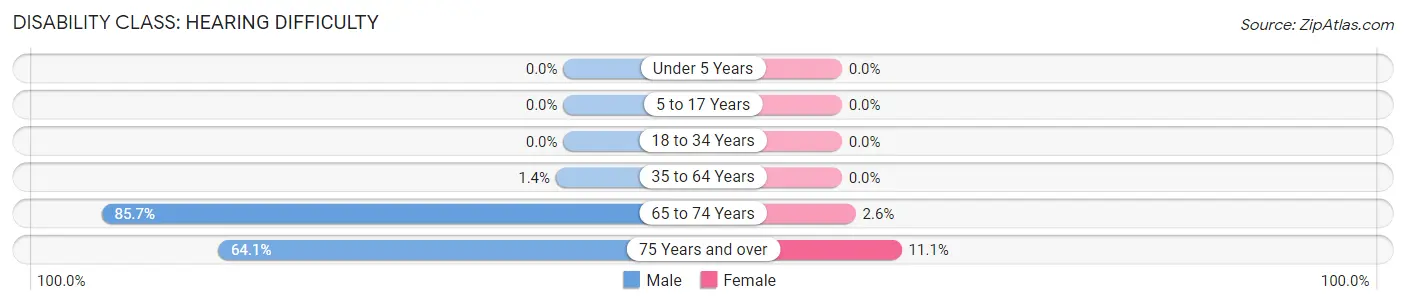
| Age Bracket | Male | Female |
| Under 5 Years | 0 (0.0%) | 0 (0.0%) |
| 5 to 17 Years | 0 (0.0%) | 0 (0.0%) |
| 18 to 34 Years | 0 (0.0%) | 0 (0.0%) |
| 35 to 64 Years | 1 (1.4%) | 0 (0.0%) |
| 65 to 74 Years | 12 (85.7%) | 1 (2.6%) |
| 75 Years and over | 25 (64.1%) | 2 (11.1%) |
Disability Class: Vision Difficulty
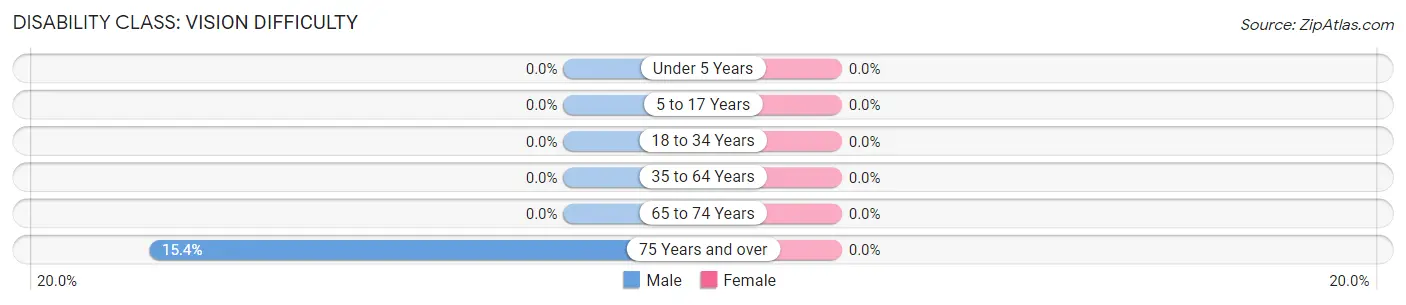
| Age Bracket | Male | Female |
| Under 5 Years | 0 (0.0%) | 0 (0.0%) |
| 5 to 17 Years | 0 (0.0%) | 0 (0.0%) |
| 18 to 34 Years | 0 (0.0%) | 0 (0.0%) |
| 35 to 64 Years | 0 (0.0%) | 0 (0.0%) |
| 65 to 74 Years | 0 (0.0%) | 0 (0.0%) |
| 75 Years and over | 6 (15.4%) | 0 (0.0%) |
Disability Class: Cognitive Difficulty
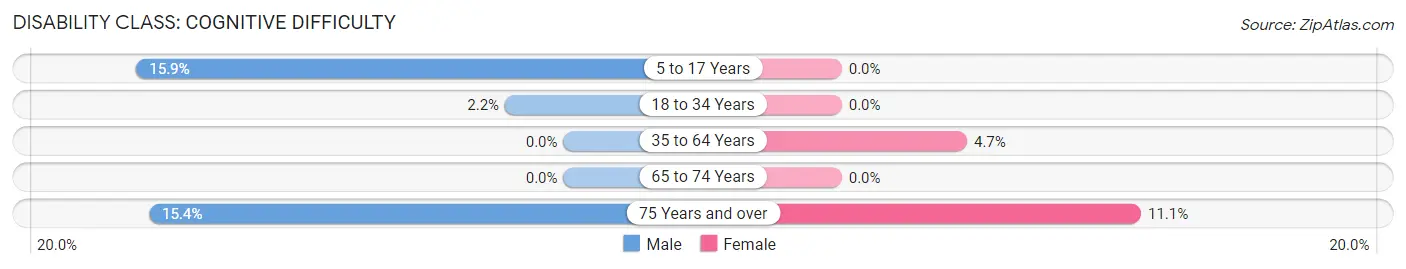
| Age Bracket | Male | Female |
| 5 to 17 Years | 13 (15.9%) | 0 (0.0%) |
| 18 to 34 Years | 1 (2.2%) | 0 (0.0%) |
| 35 to 64 Years | 0 (0.0%) | 4 (4.6%) |
| 65 to 74 Years | 0 (0.0%) | 0 (0.0%) |
| 75 Years and over | 6 (15.4%) | 2 (11.1%) |
Disability Class: Ambulatory Difficulty
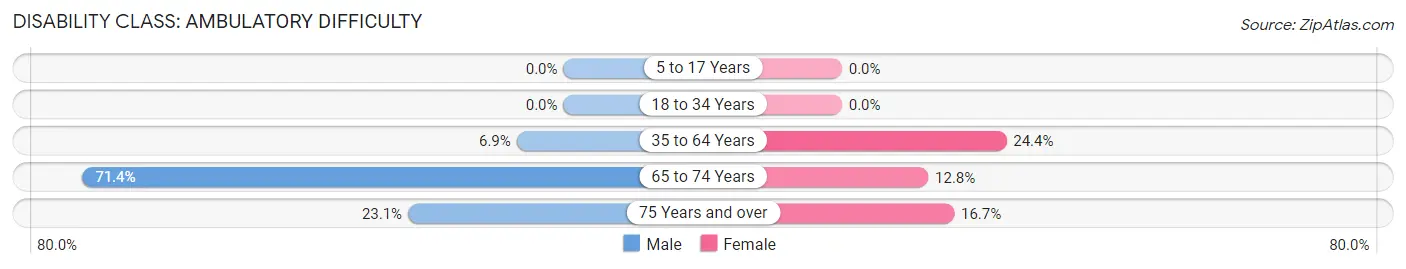
| Age Bracket | Male | Female |
| 5 to 17 Years | 0 (0.0%) | 0 (0.0%) |
| 18 to 34 Years | 0 (0.0%) | 0 (0.0%) |
| 35 to 64 Years | 5 (6.9%) | 21 (24.4%) |
| 65 to 74 Years | 10 (71.4%) | 5 (12.8%) |
| 75 Years and over | 9 (23.1%) | 3 (16.7%) |
Disability Class: Self-Care Difficulty
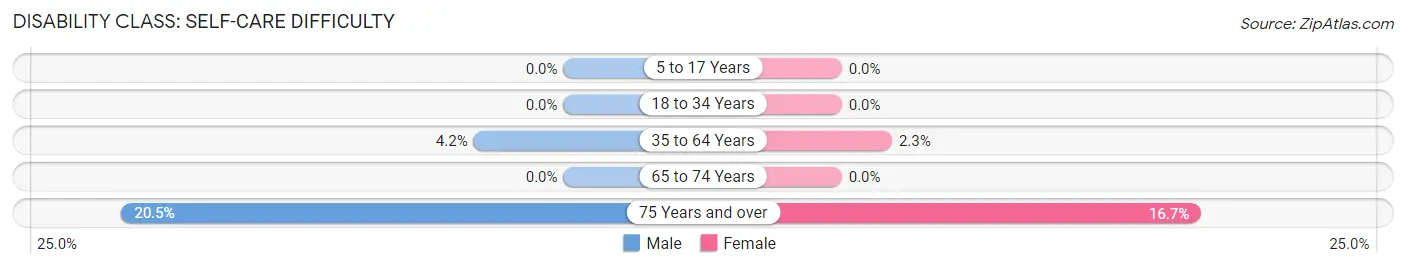
| Age Bracket | Male | Female |
| 5 to 17 Years | 0 (0.0%) | 0 (0.0%) |
| 18 to 34 Years | 0 (0.0%) | 0 (0.0%) |
| 35 to 64 Years | 3 (4.2%) | 2 (2.3%) |
| 65 to 74 Years | 0 (0.0%) | 0 (0.0%) |
| 75 Years and over | 8 (20.5%) | 3 (16.7%) |
Technology Access in Claflin
Computing Device Access in Claflin
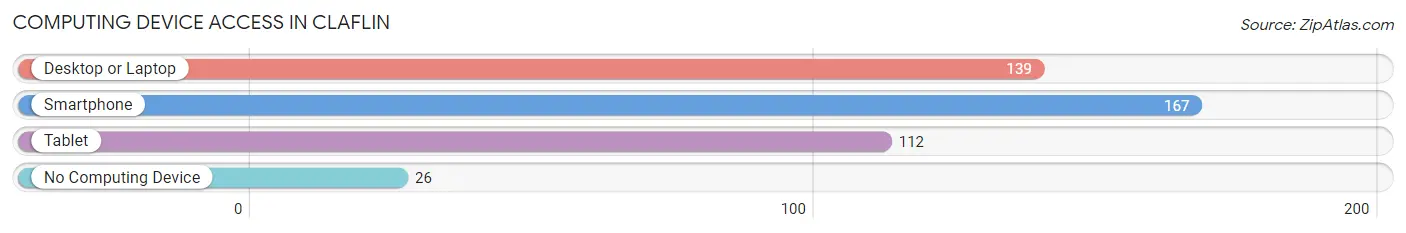
| Device Type | # Households | % Households |
| Desktop or Laptop | 139 | 68.5% |
| Smartphone | 167 | 82.3% |
| Tablet | 112 | 55.2% |
| No Computing Device | 26 | 12.8% |
| Total | 203 | 100.0% |
Internet Access in Claflin
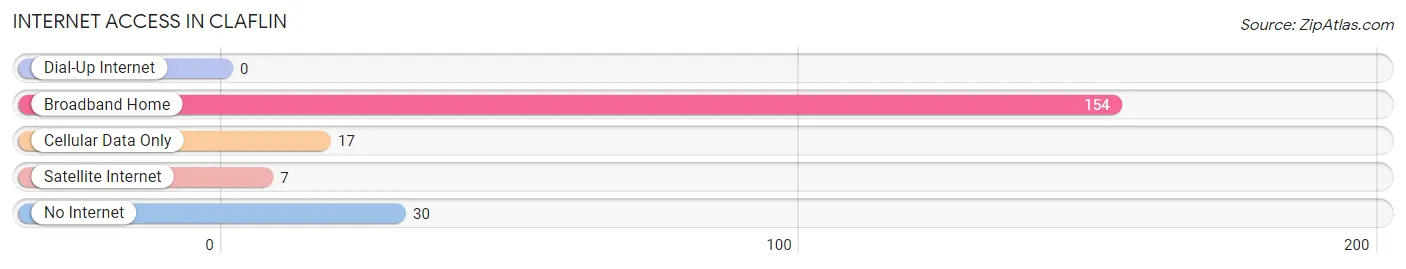
| Internet Type | # Households | % Households |
| Dial-Up Internet | 0 | 0.0% |
| Broadband Home | 154 | 75.9% |
| Cellular Data Only | 17 | 8.4% |
| Satellite Internet | 7 | 3.5% |
| No Internet | 30 | 14.8% |
| Total | 203 | 100.0% |
Claflin Summary
Claflin, Kansas is a small town located in Barton County, in the central part of the state. It is situated on the banks of the Arkansas River, and is home to a population of just over 1,000 people. The town was founded in 1887, and has a rich history of farming, ranching, and small business.
Geography
Claflin is located in the Great Plains region of the United States, and is part of the Central Lowland physiographic region. The town is situated on the banks of the Arkansas River, and is surrounded by rolling hills and prairies. The climate is semi-arid, with hot summers and cold winters. The average annual precipitation is around 22 inches, and the average annual temperature is around 54 degrees Fahrenheit.
Economy
Claflin’s economy is largely based on agriculture and small businesses. The town is home to several grain elevators, and the surrounding area is used for growing wheat, corn, and other crops. The town also has a few small businesses, including a grocery store, a hardware store, and a few restaurants.
Demographics
As of the 2010 census, Claflin had a population of 1,072 people. The racial makeup of the town was 95.3% White, 0.7% African American, 0.3% Native American, 0.2% Asian, 0.1% Pacific Islander, and 3.4% from other races. The median household income was $37,500, and the median family income was $45,000.
History
Claflin was founded in 1887 by a group of German immigrants. The town was named after a local rancher, John Claflin, who had donated the land for the town. The town quickly grew, and by the early 1900s, it had become a thriving agricultural center. The town was also home to several small businesses, including a bank, a hotel, and a general store.
In the early 1900s, Claflin was a popular stop on the Santa Fe Trail, and the town was home to several stagecoach stops. The town also had a railroad station, which was used to transport goods and passengers.
In the late 1950s, Claflin began to decline, as many of the town’s businesses closed. The town’s population also began to decline, and by the 2000 census, the population had dropped to just over 1,000 people.
Today, Claflin is a small, quiet town. The town is home to several small businesses, and the surrounding area is still used for farming and ranching. The town also has a few tourist attractions, including a museum and a historic theater. Claflin is a great place to visit, and it is a reminder of the town’s rich history and culture.
Common Questions
What is Per Capita Income in Claflin?
Per Capita income in Claflin is $27,971.
What is the Median Family Income in Claflin?
Median Family Income in Claflin is $65,357.
What is the Median Household income in Claflin?
Median Household Income in Claflin is $58,125.
What is Income or Wage Gap in Claflin?
Income or Wage Gap in Claflin is 45.0%.
Women in Claflin earn 55.0 cents for every dollar earned by a man.
What is Inequality or Gini Index in Claflin?
Inequality or Gini Index in Claflin is 0.42.
What is the Total Population of Claflin?
Total Population of Claflin is 487.
What is the Total Male Population of Claflin?
Total Male Population of Claflin is 253.
What is the Total Female Population of Claflin?
Total Female Population of Claflin is 234.
What is the Ratio of Males per 100 Females in Claflin?
There are 108.12 Males per 100 Females in Claflin.
What is the Ratio of Females per 100 Males in Claflin?
There are 92.49 Females per 100 Males in Claflin.
What is the Median Population Age in Claflin?
Median Population Age in Claflin is 38.0 Years.
What is the Average Family Size in Claflin
Average Family Size in Claflin is 3.1 People.
What is the Average Household Size in Claflin
Average Household Size in Claflin is 2.4 People.
How Large is the Labor Force in Claflin?
There are 241 People in the Labor Forcein in Claflin.
What is the Percentage of People in the Labor Force in Claflin?
65.7% of People are in the Labor Force in Claflin.
What is the Unemployment Rate in Claflin?
Unemployment Rate in Claflin is 9.5%.