Park, KS Map & Demographics
Park Map
Park Overview
$43,852
PER CAPITA INCOME
$117,857
AVG FAMILY INCOME
47.4%
WAGE / INCOME GAP [ % ]
52.6¢/ $1
WAGE / INCOME GAP [ $ ]
$8,325
FAMILY INCOME DEFICIT
0.46
INEQUALITY / GINI INDEX
94
TOTAL POPULATION
52
MALE POPULATION
42
FEMALE POPULATION
123.81
MALES / 100 FEMALES
80.77
FEMALES / 100 MALES
52.0
MEDIAN AGE
2.7
AVG FAMILY SIZE
1.9
AVG HOUSEHOLD SIZE
65
LABOR FORCE [ PEOPLE ]
78.3%
PERCENT IN LABOR FORCE
Park Zip Codes
Park Area Codes
Income in Park
Income Overview in Park
| Characteristic | Number | Measure |
| Per Capita Income | 94 | $43,852 |
| Median Family Income | 24 | $117,857 |
| Mean Family Income | 24 | $92,392 |
| Median Household Income | 49 | $0 |
| Mean Household Income | 49 | $71,502 |
| Income Deficit | 24 | $8,325 |
| Wage / Income Gap (%) | 94 | 47.37% |
| Wage / Income Gap ($) | 94 | 52.63¢ per $1 |
| Gini / Inequality Index | 94 | 0.46 |
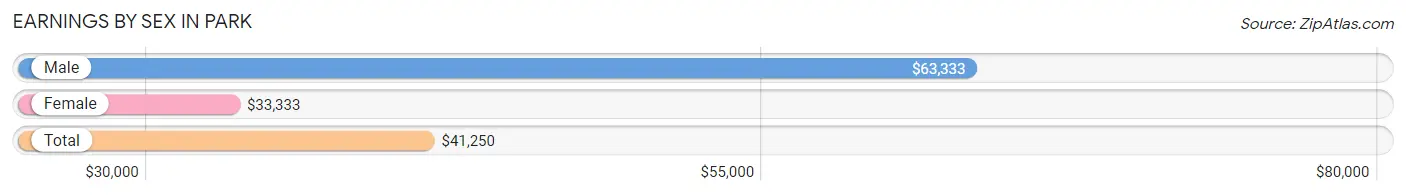
Earnings by Sex in Park
Average Earnings in Park are $41,250, $63,333 for men and $33,333 for women, a difference of 47.4%.
| Sex | Number | Average Earnings |
| Male | 38 (57.6%) | $63,333 |
| Female | 28 (42.4%) | $33,333 |
| Total | 66 (100.0%) | $41,250 |
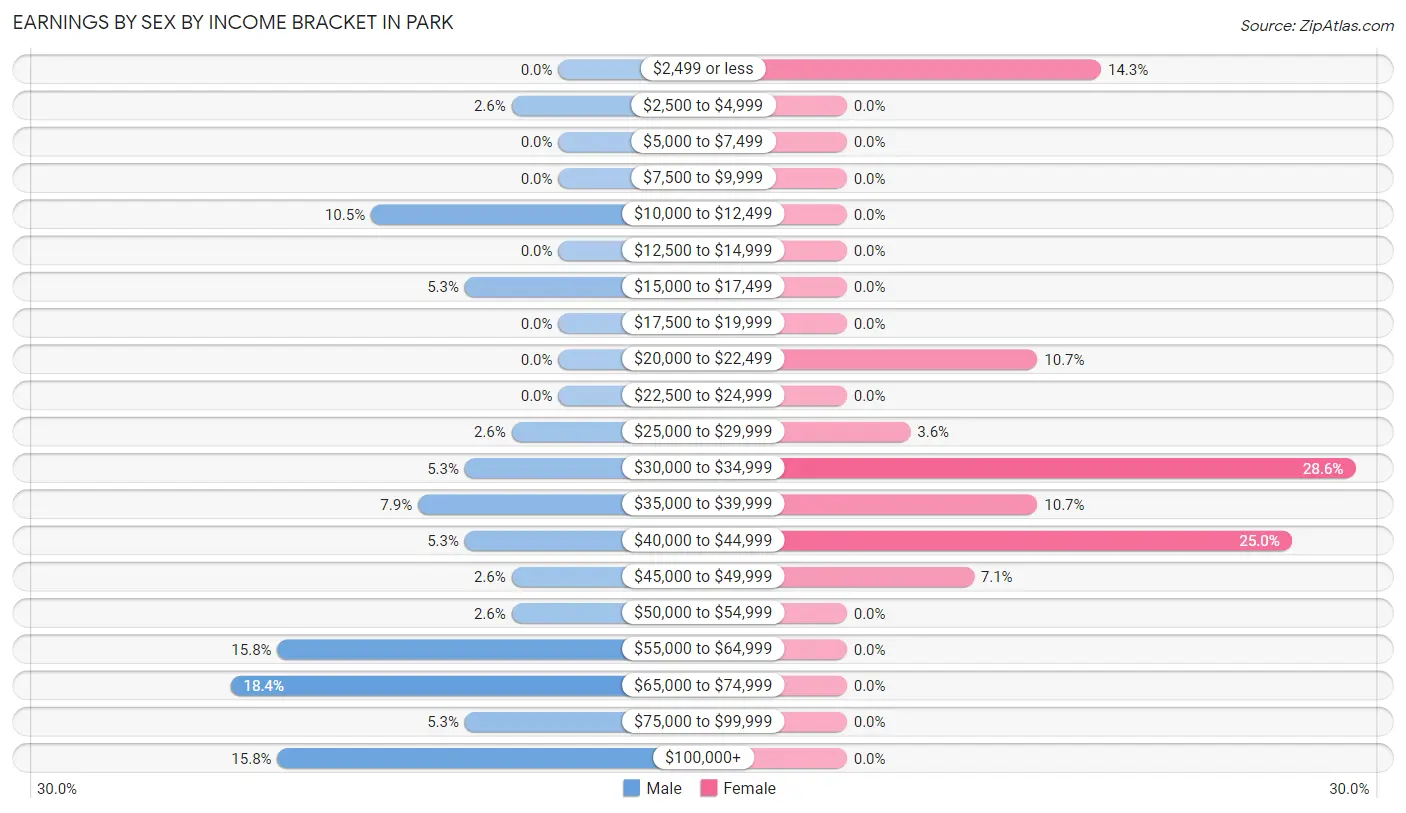
Earnings by Sex by Income Bracket in Park
The most common earnings brackets in Park are $65,000 to $74,999 for men (7 | 18.4%) and $30,000 to $34,999 for women (8 | 28.6%).
| Income | Male | Female |
| $2,499 or less | 0 (0.0%) | 4 (14.3%) |
| $2,500 to $4,999 | 1 (2.6%) | 0 (0.0%) |
| $5,000 to $7,499 | 0 (0.0%) | 0 (0.0%) |
| $7,500 to $9,999 | 0 (0.0%) | 0 (0.0%) |
| $10,000 to $12,499 | 4 (10.5%) | 0 (0.0%) |
| $12,500 to $14,999 | 0 (0.0%) | 0 (0.0%) |
| $15,000 to $17,499 | 2 (5.3%) | 0 (0.0%) |
| $17,500 to $19,999 | 0 (0.0%) | 0 (0.0%) |
| $20,000 to $22,499 | 0 (0.0%) | 3 (10.7%) |
| $22,500 to $24,999 | 0 (0.0%) | 0 (0.0%) |
| $25,000 to $29,999 | 1 (2.6%) | 1 (3.6%) |
| $30,000 to $34,999 | 2 (5.3%) | 8 (28.6%) |
| $35,000 to $39,999 | 3 (7.9%) | 3 (10.7%) |
| $40,000 to $44,999 | 2 (5.3%) | 7 (25.0%) |
| $45,000 to $49,999 | 1 (2.6%) | 2 (7.1%) |
| $50,000 to $54,999 | 1 (2.6%) | 0 (0.0%) |
| $55,000 to $64,999 | 6 (15.8%) | 0 (0.0%) |
| $65,000 to $74,999 | 7 (18.4%) | 0 (0.0%) |
| $75,000 to $99,999 | 2 (5.3%) | 0 (0.0%) |
| $100,000+ | 6 (15.8%) | 0 (0.0%) |
| Total | 38 (100.0%) | 28 (100.0%) |
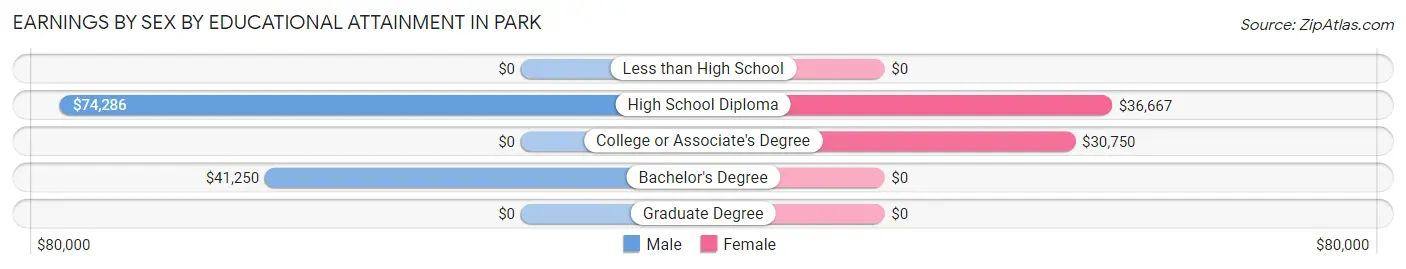
Earnings by Sex by Educational Attainment in Park
Average earnings in Park are $64,583 for men and $33,750 for women, a difference of 47.7%. Men with an educational attainment of high school diploma enjoy the highest average annual earnings of $74,286, while those with bachelor's degree education earn the least with $41,250. Women with an educational attainment of high school diploma earn the most with the average annual earnings of $36,667, while those with college or associate's degree education have the smallest earnings of $30,750.
| Educational Attainment | Male Income | Female Income |
| Less than High School | - | - |
| High School Diploma | $74,286 | $36,667 |
| College or Associate's Degree | - | - |
| Bachelor's Degree | $41,250 | $0 |
| Graduate Degree | - | - |
| Total | $64,583 | $33,750 |
Family Income in Park
Family Income Brackets in Park
According to the Park family income data, there are 10 families falling into the $100,000 to $149,999 income range, which is the most common income bracket and makes up 41.7% of all families.
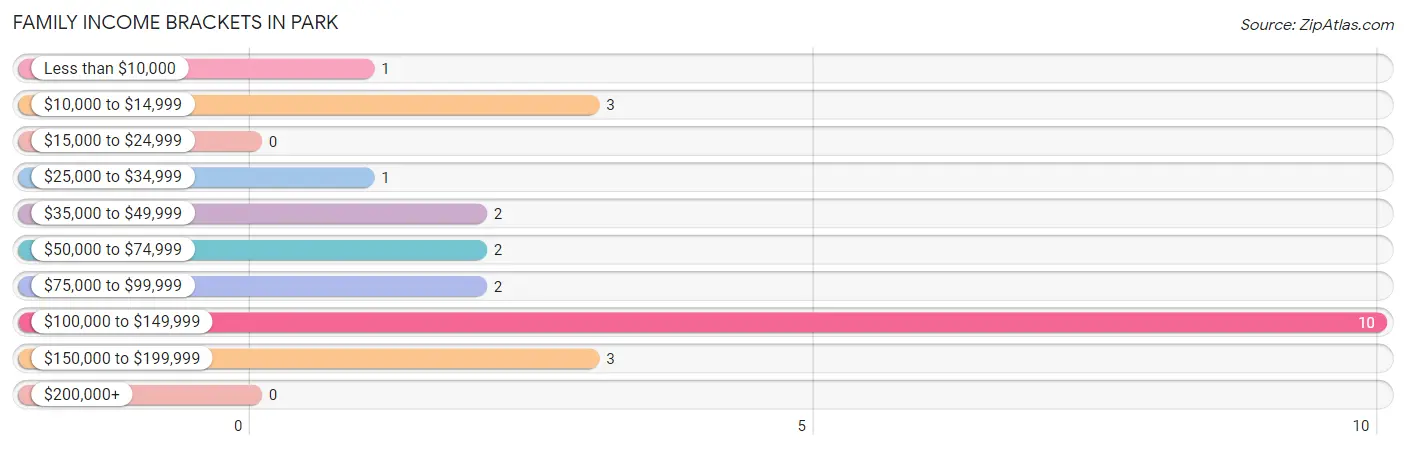
| Income Bracket | # Families | % Families |
| Less than $10,000 | 1 | 4.2% |
| $10,000 to $14,999 | 3 | 12.5% |
| $15,000 to $24,999 | 0 | 0.0% |
| $25,000 to $34,999 | 1 | 4.2% |
| $35,000 to $49,999 | 2 | 8.3% |
| $50,000 to $74,999 | 2 | 8.3% |
| $75,000 to $99,999 | 2 | 8.3% |
| $100,000 to $149,999 | 10 | 41.7% |
| $150,000 to $199,999 | 3 | 12.5% |
| $200,000+ | 0 | 0.0% |
Family Income by Famaliy Size in Park
2-person families (18 | 75.0%) account for the highest median family income in Park with $118,929 per family, while 2-person families (18 | 75.0%) have the highest median income of $59,464 per family member.
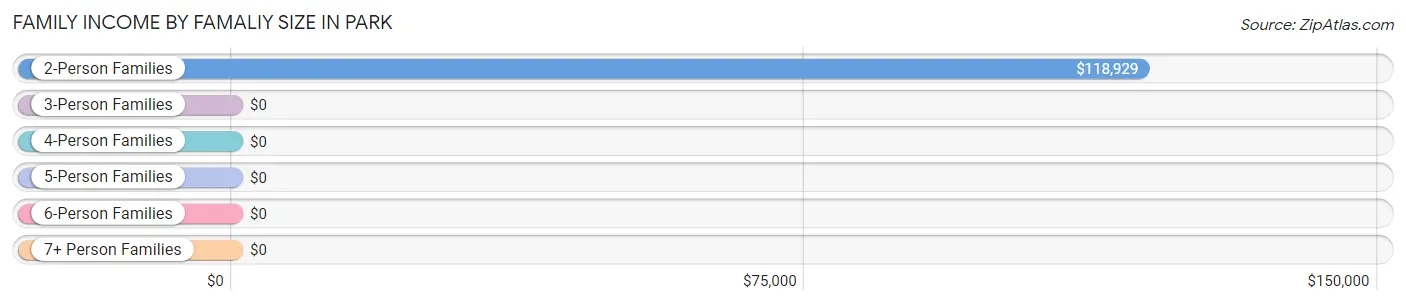
| Income Bracket | # Families | Median Income |
| 2-Person Families | 18 (75.0%) | $118,929 |
| 3-Person Families | 3 (12.5%) | $0 |
| 4-Person Families | 3 (12.5%) | $0 |
| 5-Person Families | 0 (0.0%) | $0 |
| 6-Person Families | 0 (0.0%) | $0 |
| 7+ Person Families | 0 (0.0%) | $0 |
| Total | 24 (100.0%) | $117,857 |
Family Income by Number of Earners in Park
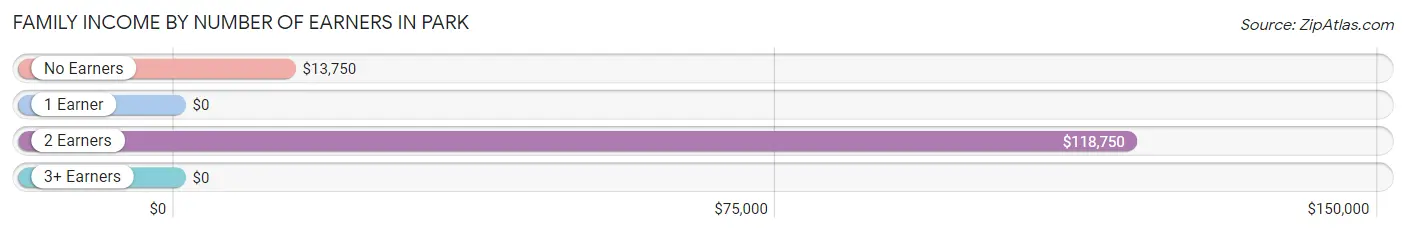
| Number of Earners | # Families | Median Income |
| No Earners | 3 (12.5%) | $13,750 |
| 1 Earner | 2 (8.3%) | $0 |
| 2 Earners | 19 (79.2%) | $118,750 |
| 3+ Earners | 0 (0.0%) | $0 |
| Total | 24 (100.0%) | $117,857 |
Household Income in Park
Household Income Brackets in Park
With 12 households falling in the category, the $100,000 to $149,999 income range is the most frequent in Park, accounting for 24.5% of all households. In contrast, only 1 households (2.0%) fall into the $200,000+ income bracket, making it the least populous group.
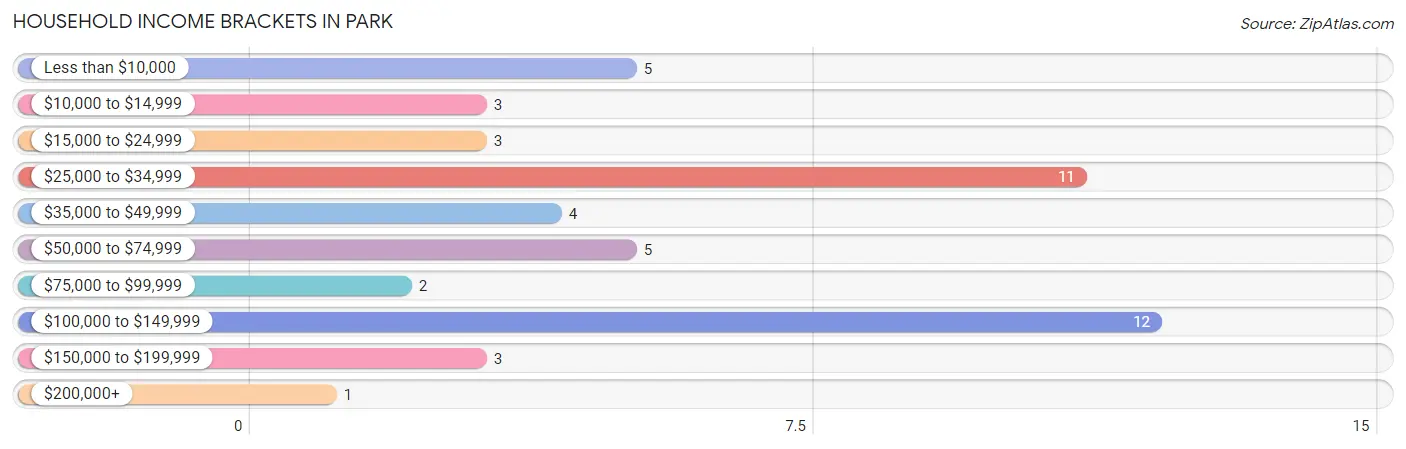
| Income Bracket | # Households | % Households |
| Less than $10,000 | 5 | 10.2% |
| $10,000 to $14,999 | 3 | 6.1% |
| $15,000 to $24,999 | 3 | 6.1% |
| $25,000 to $34,999 | 11 | 22.4% |
| $35,000 to $49,999 | 4 | 8.2% |
| $50,000 to $74,999 | 5 | 10.2% |
| $75,000 to $99,999 | 2 | 4.1% |
| $100,000 to $149,999 | 12 | 24.5% |
| $150,000 to $199,999 | 3 | 6.1% |
| $200,000+ | 1 | 2.0% |
Household Income by Householder Age in Park
The median household income in Park is $0, with the highest median household income of $118,571 found in the 45 to 64 years age bracket for the primary householder. A total of 20 households (40.8%) fall into this category. Meanwhile, the 15 to 24 years age bracket for the primary householder has the lowest median household income of $0, with 1 households (2.0%) in this group.
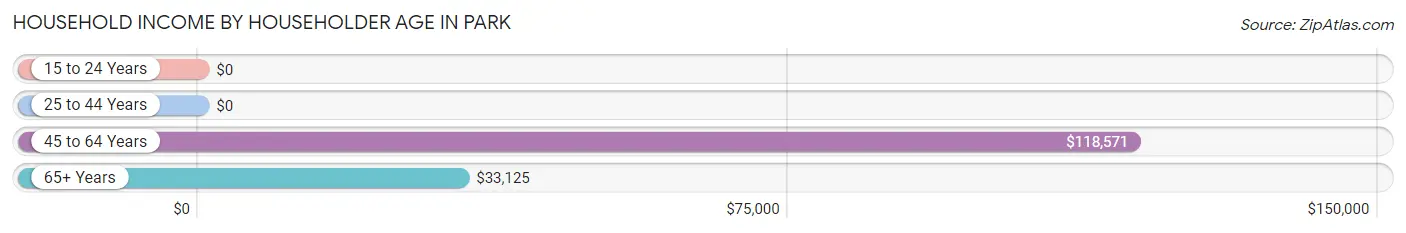
| Income Bracket | # Households | Median Income |
| 15 to 24 Years | 1 (2.0%) | $0 |
| 25 to 44 Years | 10 (20.4%) | $0 |
| 45 to 64 Years | 20 (40.8%) | $118,571 |
| 65+ Years | 18 (36.7%) | $33,125 |
| Total | 49 (100.0%) | $0 |
Poverty in Park
Income Below Poverty by Sex and Age in Park
With 13.5% poverty level for males and 23.8% for females among the residents of Park, 18 to 24 year old males and 35 to 44 year old females are the most vulnerable to poverty, with 5 males (83.3%) and 2 females (100.0%) in their respective age groups living below the poverty level.
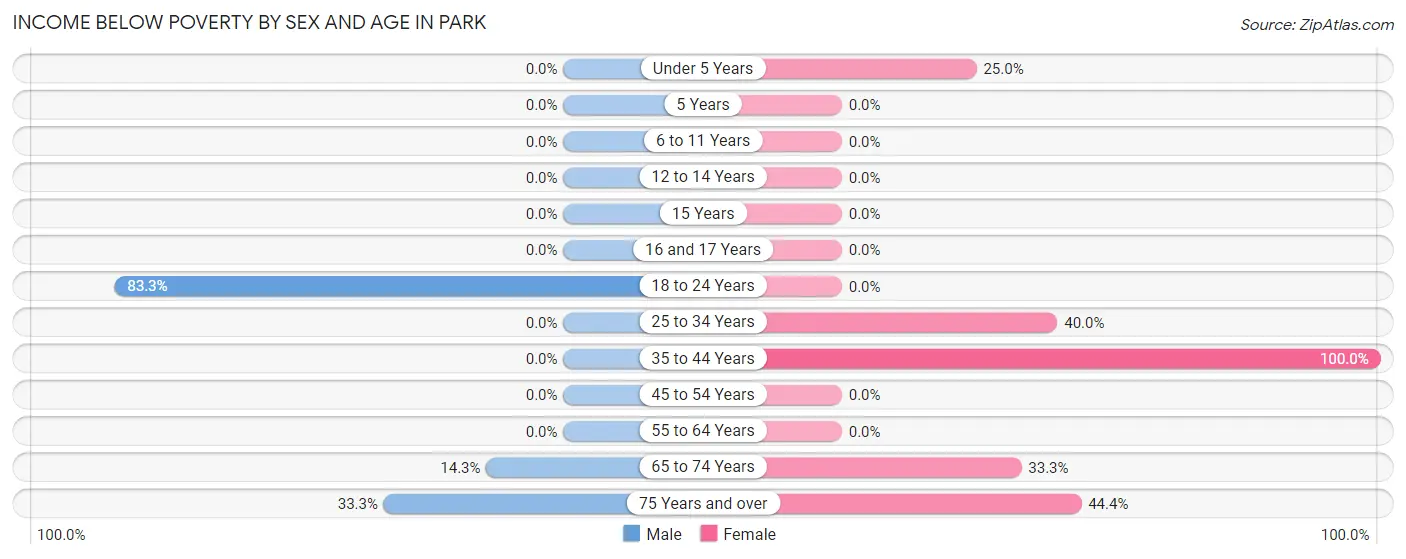
| Age Bracket | Male | Female |
| Under 5 Years | 0 (0.0%) | 1 (25.0%) |
| 5 Years | 0 (0.0%) | 0 (0.0%) |
| 6 to 11 Years | 0 (0.0%) | 0 (0.0%) |
| 12 to 14 Years | 0 (0.0%) | 0 (0.0%) |
| 15 Years | 0 (0.0%) | 0 (0.0%) |
| 16 and 17 Years | 0 (0.0%) | 0 (0.0%) |
| 18 to 24 Years | 5 (83.3%) | 0 (0.0%) |
| 25 to 34 Years | 0 (0.0%) | 2 (40.0%) |
| 35 to 44 Years | 0 (0.0%) | 2 (100.0%) |
| 45 to 54 Years | 0 (0.0%) | 0 (0.0%) |
| 55 to 64 Years | 0 (0.0%) | 0 (0.0%) |
| 65 to 74 Years | 1 (14.3%) | 1 (33.3%) |
| 75 Years and over | 1 (33.3%) | 4 (44.4%) |
| Total | 7 (13.5%) | 10 (23.8%) |
Income Above Poverty by Sex and Age in Park
According to the poverty statistics in Park, males aged under 5 years and females aged 18 to 24 years are the age groups that are most secure financially, with 100.0% of males and 100.0% of females in these age groups living above the poverty line.
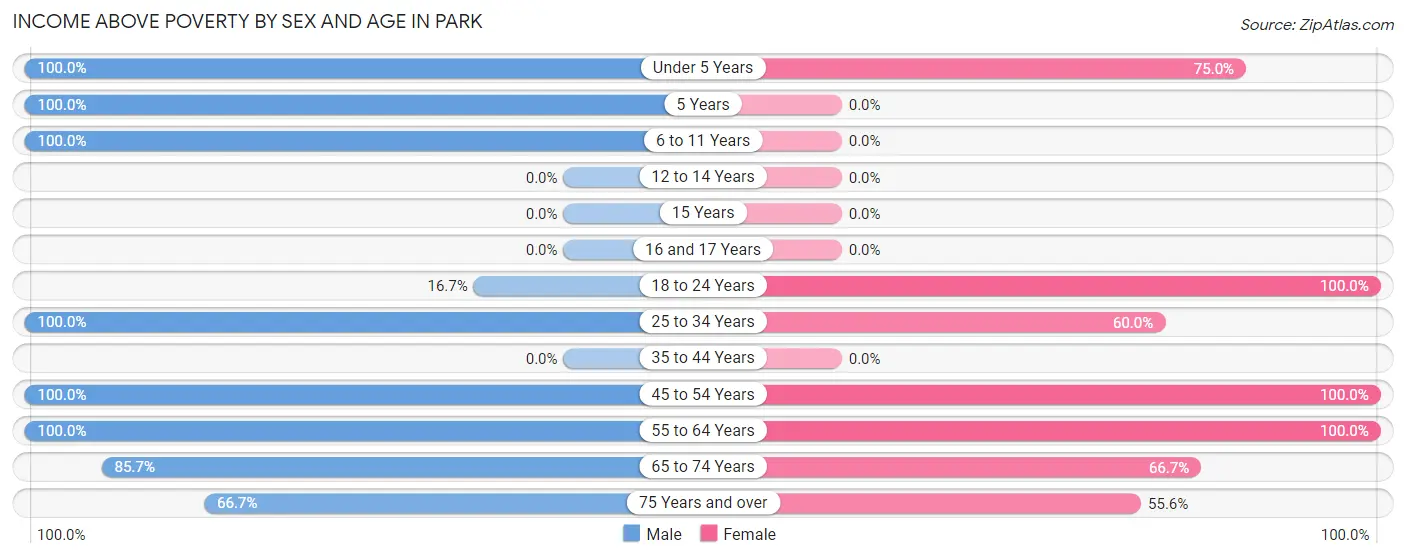
| Age Bracket | Male | Female |
| Under 5 Years | 4 (100.0%) | 3 (75.0%) |
| 5 Years | 1 (100.0%) | 0 (0.0%) |
| 6 to 11 Years | 2 (100.0%) | 0 (0.0%) |
| 12 to 14 Years | 0 (0.0%) | 0 (0.0%) |
| 15 Years | 0 (0.0%) | 0 (0.0%) |
| 16 and 17 Years | 0 (0.0%) | 0 (0.0%) |
| 18 to 24 Years | 1 (16.7%) | 1 (100.0%) |
| 25 to 34 Years | 5 (100.0%) | 3 (60.0%) |
| 35 to 44 Years | 0 (0.0%) | 0 (0.0%) |
| 45 to 54 Years | 13 (100.0%) | 10 (100.0%) |
| 55 to 64 Years | 11 (100.0%) | 8 (100.0%) |
| 65 to 74 Years | 6 (85.7%) | 2 (66.7%) |
| 75 Years and over | 2 (66.7%) | 5 (55.6%) |
| Total | 45 (86.5%) | 32 (76.2%) |
Income Below Poverty Among Married-Couple Families in Park
The poverty statistics for married-couple families in Park show that 18.2% or 4 of the total 22 families live below the poverty line. Families with 1 or 2 children have the highest poverty rate of 40.0%, comprising of 2 families. On the other hand, families with no children have the lowest poverty rate of 11.8%, which includes 2 families.
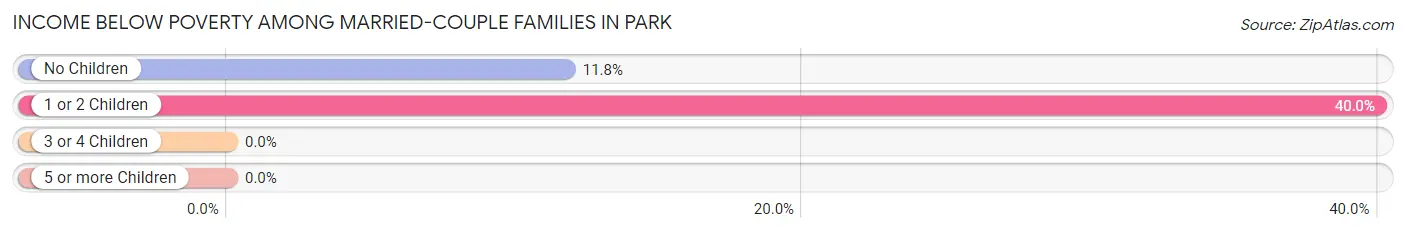
| Children | Above Poverty | Below Poverty |
| No Children | 15 (88.2%) | 2 (11.8%) |
| 1 or 2 Children | 3 (60.0%) | 2 (40.0%) |
| 3 or 4 Children | 0 (0.0%) | 0 (0.0%) |
| 5 or more Children | 0 (0.0%) | 0 (0.0%) |
| Total | 18 (81.8%) | 4 (18.2%) |
Income Below Poverty Among Single-Parent Households in Park
| Children | Single Father | Single Mother |
| No Children | 0 (0.0%) | 0 (0.0%) |
| 1 or 2 Children | 0 (0.0%) | 0 (0.0%) |
| 3 or 4 Children | 0 (0.0%) | 0 (0.0%) |
| 5 or more Children | 0 (0.0%) | 0 (0.0%) |
| Total | 0 (0.0%) | 0 (0.0%) |
Income Below Poverty Among Married-Couple vs Single-Parent Households in Park
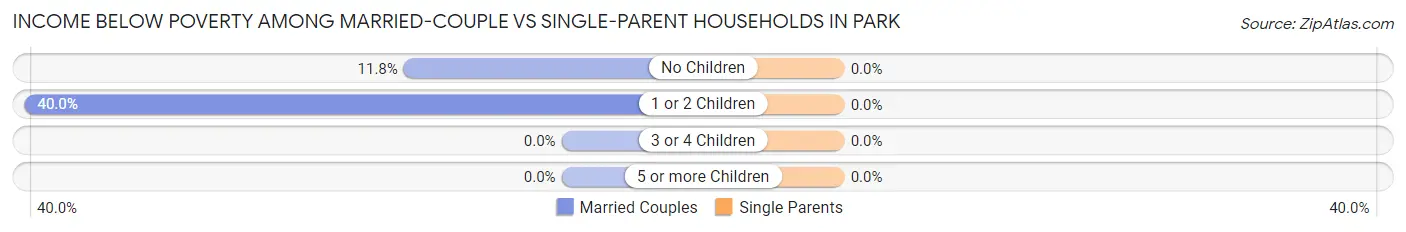
| Children | Married-Couple Families | Single-Parent Households |
| No Children | 2 (11.8%) | 0 (0.0%) |
| 1 or 2 Children | 2 (40.0%) | 0 (0.0%) |
| 3 or 4 Children | 0 (0.0%) | 0 (0.0%) |
| 5 or more Children | 0 (0.0%) | 0 (0.0%) |
| Total | 4 (18.2%) | 0 (0.0%) |
Race in Park
The most populous races in Park are White / Caucasian (89 | 94.7%), Two or more Races (5 | 5.3%), and Hispanic or Latino (2 | 2.1%).
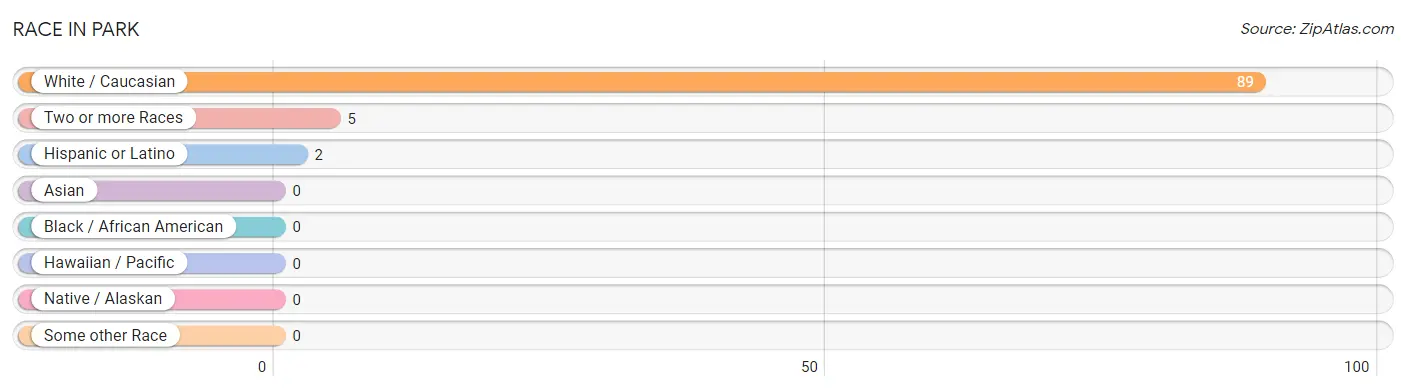
| Race | # Population | % Population |
| Asian | 0 | 0.0% |
| Black / African American | 0 | 0.0% |
| Hawaiian / Pacific | 0 | 0.0% |
| Hispanic or Latino | 2 | 2.1% |
| Native / Alaskan | 0 | 0.0% |
| White / Caucasian | 89 | 94.7% |
| Two or more Races | 5 | 5.3% |
| Some other Race | 0 | 0.0% |
| Total | 94 | 100.0% |
Ancestry in Park
The most populous ancestries reported in Park are German (29 | 30.8%), Polish (7 | 7.4%), American (6 | 6.4%), Irish (6 | 6.4%), and English (5 | 5.3%), together accounting for 56.4% of all Park residents.
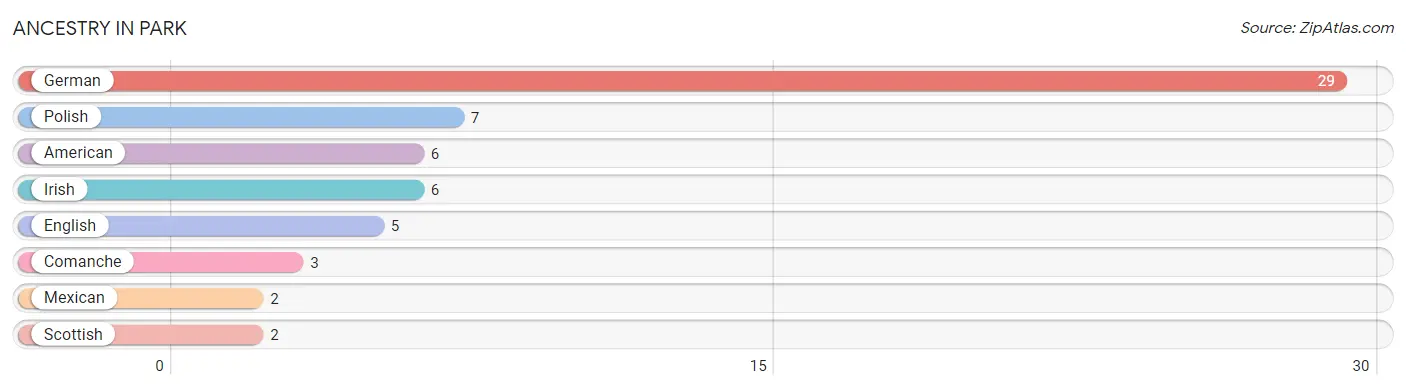
| Ancestry | # Population | % Population |
| American | 6 | 6.4% |
| Comanche | 3 | 3.2% |
| English | 5 | 5.3% |
| German | 29 | 30.8% |
| Irish | 6 | 6.4% |
| Mexican | 2 | 2.1% |
| Polish | 7 | 7.4% |
| Scottish | 2 | 2.1% | View All 8 Rows |
Immigrants in Park

| Immigration Origin | # Population | % Population | View All 0 Rows |
Sex and Age in Park
Sex and Age in Park
The most populous age groups in Park are 50 to 54 Years (8 | 15.4%) for men and 55 to 59 Years (8 | 19.1%) for women.
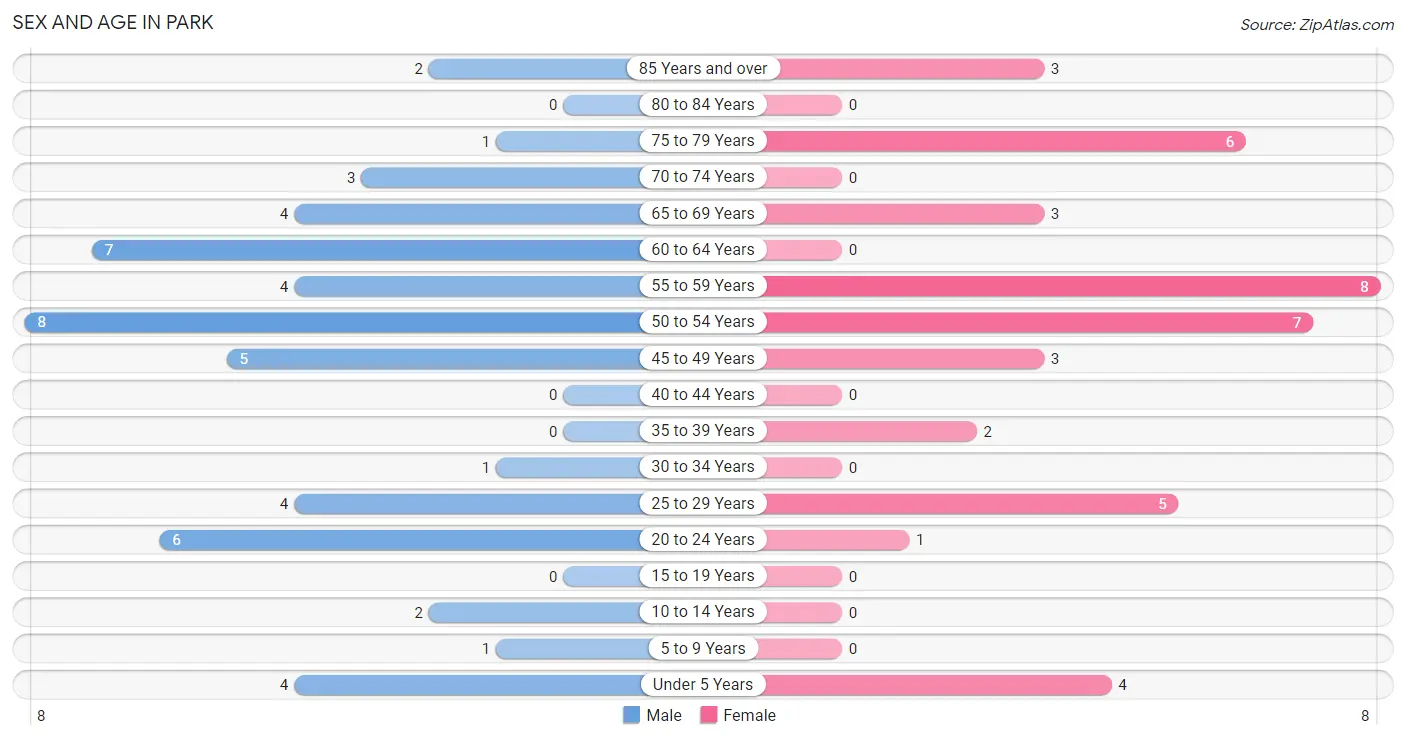
| Age Bracket | Male | Female |
| Under 5 Years | 4 (7.7%) | 4 (9.5%) |
| 5 to 9 Years | 1 (1.9%) | 0 (0.0%) |
| 10 to 14 Years | 2 (3.8%) | 0 (0.0%) |
| 15 to 19 Years | 0 (0.0%) | 0 (0.0%) |
| 20 to 24 Years | 6 (11.5%) | 1 (2.4%) |
| 25 to 29 Years | 4 (7.7%) | 5 (11.9%) |
| 30 to 34 Years | 1 (1.9%) | 0 (0.0%) |
| 35 to 39 Years | 0 (0.0%) | 2 (4.8%) |
| 40 to 44 Years | 0 (0.0%) | 0 (0.0%) |
| 45 to 49 Years | 5 (9.6%) | 3 (7.1%) |
| 50 to 54 Years | 8 (15.4%) | 7 (16.7%) |
| 55 to 59 Years | 4 (7.7%) | 8 (19.1%) |
| 60 to 64 Years | 7 (13.5%) | 0 (0.0%) |
| 65 to 69 Years | 4 (7.7%) | 3 (7.1%) |
| 70 to 74 Years | 3 (5.8%) | 0 (0.0%) |
| 75 to 79 Years | 1 (1.9%) | 6 (14.3%) |
| 80 to 84 Years | 0 (0.0%) | 0 (0.0%) |
| 85 Years and over | 2 (3.8%) | 3 (7.1%) |
| Total | 52 (100.0%) | 42 (100.0%) |
Families and Households in Park
Median Family Size in Park
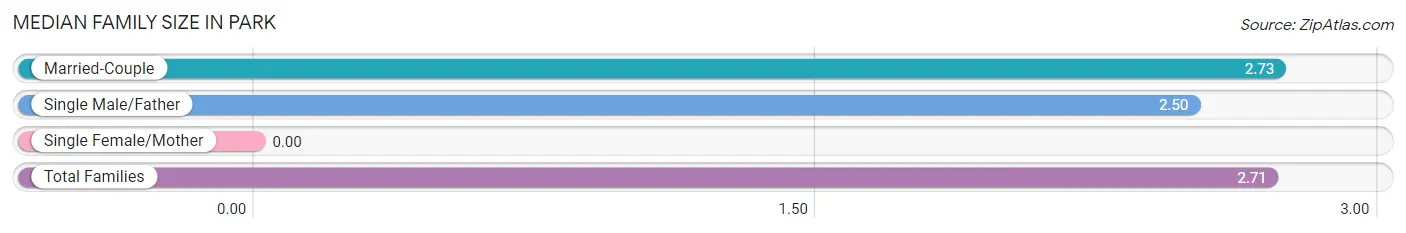
| Family Type | # Families | Family Size |
| Married-Couple | 22 (91.7%) | 2.73 |
| Single Male/Father | 2 (8.3%) | 2.50 |
| Single Female/Mother | 0 (0.0%) | - |
| Total Families | 24 (100.0%) | 2.71 |
Median Household Size in Park
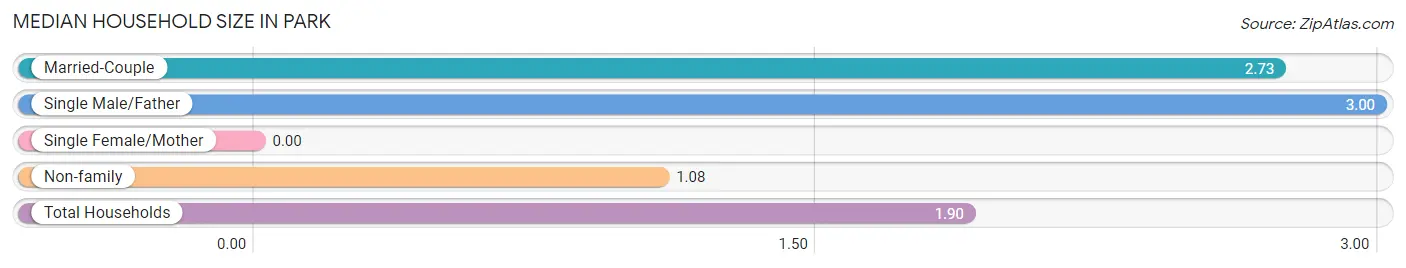
| Household Type | # Households | Household Size |
| Married-Couple | 22 (44.9%) | 2.73 |
| Single Male/Father | 2 (4.1%) | 3.00 |
| Single Female/Mother | 0 (0.0%) | - |
| Non-family | 25 (51.0%) | 1.08 |
| Total Households | 49 (100.0%) | 1.90 |
Household Size by Marriage Status in Park
Out of a total of 49 households in Park, 24 (49.0%) are family households, while 25 (51.0%) are nonfamily households. The most numerous type of family households are 2-person households, comprising 17, and the most common type of nonfamily households are 1-person households, comprising 23.
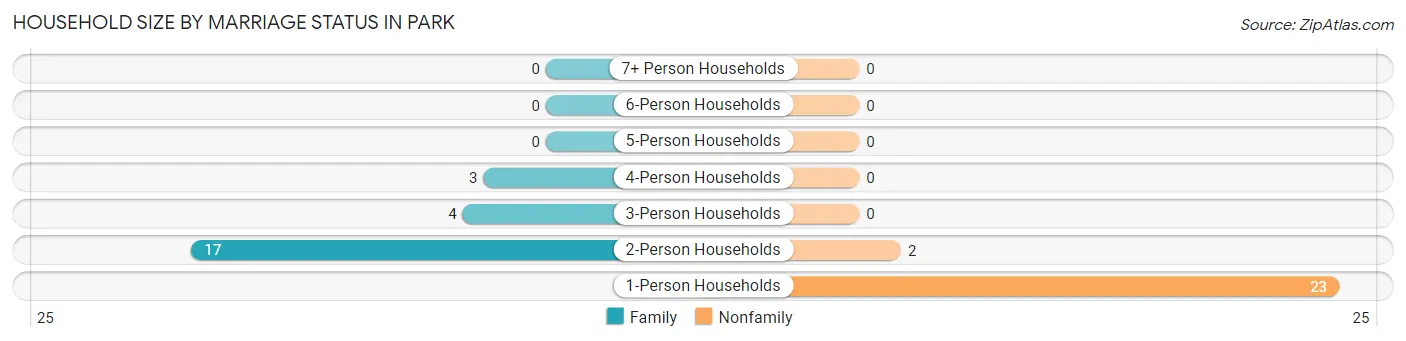
| Household Size | Family Households | Nonfamily Households |
| 1-Person Households | - | 23 (46.9%) |
| 2-Person Households | 17 (34.7%) | 2 (4.1%) |
| 3-Person Households | 4 (8.2%) | 0 (0.0%) |
| 4-Person Households | 3 (6.1%) | 0 (0.0%) |
| 5-Person Households | 0 (0.0%) | 0 (0.0%) |
| 6-Person Households | 0 (0.0%) | 0 (0.0%) |
| 7+ Person Households | 0 (0.0%) | 0 (0.0%) |
| Total | 24 (49.0%) | 25 (51.0%) |
Female Fertility in Park
Fertility by Age in Park
Average fertility rate in Park is 273.0 births per 1,000 women. Women in the age bracket of 20 to 34 years have the highest fertility rate with 500.0 births per 1,000 women. Women in the age bracket of 20 to 34 years acount for 100.0% of all women with births.
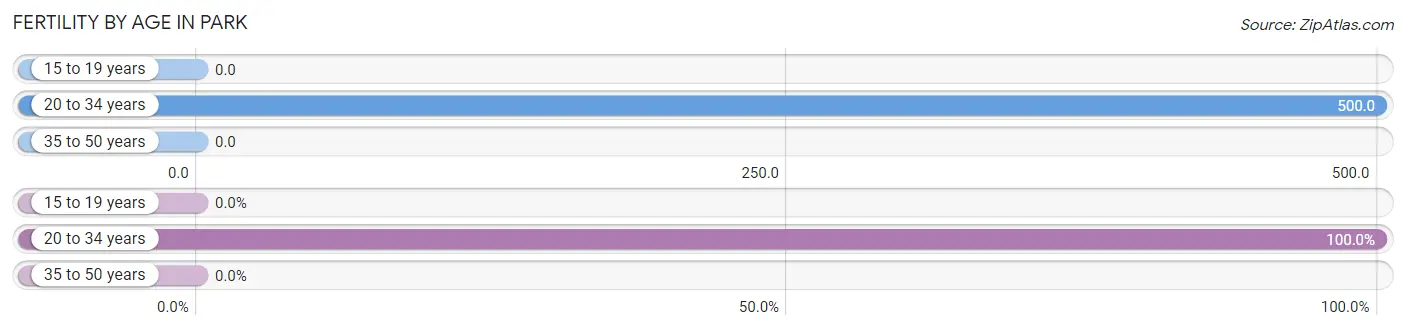
| Age Bracket | Women with Births | Births / 1,000 Women |
| 15 to 19 years | 0 (0.0%) | 0.0 |
| 20 to 34 years | 3 (100.0%) | 500.0 |
| 35 to 50 years | 0 (0.0%) | 0.0 |
| Total | 3 (100.0%) | 273.0 |
Fertility by Age by Marriage Status in Park
66.7% of women with births (3) in Park are married. The highest percentage of unmarried women with births falls into 20 to 34 years age bracket with 33.3% of them unmarried at the time of birth, while the lowest percentage of unmarried women with births belong to 20 to 34 years age bracket with 33.3% of them unmarried.
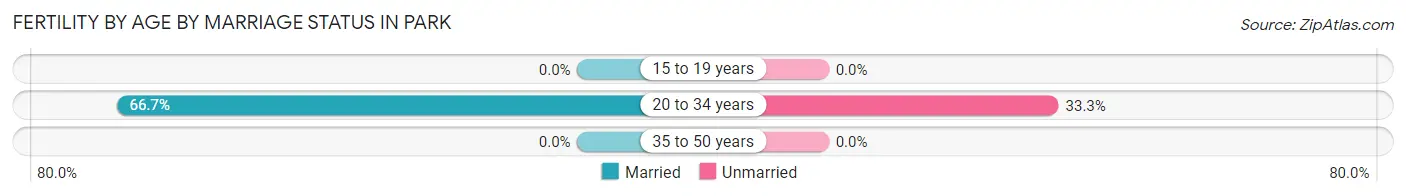
| Age Bracket | Married | Unmarried |
| 15 to 19 years | 0 (0.0%) | 0 (0.0%) |
| 20 to 34 years | 2 (66.7%) | 1 (33.3%) |
| 35 to 50 years | 0 (0.0%) | 0 (0.0%) |
| Total | 2 (66.7%) | 1 (33.3%) |
Fertility by Education in Park
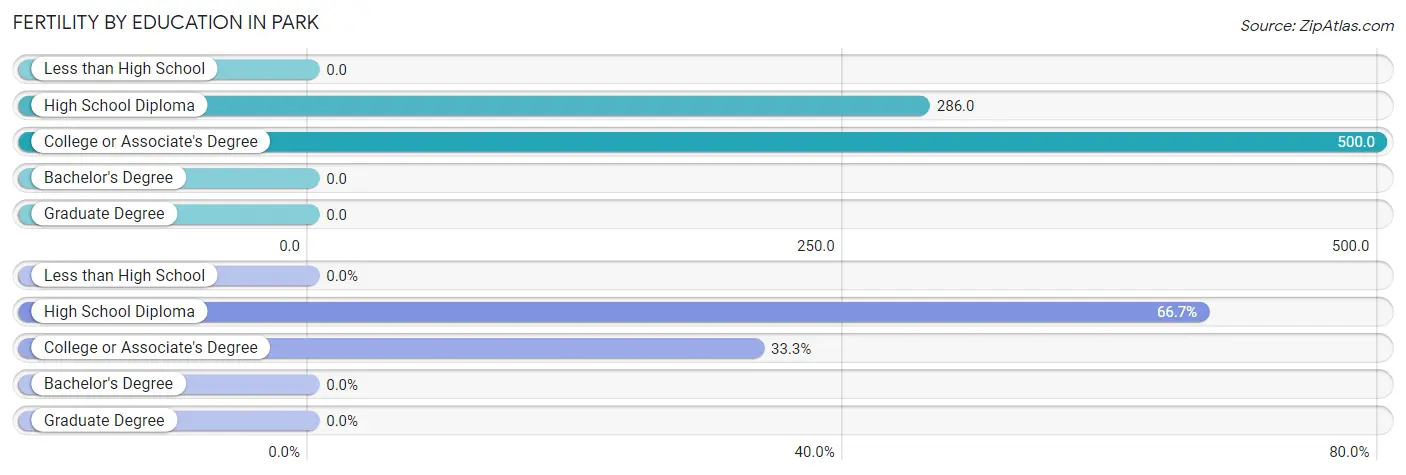
| Educational Attainment | Women with Births | Births / 1,000 Women |
| Less than High School | 0 (0.0%) | 0.0 |
| High School Diploma | 2 (66.7%) | 286.0 |
| College or Associate's Degree | 1 (33.3%) | 500.0 |
| Bachelor's Degree | 0 (0.0%) | 0.0 |
| Graduate Degree | 0 (0.0%) | 0.0 |
| Total | 3 (100.0%) | 273.0 |
Fertility by Education by Marriage Status in Park
33.3% of women with births in Park are unmarried. Women with the educational attainment of high school diploma are most likely to be married with 100.0% of them married at childbirth, while women with the educational attainment of college or associate's degree are least likely to be married with 100.0% of them unmarried at childbirth.

| Educational Attainment | Married | Unmarried |
| Less than High School | 0 (0.0%) | 0 (0.0%) |
| High School Diploma | 2 (100.0%) | 0 (0.0%) |
| College or Associate's Degree | 0 (0.0%) | 1 (100.0%) |
| Bachelor's Degree | 0 (0.0%) | 0 (0.0%) |
| Graduate Degree | 0 (0.0%) | 0 (0.0%) |
| Total | 2 (66.7%) | 1 (33.3%) |
Employment Characteristics in Park
Employment by Class of Employer in Park
Among the 64 employed individuals in Park, private company employees (42 | 65.6%), local government employees (9 | 14.1%), and self-employed (incorporated) (5 | 7.8%) make up the most common classes of employment.
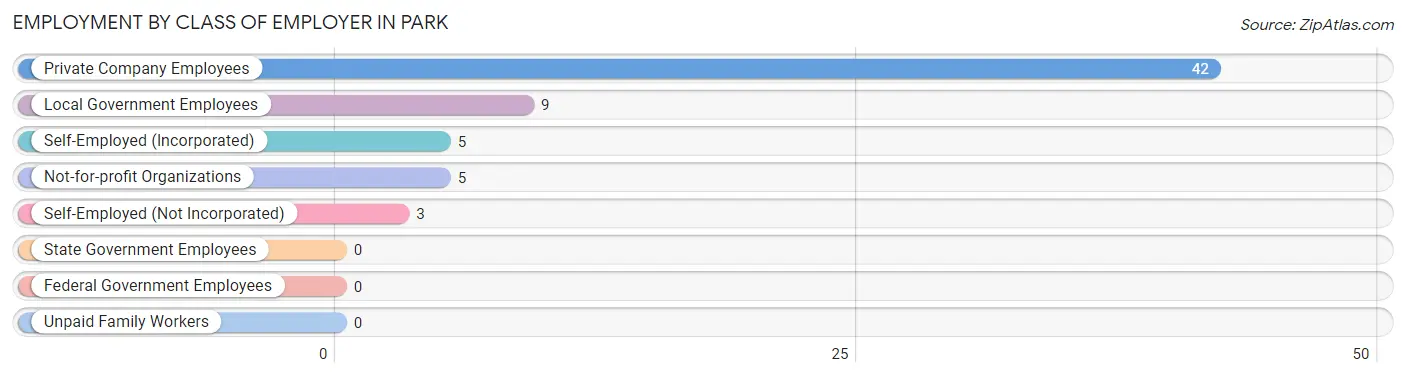
| Employer Class | # Employees | % Employees |
| Private Company Employees | 42 | 65.6% |
| Self-Employed (Incorporated) | 5 | 7.8% |
| Self-Employed (Not Incorporated) | 3 | 4.7% |
| Not-for-profit Organizations | 5 | 7.8% |
| Local Government Employees | 9 | 14.1% |
| State Government Employees | 0 | 0.0% |
| Federal Government Employees | 0 | 0.0% |
| Unpaid Family Workers | 0 | 0.0% |
| Total | 64 | 100.0% |
Employment Status by Age in Park
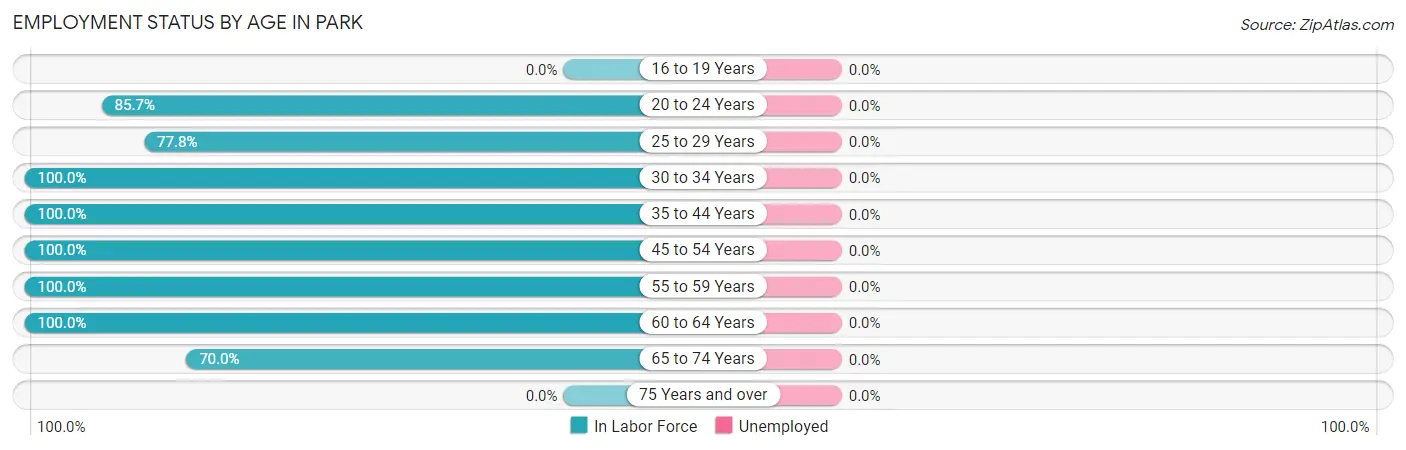
| Age Bracket | In Labor Force | Unemployed |
| 16 to 19 Years | 0 (0.0%) | 0 (0.0%) |
| 20 to 24 Years | 6 (85.7%) | 0 (0.0%) |
| 25 to 29 Years | 7 (77.8%) | 0 (0.0%) |
| 30 to 34 Years | 1 (100.0%) | 0 (0.0%) |
| 35 to 44 Years | 2 (100.0%) | 0 (0.0%) |
| 45 to 54 Years | 23 (100.0%) | 0 (0.0%) |
| 55 to 59 Years | 12 (100.0%) | 0 (0.0%) |
| 60 to 64 Years | 7 (100.0%) | 0 (0.0%) |
| 65 to 74 Years | 7 (70.0%) | 0 (0.0%) |
| 75 Years and over | 0 (0.0%) | 0 (0.0%) |
| Total | 65 (78.3%) | 0 (0.0%) |
Employment Status by Educational Attainment in Park
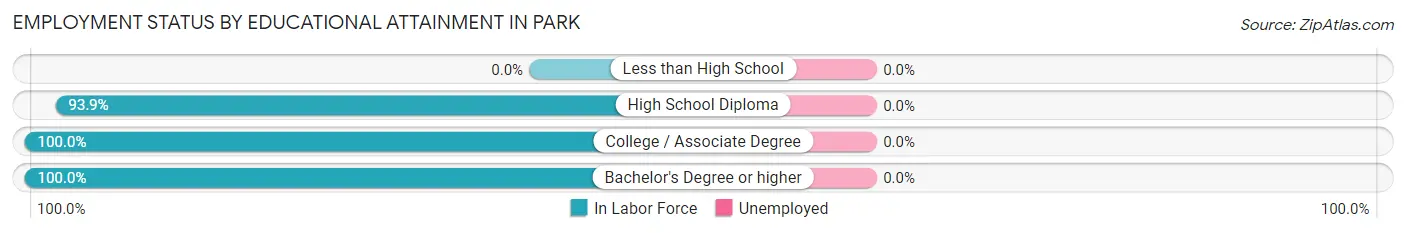
| Educational Attainment | In Labor Force | Unemployed |
| Less than High School | 0 (0.0%) | 0 (0.0%) |
| High School Diploma | 31 (93.9%) | 0 (0.0%) |
| College / Associate Degree | 17 (100.0%) | 0 (0.0%) |
| Bachelor's Degree or higher | 4 (100.0%) | 0 (0.0%) |
| Total | 52 (96.3%) | 0 (0.0%) |
Employment Occupations by Sex in Park
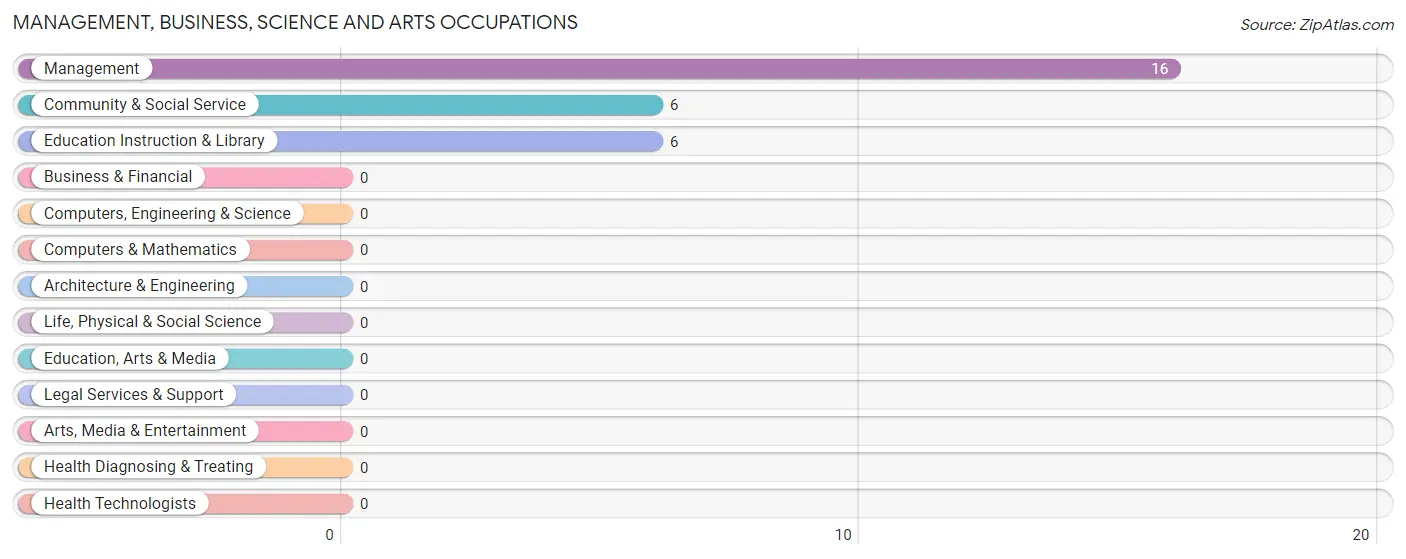
Management, Business, Science and Arts Occupations
The most common Management, Business, Science and Arts occupations in Park are Management (16 | 24.6%), Community & Social Service (6 | 9.2%), and Education Instruction & Library (6 | 9.2%).
Management, Business, Science and Arts Occupations by Sex
Within the Management, Business, Science and Arts occupations in Park, the most male-oriented occupations are Management (81.2%), Community & Social Service (33.3%), and Education Instruction & Library (33.3%), while the most female-oriented occupations are Community & Social Service (66.7%), Education Instruction & Library (66.7%), and Management (18.8%).
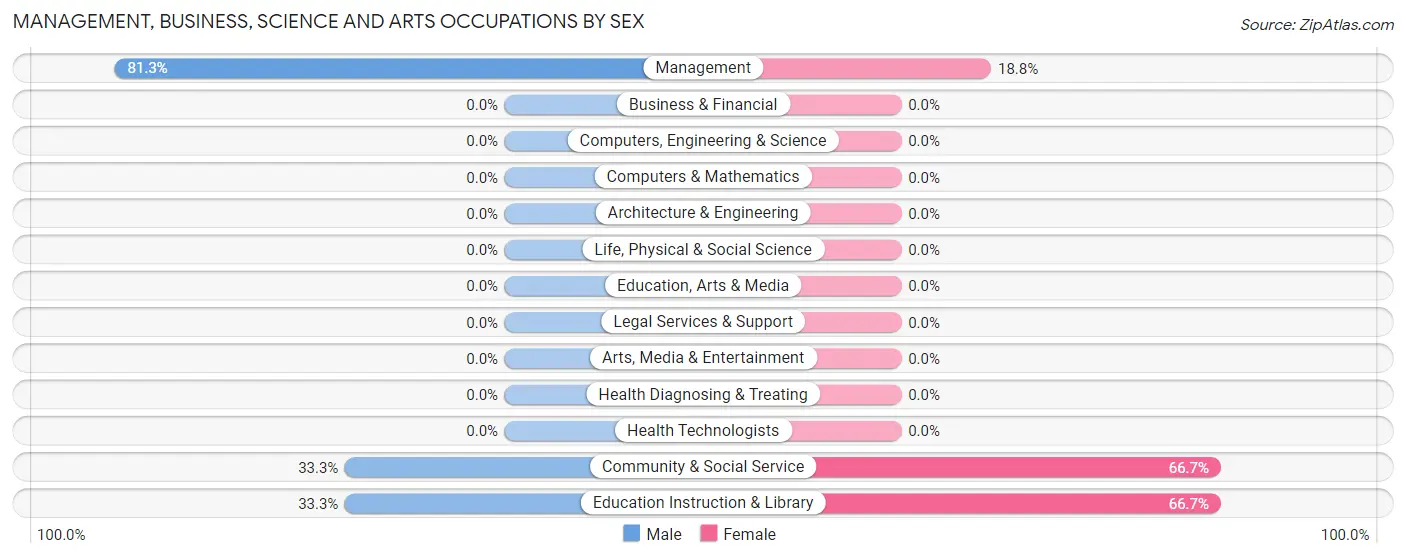
| Occupation | Male | Female |
| Management | 13 (81.2%) | 3 (18.8%) |
| Business & Financial | 0 (0.0%) | 0 (0.0%) |
| Computers, Engineering & Science | 0 (0.0%) | 0 (0.0%) |
| Computers & Mathematics | 0 (0.0%) | 0 (0.0%) |
| Architecture & Engineering | 0 (0.0%) | 0 (0.0%) |
| Life, Physical & Social Science | 0 (0.0%) | 0 (0.0%) |
| Community & Social Service | 2 (33.3%) | 4 (66.7%) |
| Education, Arts & Media | 0 (0.0%) | 0 (0.0%) |
| Legal Services & Support | 0 (0.0%) | 0 (0.0%) |
| Education Instruction & Library | 2 (33.3%) | 4 (66.7%) |
| Arts, Media & Entertainment | 0 (0.0%) | 0 (0.0%) |
| Health Diagnosing & Treating | 0 (0.0%) | 0 (0.0%) |
| Health Technologists | 0 (0.0%) | 0 (0.0%) |
| Total (Category) | 15 (68.2%) | 7 (31.8%) |
| Total (Overall) | 37 (56.9%) | 28 (43.1%) |
Services Occupations
The most common Services occupations in Park are Food Preparation & Serving (10 | 15.4%), and Healthcare Support (6 | 9.2%).
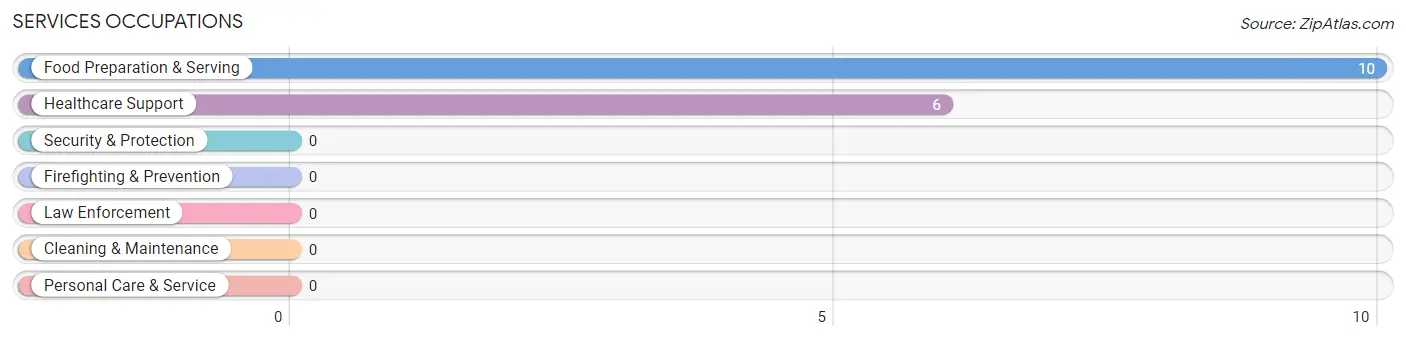
Services Occupations by Sex
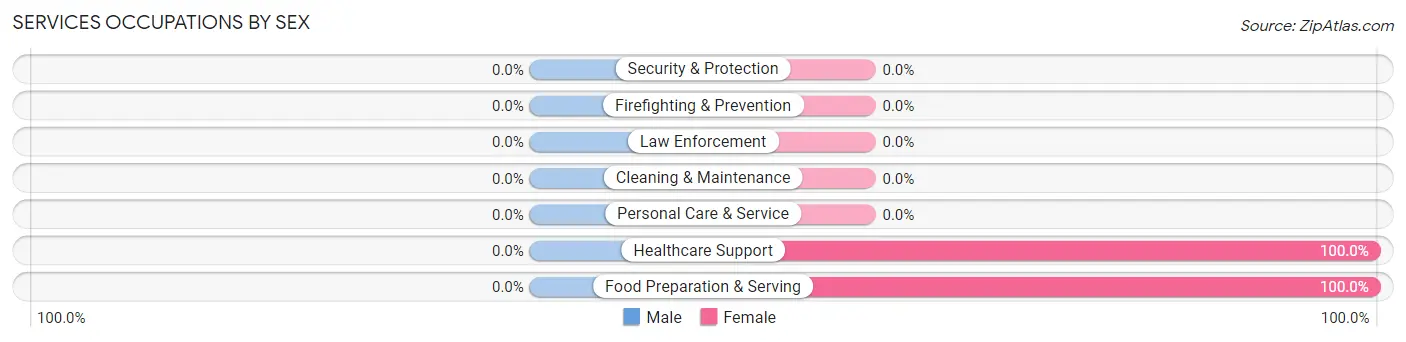
| Occupation | Male | Female |
| Healthcare Support | 0 (0.0%) | 6 (100.0%) |
| Security & Protection | 0 (0.0%) | 0 (0.0%) |
| Firefighting & Prevention | 0 (0.0%) | 0 (0.0%) |
| Law Enforcement | 0 (0.0%) | 0 (0.0%) |
| Food Preparation & Serving | 0 (0.0%) | 10 (100.0%) |
| Cleaning & Maintenance | 0 (0.0%) | 0 (0.0%) |
| Personal Care & Service | 0 (0.0%) | 0 (0.0%) |
| Total (Category) | 0 (0.0%) | 16 (100.0%) |
| Total (Overall) | 37 (56.9%) | 28 (43.1%) |
Sales and Office Occupations
The most common Sales and Office occupations in Park are Office & Administration (5 | 7.7%), and Sales & Related (2 | 3.1%).
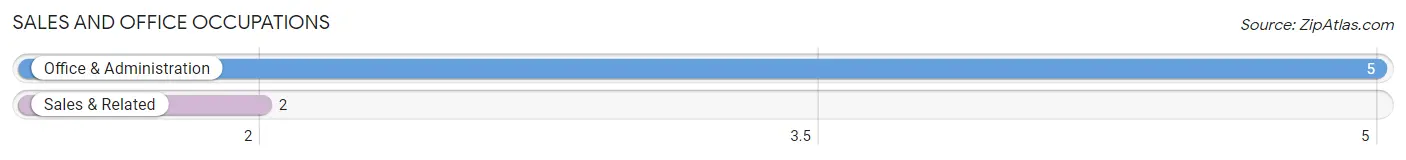
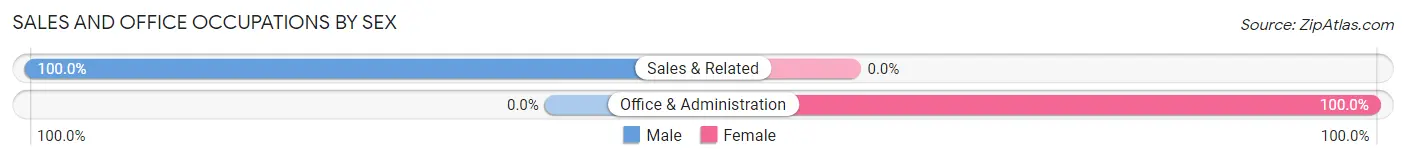
Sales and Office Occupations by Sex
| Occupation | Male | Female |
| Sales & Related | 2 (100.0%) | 0 (0.0%) |
| Office & Administration | 0 (0.0%) | 5 (100.0%) |
| Total (Category) | 2 (28.6%) | 5 (71.4%) |
| Total (Overall) | 37 (56.9%) | 28 (43.1%) |
Natural Resources, Construction and Maintenance Occupations
The most common Natural Resources, Construction and Maintenance occupations in Park are Installation, Maintenance & Repair (10 | 15.4%), and Farming, Fishing & Forestry (1 | 1.5%).
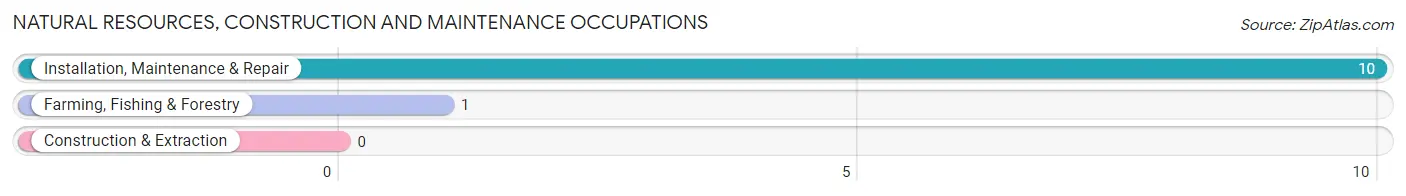
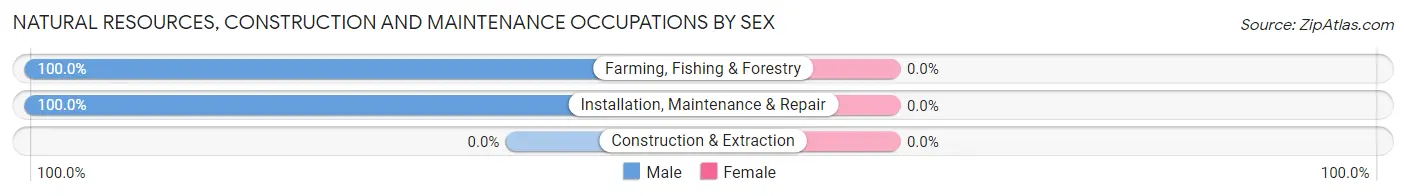
Natural Resources, Construction and Maintenance Occupations by Sex
| Occupation | Male | Female |
| Farming, Fishing & Forestry | 1 (100.0%) | 0 (0.0%) |
| Construction & Extraction | 0 (0.0%) | 0 (0.0%) |
| Installation, Maintenance & Repair | 10 (100.0%) | 0 (0.0%) |
| Total (Category) | 11 (100.0%) | 0 (0.0%) |
| Total (Overall) | 37 (56.9%) | 28 (43.1%) |
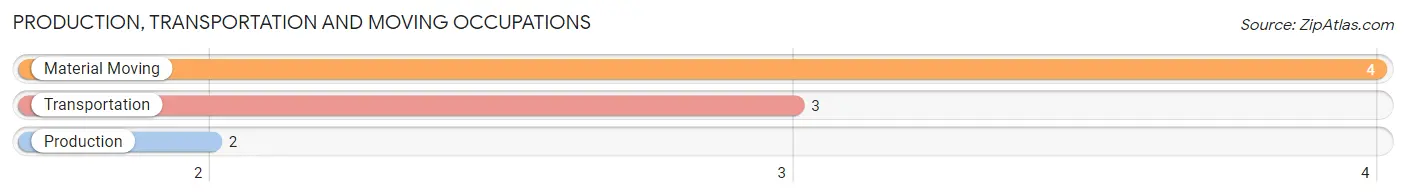
Production, Transportation and Moving Occupations
The most common Production, Transportation and Moving occupations in Park are Material Moving (4 | 6.1%), Transportation (3 | 4.6%), and Production (2 | 3.1%).
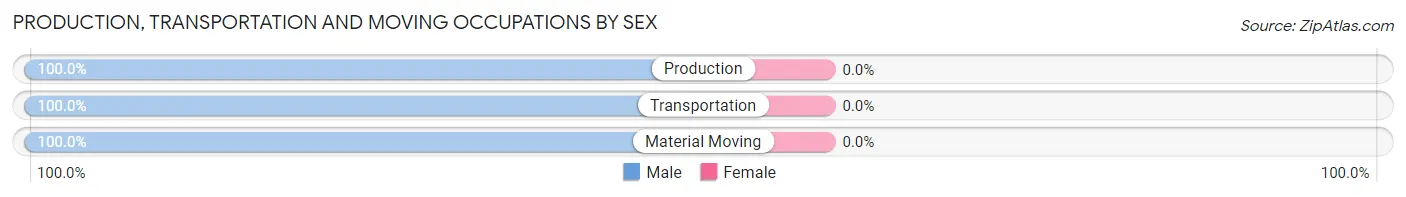
Production, Transportation and Moving Occupations by Sex
| Occupation | Male | Female |
| Production | 2 (100.0%) | 0 (0.0%) |
| Transportation | 3 (100.0%) | 0 (0.0%) |
| Material Moving | 4 (100.0%) | 0 (0.0%) |
| Total (Category) | 9 (100.0%) | 0 (0.0%) |
| Total (Overall) | 37 (56.9%) | 28 (43.1%) |
Employment Industries by Sex in Park
Employment Industries in Park
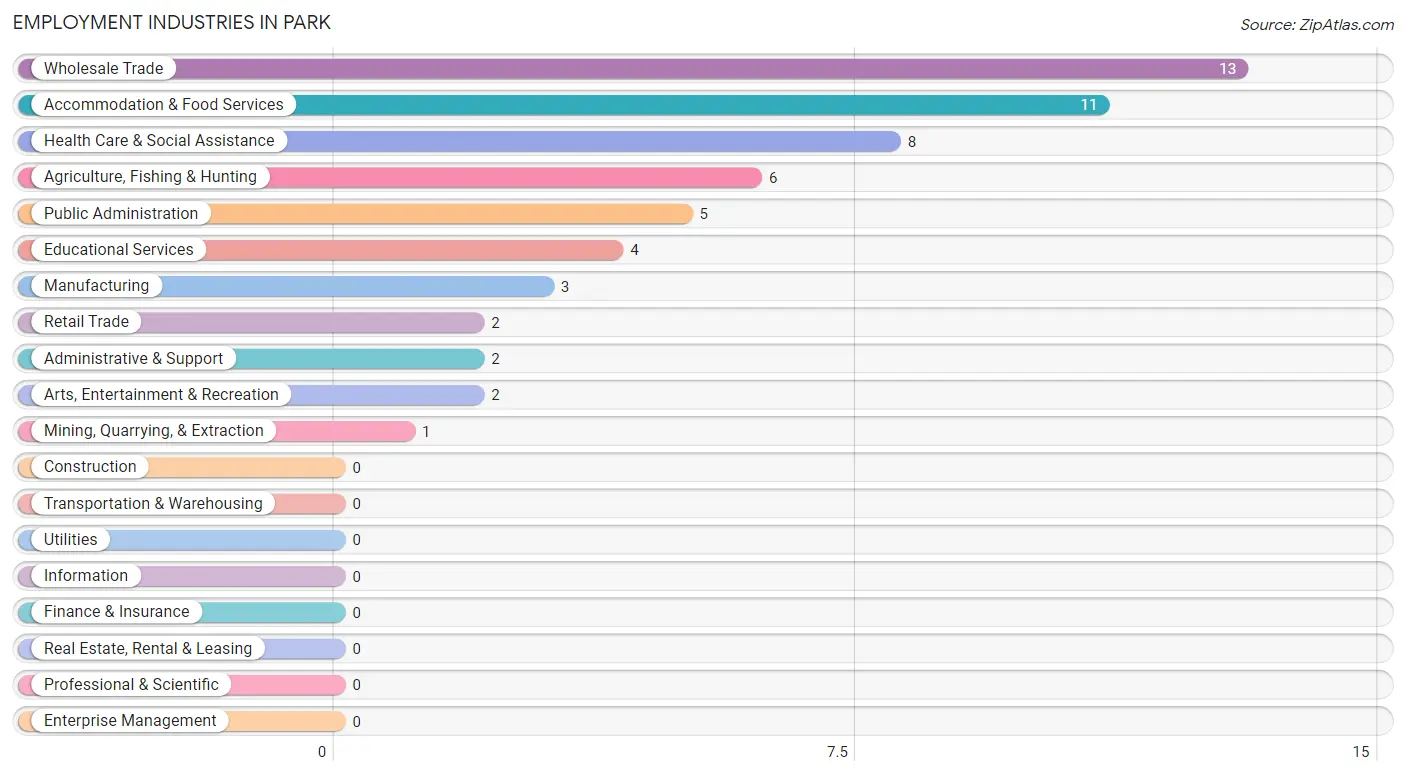
The major employment industries in Park include Wholesale Trade (13 | 20.0%), Accommodation & Food Services (11 | 16.9%), Health Care & Social Assistance (8 | 12.3%), Agriculture, Fishing & Hunting (6 | 9.2%), and Public Administration (5 | 7.7%).
Employment Industries by Sex in Park
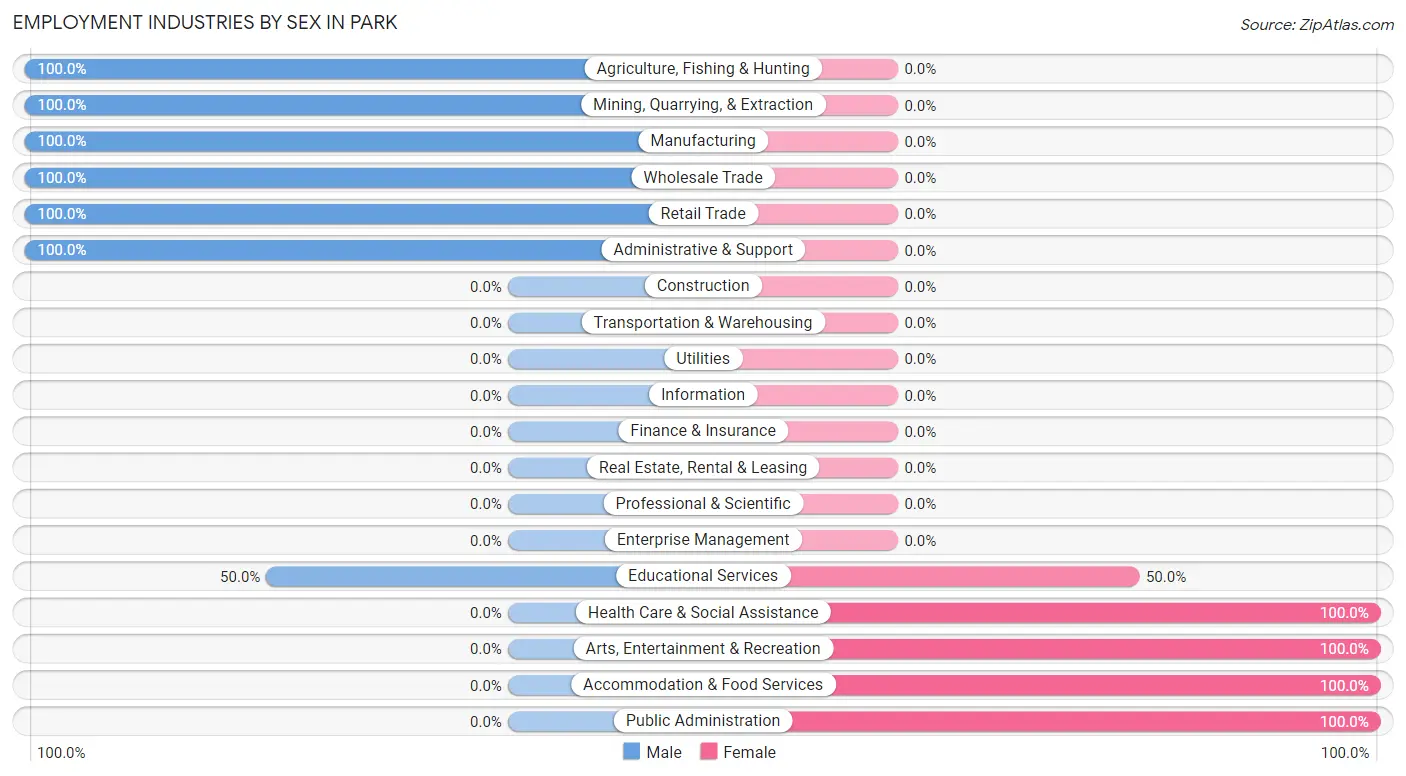
The Park industries that see more men than women are Agriculture, Fishing & Hunting (100.0%), Mining, Quarrying, & Extraction (100.0%), and Manufacturing (100.0%), whereas the industries that tend to have a higher number of women are Health Care & Social Assistance (100.0%), Arts, Entertainment & Recreation (100.0%), and Accommodation & Food Services (100.0%).
| Industry | Male | Female |
| Agriculture, Fishing & Hunting | 6 (100.0%) | 0 (0.0%) |
| Mining, Quarrying, & Extraction | 1 (100.0%) | 0 (0.0%) |
| Construction | 0 (0.0%) | 0 (0.0%) |
| Manufacturing | 3 (100.0%) | 0 (0.0%) |
| Wholesale Trade | 13 (100.0%) | 0 (0.0%) |
| Retail Trade | 2 (100.0%) | 0 (0.0%) |
| Transportation & Warehousing | 0 (0.0%) | 0 (0.0%) |
| Utilities | 0 (0.0%) | 0 (0.0%) |
| Information | 0 (0.0%) | 0 (0.0%) |
| Finance & Insurance | 0 (0.0%) | 0 (0.0%) |
| Real Estate, Rental & Leasing | 0 (0.0%) | 0 (0.0%) |
| Professional & Scientific | 0 (0.0%) | 0 (0.0%) |
| Enterprise Management | 0 (0.0%) | 0 (0.0%) |
| Administrative & Support | 2 (100.0%) | 0 (0.0%) |
| Educational Services | 2 (50.0%) | 2 (50.0%) |
| Health Care & Social Assistance | 0 (0.0%) | 8 (100.0%) |
| Arts, Entertainment & Recreation | 0 (0.0%) | 2 (100.0%) |
| Accommodation & Food Services | 0 (0.0%) | 11 (100.0%) |
| Public Administration | 0 (0.0%) | 5 (100.0%) |
| Total | 37 (56.9%) | 28 (43.1%) |
Education in Park
School Enrollment in Park
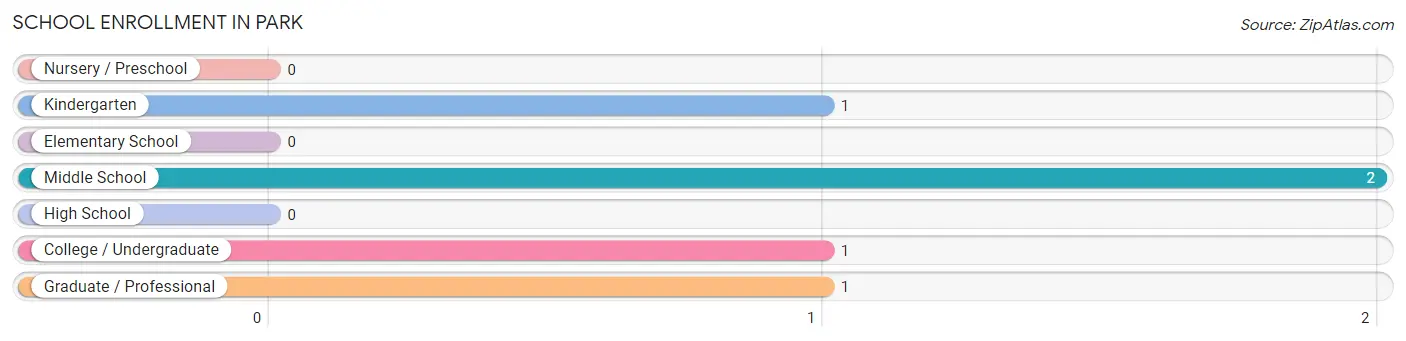
The most common levels of schooling among the 5 students in Park are middle school (2 | 40.0%), kindergarten (1 | 20.0%), and college / undergraduate (1 | 20.0%).
| School Level | # Students | % Students |
| Nursery / Preschool | 0 | 0.0% |
| Kindergarten | 1 | 20.0% |
| Elementary School | 0 | 0.0% |
| Middle School | 2 | 40.0% |
| High School | 0 | 0.0% |
| College / Undergraduate | 1 | 20.0% |
| Graduate / Professional | 1 | 20.0% |
| Total | 5 | 100.0% |
School Enrollment by Age by Funding Source in Park
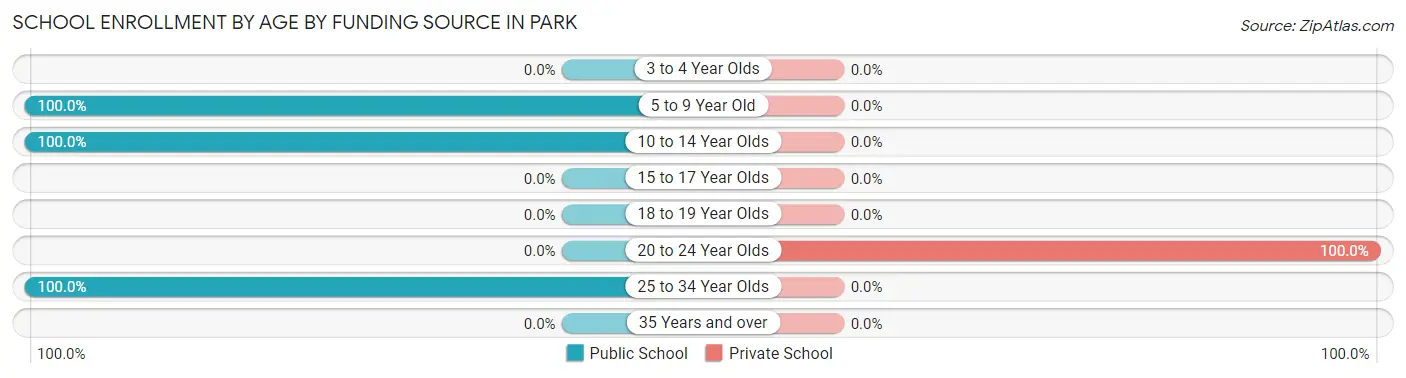
Out of a total of 5 students who are enrolled in schools in Park, 1 (20.0%) attend a private institution, while the remaining 4 (80.0%) are enrolled in public schools. The age group of 20 to 24 year olds has the highest likelihood of being enrolled in private schools, with 1 (100.0% in the age bracket) enrolled. Conversely, the age group of 5 to 9 year old has the lowest likelihood of being enrolled in a private school, with 1 (100.0% in the age bracket) attending a public institution.
| Age Bracket | Public School | Private School |
| 3 to 4 Year Olds | 0 (0.0%) | 0 (0.0%) |
| 5 to 9 Year Old | 1 (100.0%) | 0 (0.0%) |
| 10 to 14 Year Olds | 2 (100.0%) | 0 (0.0%) |
| 15 to 17 Year Olds | 0 (0.0%) | 0 (0.0%) |
| 18 to 19 Year Olds | 0 (0.0%) | 0 (0.0%) |
| 20 to 24 Year Olds | 0 (0.0%) | 1 (100.0%) |
| 25 to 34 Year Olds | 1 (100.0%) | 0 (0.0%) |
| 35 Years and over | 0 (0.0%) | 0 (0.0%) |
| Total | 4 (80.0%) | 1 (20.0%) |
Educational Attainment by Field of Study in Park
Science & technology (2 | 25.0%), education (2 | 25.0%), visual & performing arts (2 | 25.0%), and arts & humanities (2 | 25.0%) are the most common fields of study among 8 individuals in Park who have obtained a bachelor's degree or higher.
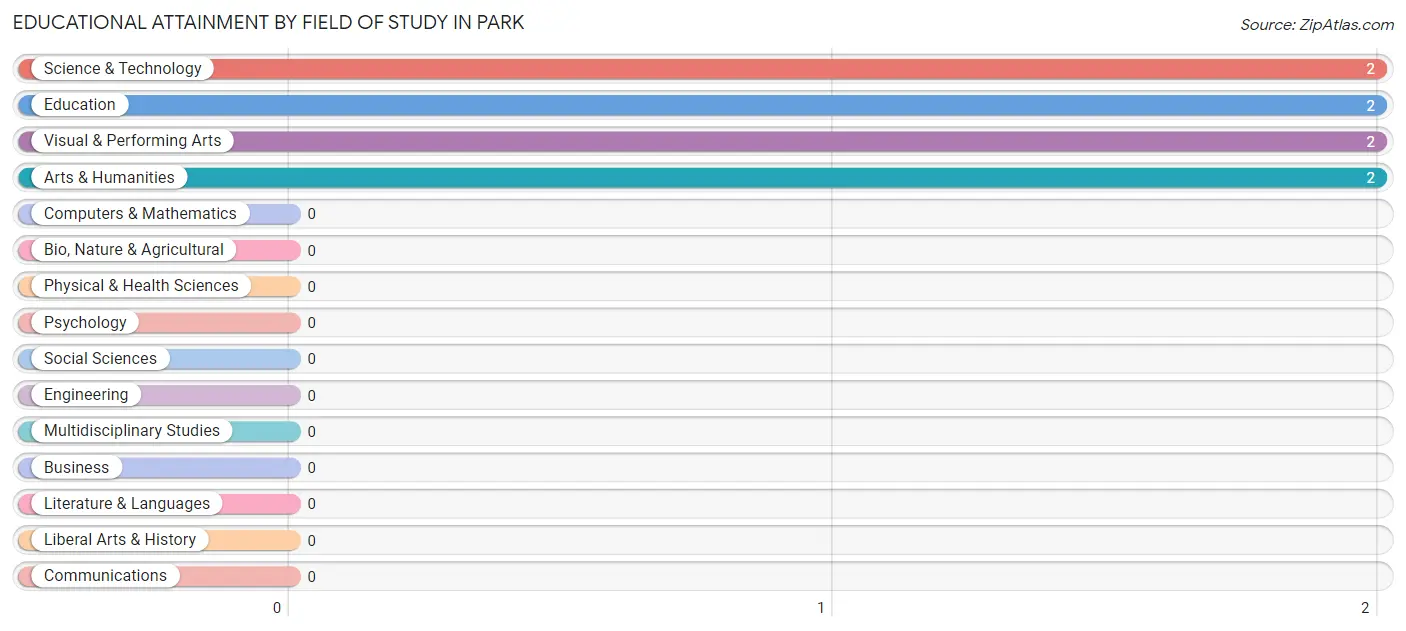
| Field of Study | # Graduates | % Graduates |
| Computers & Mathematics | 0 | 0.0% |
| Bio, Nature & Agricultural | 0 | 0.0% |
| Physical & Health Sciences | 0 | 0.0% |
| Psychology | 0 | 0.0% |
| Social Sciences | 0 | 0.0% |
| Engineering | 0 | 0.0% |
| Multidisciplinary Studies | 0 | 0.0% |
| Science & Technology | 2 | 25.0% |
| Business | 0 | 0.0% |
| Education | 2 | 25.0% |
| Literature & Languages | 0 | 0.0% |
| Liberal Arts & History | 0 | 0.0% |
| Visual & Performing Arts | 2 | 25.0% |
| Communications | 0 | 0.0% |
| Arts & Humanities | 2 | 25.0% |
| Total | 8 | 100.0% |
Transportation & Commute in Park
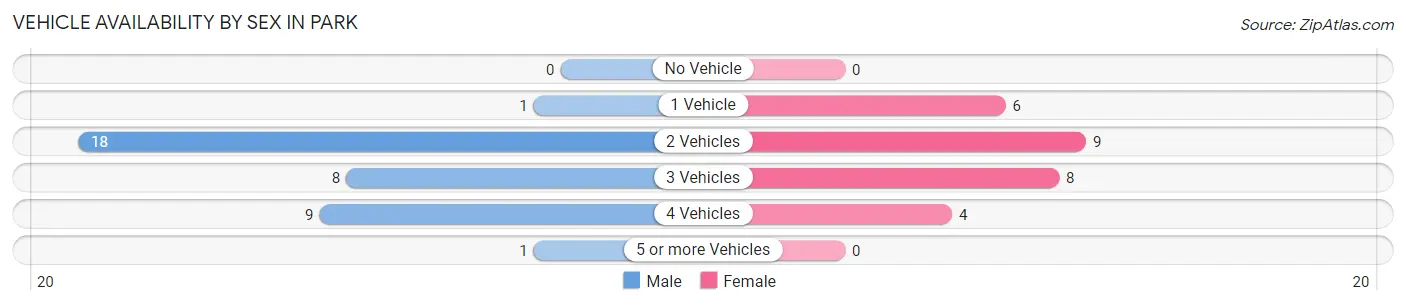
Vehicle Availability by Sex in Park
The most prevalent vehicle ownership categories in Park are males with 2 vehicles (18, accounting for 48.6%) and females with 2 vehicles (9, making up 66.7%).
| Vehicles Available | Male | Female |
| No Vehicle | 0 (0.0%) | 0 (0.0%) |
| 1 Vehicle | 1 (2.7%) | 6 (22.2%) |
| 2 Vehicles | 18 (48.6%) | 9 (33.3%) |
| 3 Vehicles | 8 (21.6%) | 8 (29.6%) |
| 4 Vehicles | 9 (24.3%) | 4 (14.8%) |
| 5 or more Vehicles | 1 (2.7%) | 0 (0.0%) |
| Total | 37 (100.0%) | 27 (100.0%) |
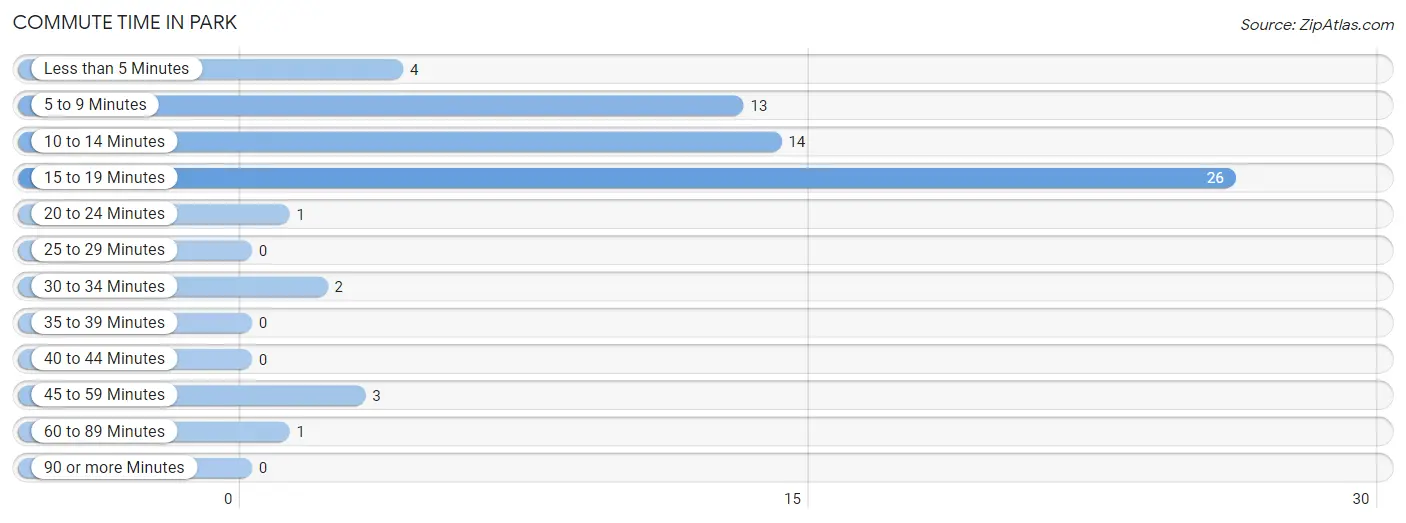
Commute Time in Park
The most frequently occuring commute durations in Park are 15 to 19 minutes (26 commuters, 40.6%), 10 to 14 minutes (14 commuters, 21.9%), and 5 to 9 minutes (13 commuters, 20.3%).
| Commute Time | # Commuters | % Commuters |
| Less than 5 Minutes | 4 | 6.2% |
| 5 to 9 Minutes | 13 | 20.3% |
| 10 to 14 Minutes | 14 | 21.9% |
| 15 to 19 Minutes | 26 | 40.6% |
| 20 to 24 Minutes | 1 | 1.6% |
| 25 to 29 Minutes | 0 | 0.0% |
| 30 to 34 Minutes | 2 | 3.1% |
| 35 to 39 Minutes | 0 | 0.0% |
| 40 to 44 Minutes | 0 | 0.0% |
| 45 to 59 Minutes | 3 | 4.7% |
| 60 to 89 Minutes | 1 | 1.6% |
| 90 or more Minutes | 0 | 0.0% |
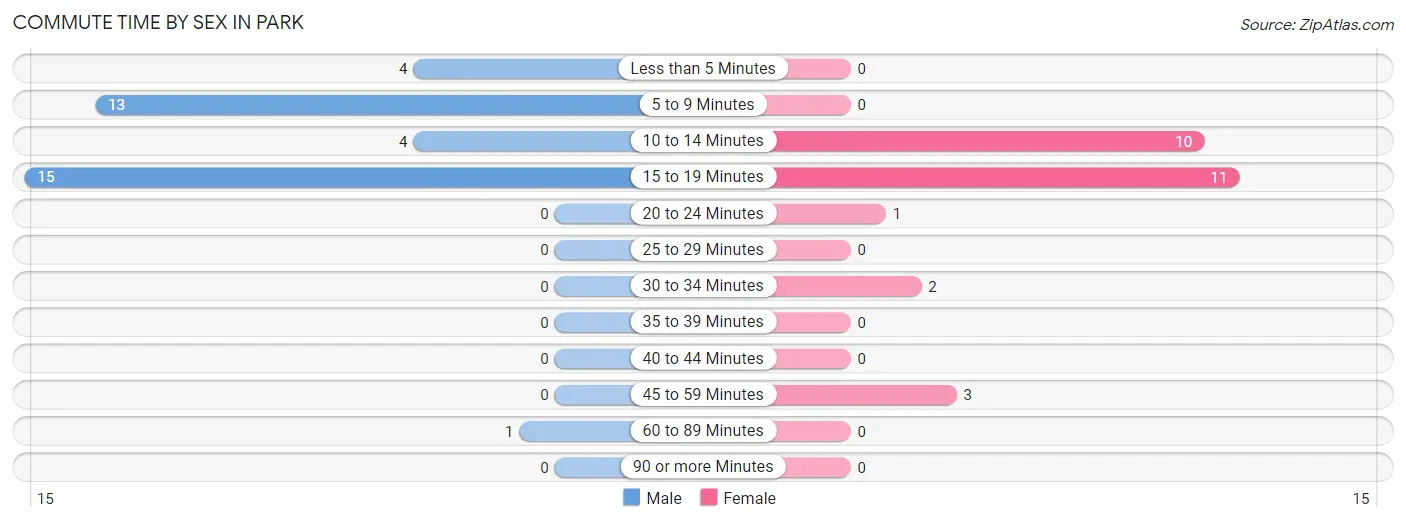
Commute Time by Sex in Park
The most common commute times in Park are 15 to 19 minutes (15 commuters, 40.5%) for males and 15 to 19 minutes (11 commuters, 40.7%) for females.
| Commute Time | Male | Female |
| Less than 5 Minutes | 4 (10.8%) | 0 (0.0%) |
| 5 to 9 Minutes | 13 (35.1%) | 0 (0.0%) |
| 10 to 14 Minutes | 4 (10.8%) | 10 (37.0%) |
| 15 to 19 Minutes | 15 (40.5%) | 11 (40.7%) |
| 20 to 24 Minutes | 0 (0.0%) | 1 (3.7%) |
| 25 to 29 Minutes | 0 (0.0%) | 0 (0.0%) |
| 30 to 34 Minutes | 0 (0.0%) | 2 (7.4%) |
| 35 to 39 Minutes | 0 (0.0%) | 0 (0.0%) |
| 40 to 44 Minutes | 0 (0.0%) | 0 (0.0%) |
| 45 to 59 Minutes | 0 (0.0%) | 3 (11.1%) |
| 60 to 89 Minutes | 1 (2.7%) | 0 (0.0%) |
| 90 or more Minutes | 0 (0.0%) | 0 (0.0%) |
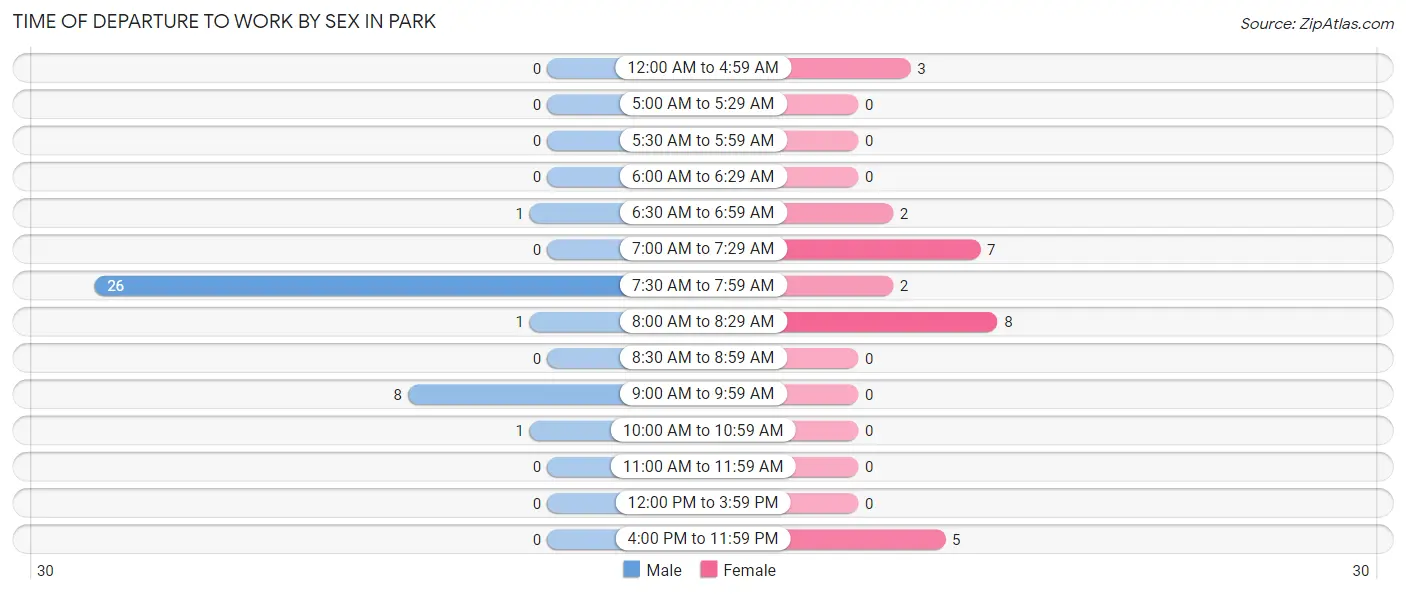
Time of Departure to Work by Sex in Park
The most frequent times of departure to work in Park are 7:30 AM to 7:59 AM (26, 70.3%) for males and 8:00 AM to 8:29 AM (8, 29.6%) for females.
| Time of Departure | Male | Female |
| 12:00 AM to 4:59 AM | 0 (0.0%) | 3 (11.1%) |
| 5:00 AM to 5:29 AM | 0 (0.0%) | 0 (0.0%) |
| 5:30 AM to 5:59 AM | 0 (0.0%) | 0 (0.0%) |
| 6:00 AM to 6:29 AM | 0 (0.0%) | 0 (0.0%) |
| 6:30 AM to 6:59 AM | 1 (2.7%) | 2 (7.4%) |
| 7:00 AM to 7:29 AM | 0 (0.0%) | 7 (25.9%) |
| 7:30 AM to 7:59 AM | 26 (70.3%) | 2 (7.4%) |
| 8:00 AM to 8:29 AM | 1 (2.7%) | 8 (29.6%) |
| 8:30 AM to 8:59 AM | 0 (0.0%) | 0 (0.0%) |
| 9:00 AM to 9:59 AM | 8 (21.6%) | 0 (0.0%) |
| 10:00 AM to 10:59 AM | 1 (2.7%) | 0 (0.0%) |
| 11:00 AM to 11:59 AM | 0 (0.0%) | 0 (0.0%) |
| 12:00 PM to 3:59 PM | 0 (0.0%) | 0 (0.0%) |
| 4:00 PM to 11:59 PM | 0 (0.0%) | 5 (18.5%) |
| Total | 37 (100.0%) | 27 (100.0%) |
Housing Occupancy in Park
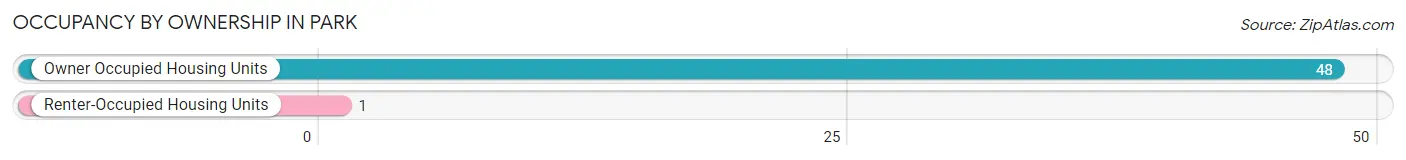
Occupancy by Ownership in Park
Of the total 49 dwellings in Park, owner-occupied units account for 48 (98.0%), while renter-occupied units make up 1 (2.0%).
| Occupancy | # Housing Units | % Housing Units |
| Owner Occupied Housing Units | 48 | 98.0% |
| Renter-Occupied Housing Units | 1 | 2.0% |
| Total Occupied Housing Units | 49 | 100.0% |
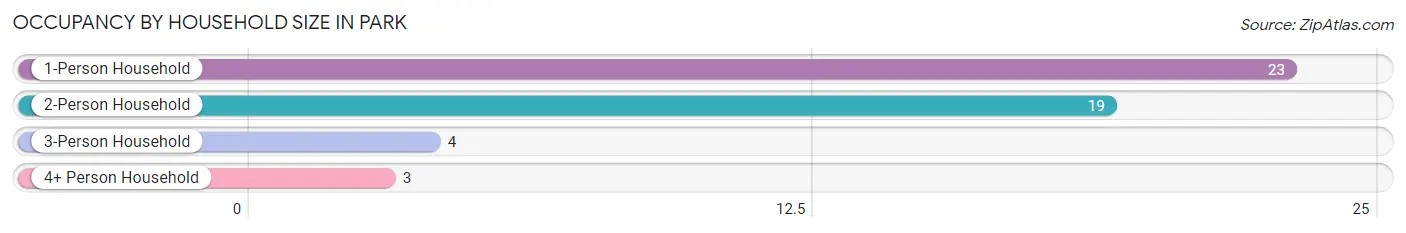
Occupancy by Household Size in Park
| Household Size | # Housing Units | % Housing Units |
| 1-Person Household | 23 | 46.9% |
| 2-Person Household | 19 | 38.8% |
| 3-Person Household | 4 | 8.2% |
| 4+ Person Household | 3 | 6.1% |
| Total Housing Units | 49 | 100.0% |
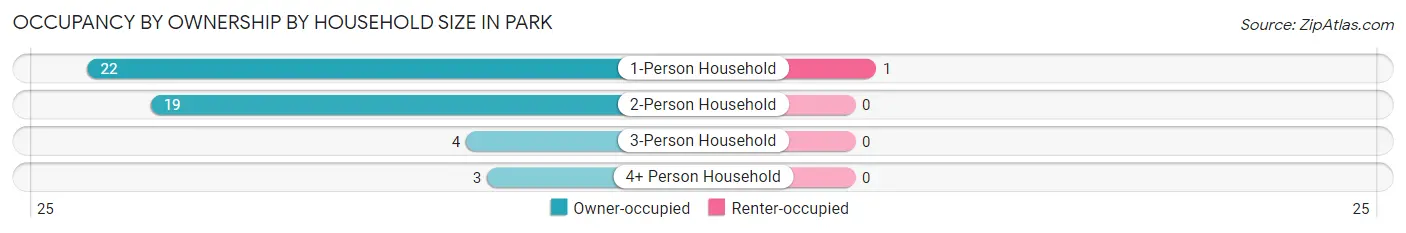
Occupancy by Ownership by Household Size in Park
| Household Size | Owner-occupied | Renter-occupied |
| 1-Person Household | 22 (95.7%) | 1 (4.3%) |
| 2-Person Household | 19 (100.0%) | 0 (0.0%) |
| 3-Person Household | 4 (100.0%) | 0 (0.0%) |
| 4+ Person Household | 3 (100.0%) | 0 (0.0%) |
| Total Housing Units | 48 (98.0%) | 1 (2.0%) |
Occupancy by Educational Attainment in Park
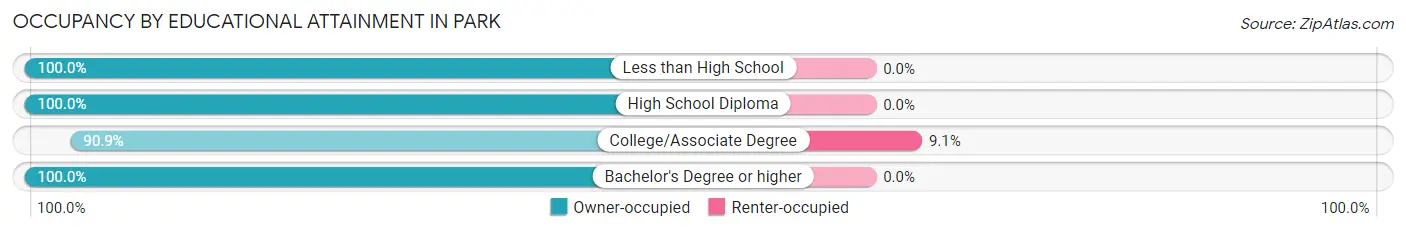
| Household Size | Owner-occupied | Renter-occupied |
| Less than High School | 1 (100.0%) | 0 (0.0%) |
| High School Diploma | 30 (100.0%) | 0 (0.0%) |
| College/Associate Degree | 10 (90.9%) | 1 (9.1%) |
| Bachelor's Degree or higher | 7 (100.0%) | 0 (0.0%) |
Occupancy by Age of Householder in Park
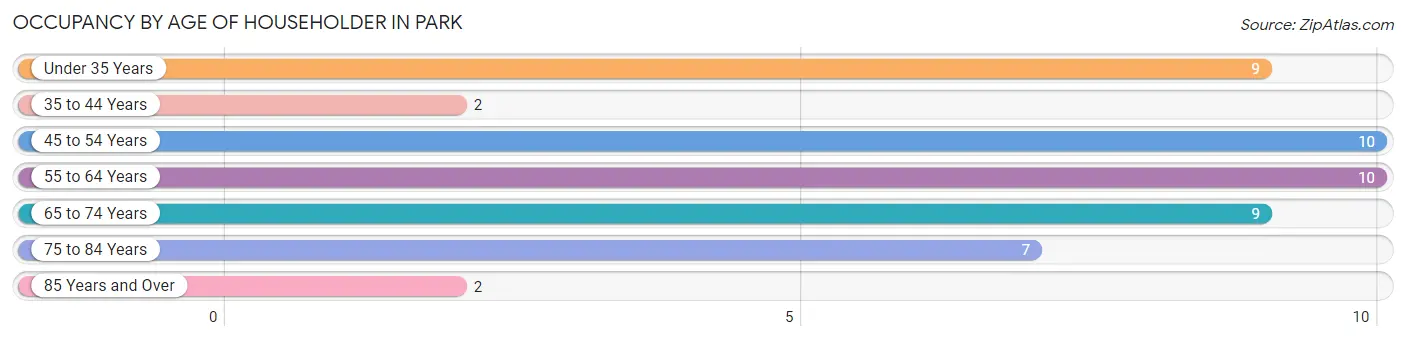
| Age Bracket | # Households | % Households |
| Under 35 Years | 9 | 18.4% |
| 35 to 44 Years | 2 | 4.1% |
| 45 to 54 Years | 10 | 20.4% |
| 55 to 64 Years | 10 | 20.4% |
| 65 to 74 Years | 9 | 18.4% |
| 75 to 84 Years | 7 | 14.3% |
| 85 Years and Over | 2 | 4.1% |
| Total | 49 | 100.0% |
Housing Finances in Park
Median Income by Occupancy in Park
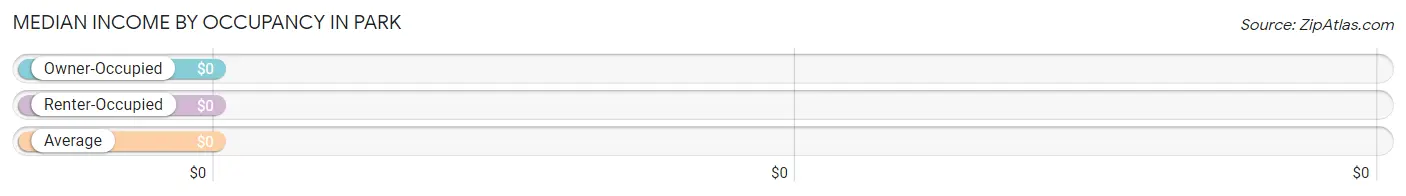
| Occupancy Type | # Households | Median Income |
| Owner-Occupied | 48 (98.0%) | $0 |
| Renter-Occupied | 1 (2.0%) | $0 |
| Average | 49 (100.0%) | $0 |
Occupancy by Householder Income Bracket in Park
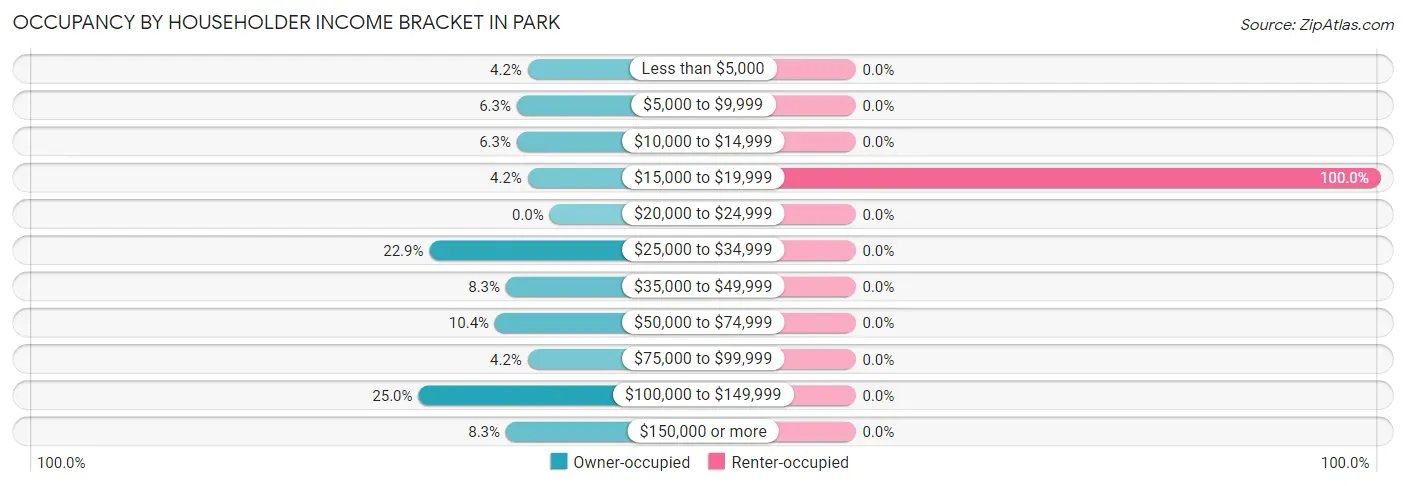
| Income Bracket | Owner-occupied | Renter-occupied |
| Less than $5,000 | 2 (4.2%) | 0 (0.0%) |
| $5,000 to $9,999 | 3 (6.2%) | 0 (0.0%) |
| $10,000 to $14,999 | 3 (6.2%) | 0 (0.0%) |
| $15,000 to $19,999 | 2 (4.2%) | 1 (100.0%) |
| $20,000 to $24,999 | 0 (0.0%) | 0 (0.0%) |
| $25,000 to $34,999 | 11 (22.9%) | 0 (0.0%) |
| $35,000 to $49,999 | 4 (8.3%) | 0 (0.0%) |
| $50,000 to $74,999 | 5 (10.4%) | 0 (0.0%) |
| $75,000 to $99,999 | 2 (4.2%) | 0 (0.0%) |
| $100,000 to $149,999 | 12 (25.0%) | 0 (0.0%) |
| $150,000 or more | 4 (8.3%) | 0 (0.0%) |
| Total | 48 (100.0%) | 1 (100.0%) |
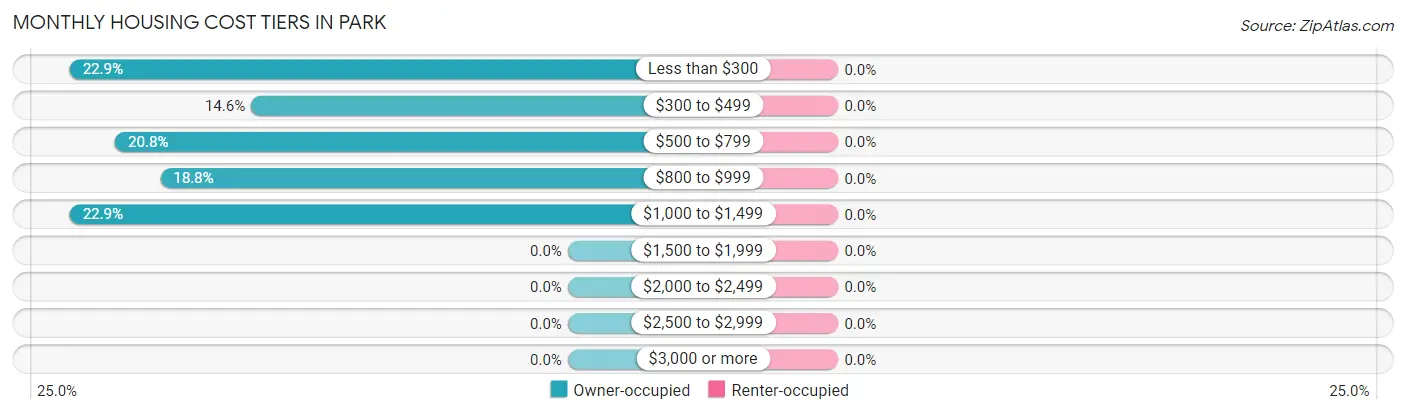
Monthly Housing Cost Tiers in Park
| Monthly Cost | Owner-occupied | Renter-occupied |
| Less than $300 | 11 (22.9%) | 0 (0.0%) |
| $300 to $499 | 7 (14.6%) | 0 (0.0%) |
| $500 to $799 | 10 (20.8%) | 0 (0.0%) |
| $800 to $999 | 9 (18.8%) | 0 (0.0%) |
| $1,000 to $1,499 | 11 (22.9%) | 0 (0.0%) |
| $1,500 to $1,999 | 0 (0.0%) | 0 (0.0%) |
| $2,000 to $2,499 | 0 (0.0%) | 0 (0.0%) |
| $2,500 to $2,999 | 0 (0.0%) | 0 (0.0%) |
| $3,000 or more | 0 (0.0%) | 0 (0.0%) |
| Total | 48 (100.0%) | 1 (100.0%) |
Physical Housing Characteristics in Park
Housing Structures in Park
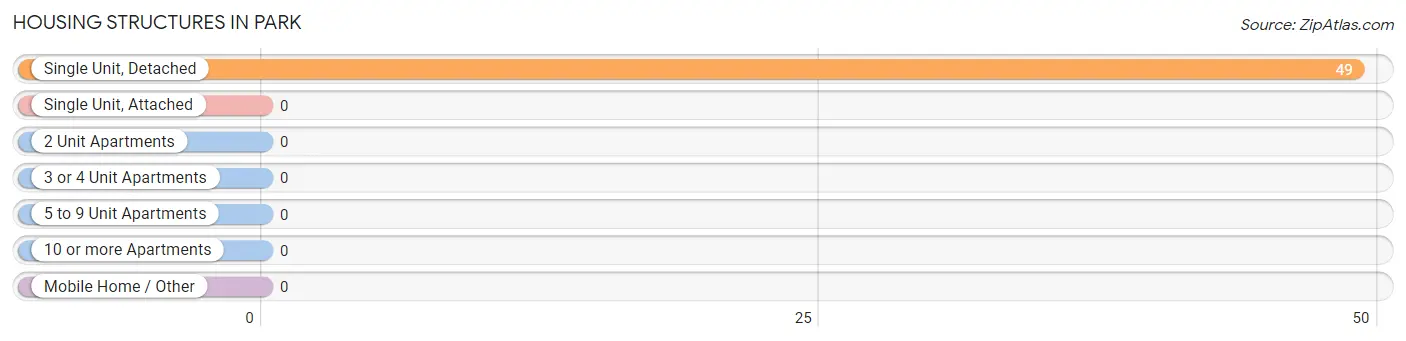
| Structure Type | # Housing Units | % Housing Units |
| Single Unit, Detached | 49 | 100.0% |
| Single Unit, Attached | 0 | 0.0% |
| 2 Unit Apartments | 0 | 0.0% |
| 3 or 4 Unit Apartments | 0 | 0.0% |
| 5 to 9 Unit Apartments | 0 | 0.0% |
| 10 or more Apartments | 0 | 0.0% |
| Mobile Home / Other | 0 | 0.0% |
| Total | 49 | 100.0% |
Housing Structures by Occupancy in Park
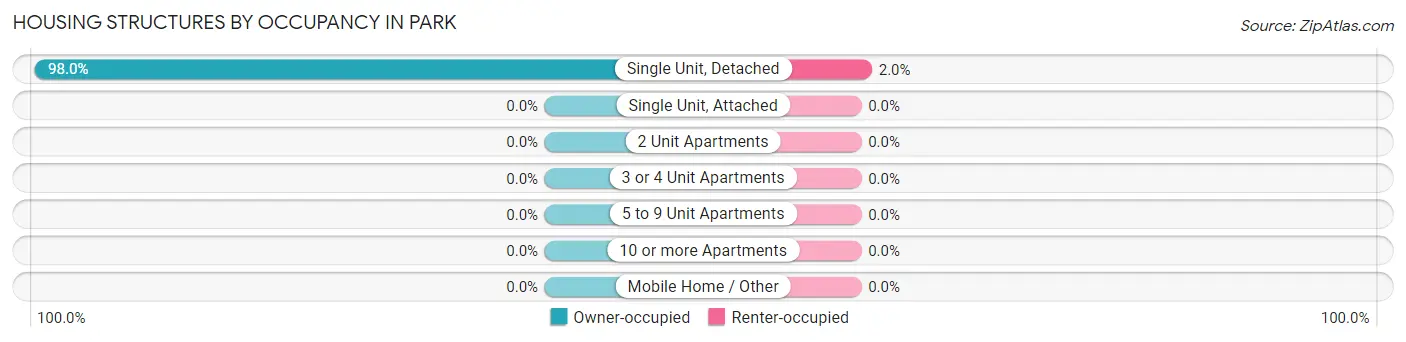
| Structure Type | Owner-occupied | Renter-occupied |
| Single Unit, Detached | 48 (98.0%) | 1 (2.0%) |
| Single Unit, Attached | 0 (0.0%) | 0 (0.0%) |
| 2 Unit Apartments | 0 (0.0%) | 0 (0.0%) |
| 3 or 4 Unit Apartments | 0 (0.0%) | 0 (0.0%) |
| 5 to 9 Unit Apartments | 0 (0.0%) | 0 (0.0%) |
| 10 or more Apartments | 0 (0.0%) | 0 (0.0%) |
| Mobile Home / Other | 0 (0.0%) | 0 (0.0%) |
| Total | 48 (98.0%) | 1 (2.0%) |
Housing Structures by Number of Rooms in Park
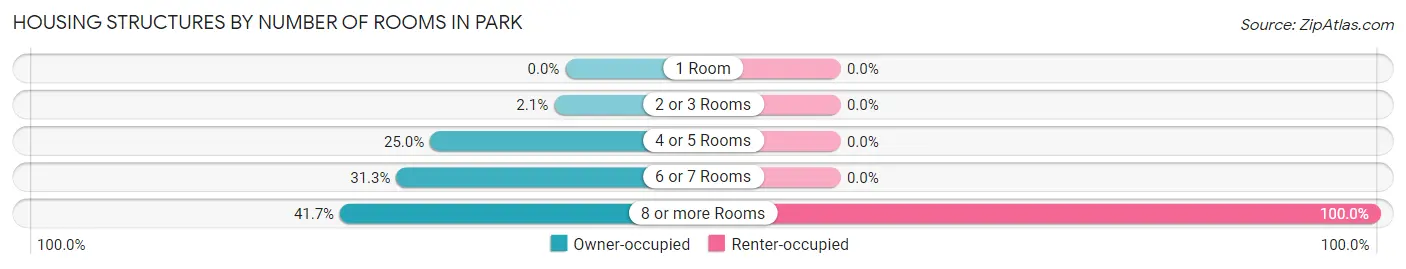
| Number of Rooms | Owner-occupied | Renter-occupied |
| 1 Room | 0 (0.0%) | 0 (0.0%) |
| 2 or 3 Rooms | 1 (2.1%) | 0 (0.0%) |
| 4 or 5 Rooms | 12 (25.0%) | 0 (0.0%) |
| 6 or 7 Rooms | 15 (31.2%) | 0 (0.0%) |
| 8 or more Rooms | 20 (41.7%) | 1 (100.0%) |
| Total | 48 (100.0%) | 1 (100.0%) |
Housing Structure by Heating Type in Park
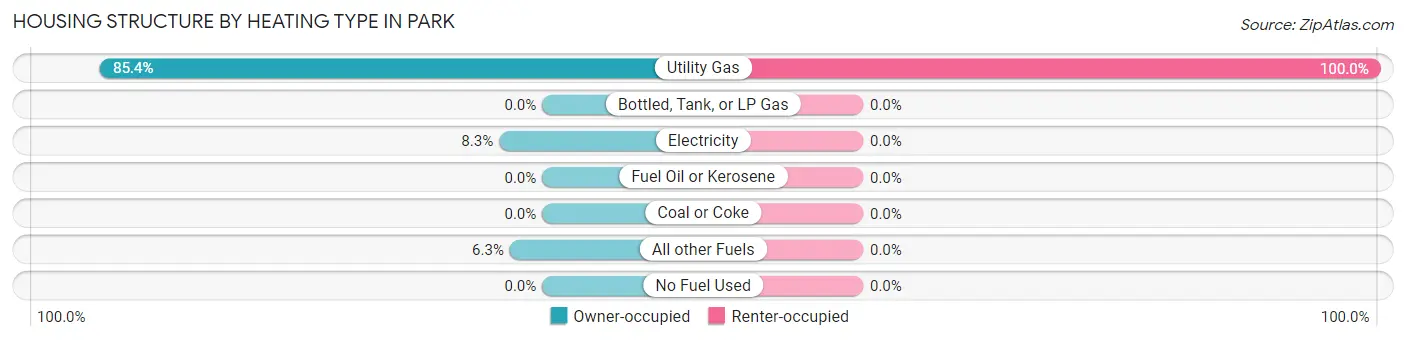
| Heating Type | Owner-occupied | Renter-occupied |
| Utility Gas | 41 (85.4%) | 1 (100.0%) |
| Bottled, Tank, or LP Gas | 0 (0.0%) | 0 (0.0%) |
| Electricity | 4 (8.3%) | 0 (0.0%) |
| Fuel Oil or Kerosene | 0 (0.0%) | 0 (0.0%) |
| Coal or Coke | 0 (0.0%) | 0 (0.0%) |
| All other Fuels | 3 (6.2%) | 0 (0.0%) |
| No Fuel Used | 0 (0.0%) | 0 (0.0%) |
| Total | 48 (100.0%) | 1 (100.0%) |
Household Vehicle Usage in Park
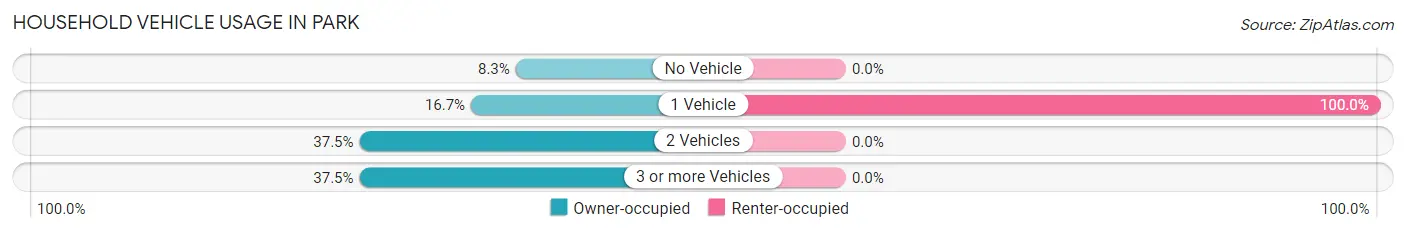
| Vehicles per Household | Owner-occupied | Renter-occupied |
| No Vehicle | 4 (8.3%) | 0 (0.0%) |
| 1 Vehicle | 8 (16.7%) | 1 (100.0%) |
| 2 Vehicles | 18 (37.5%) | 0 (0.0%) |
| 3 or more Vehicles | 18 (37.5%) | 0 (0.0%) |
| Total | 48 (100.0%) | 1 (100.0%) |
Real Estate & Mortgages in Park
Real Estate and Mortgage Overview in Park
| Characteristic | Without Mortgage | With Mortgage |
| Housing Units | 25 | 23 |
| Median Property Value | $66,300 | $65,000 |
| Median Household Income | $34,063 | $3 |
| Monthly Housing Costs | $338 | $0 |
| Real Estate Taxes | $633 | $0 |
Property Value by Mortgage Status in Park
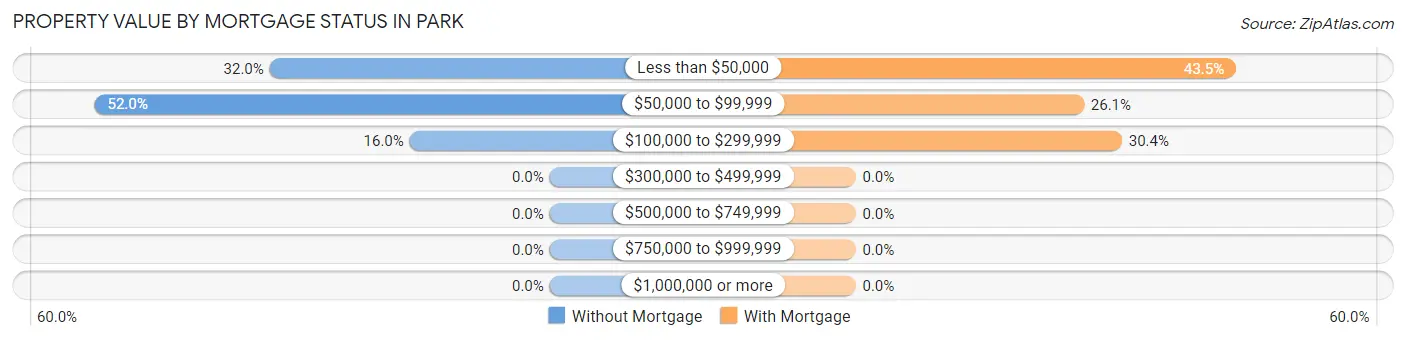
| Property Value | Without Mortgage | With Mortgage |
| Less than $50,000 | 8 (32.0%) | 10 (43.5%) |
| $50,000 to $99,999 | 13 (52.0%) | 6 (26.1%) |
| $100,000 to $299,999 | 4 (16.0%) | 7 (30.4%) |
| $300,000 to $499,999 | 0 (0.0%) | 0 (0.0%) |
| $500,000 to $749,999 | 0 (0.0%) | 0 (0.0%) |
| $750,000 to $999,999 | 0 (0.0%) | 0 (0.0%) |
| $1,000,000 or more | 0 (0.0%) | 0 (0.0%) |
| Total | 25 (100.0%) | 23 (100.0%) |
Household Income by Mortgage Status in Park
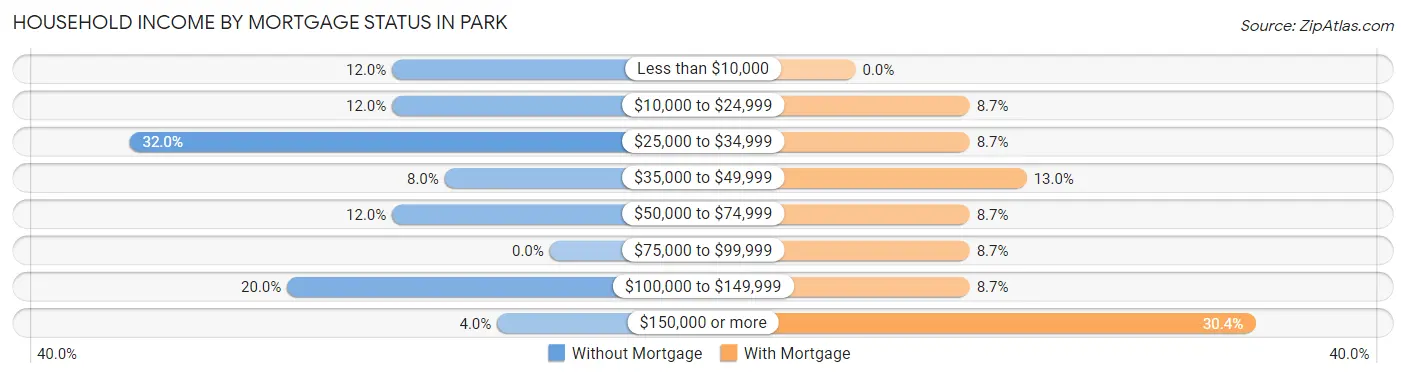
| Household Income | Without Mortgage | With Mortgage |
| Less than $10,000 | 3 (12.0%) | 0 (0.0%) |
| $10,000 to $24,999 | 3 (12.0%) | 2 (8.7%) |
| $25,000 to $34,999 | 8 (32.0%) | 2 (8.7%) |
| $35,000 to $49,999 | 2 (8.0%) | 3 (13.0%) |
| $50,000 to $74,999 | 3 (12.0%) | 2 (8.7%) |
| $75,000 to $99,999 | 0 (0.0%) | 2 (8.7%) |
| $100,000 to $149,999 | 5 (20.0%) | 2 (8.7%) |
| $150,000 or more | 1 (4.0%) | 7 (30.4%) |
| Total | 25 (100.0%) | 23 (100.0%) |
Property Value to Household Income Ratio in Park
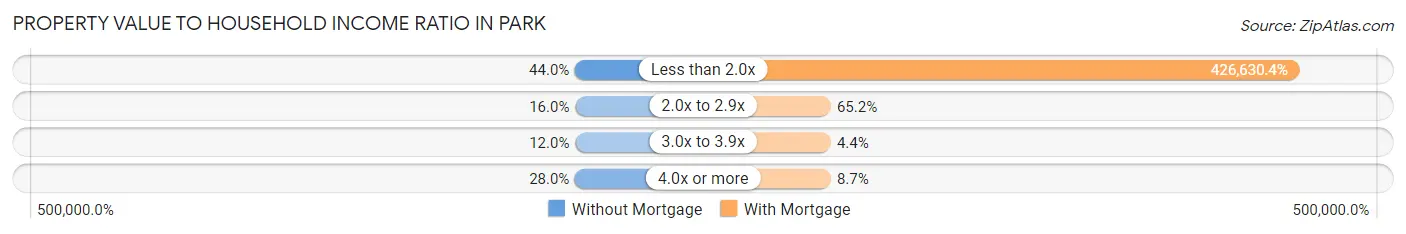
| Value-to-Income Ratio | Without Mortgage | With Mortgage |
| Less than 2.0x | 11 (44.0%) | 98,125 (426,630.4%) |
| 2.0x to 2.9x | 4 (16.0%) | 15 (65.2%) |
| 3.0x to 3.9x | 3 (12.0%) | 1 (4.3%) |
| 4.0x or more | 7 (28.0%) | 2 (8.7%) |
| Total | 25 (100.0%) | 23 (100.0%) |
Real Estate Taxes by Mortgage Status in Park
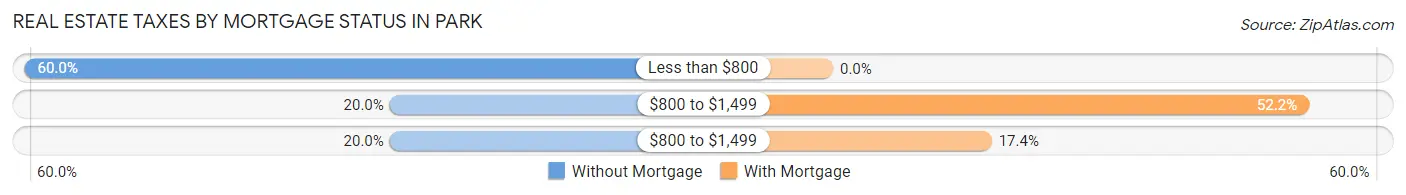
| Property Taxes | Without Mortgage | With Mortgage |
| Less than $800 | 15 (60.0%) | 0 (0.0%) |
| $800 to $1,499 | 5 (20.0%) | 12 (52.2%) |
| $800 to $1,499 | 5 (20.0%) | 4 (17.4%) |
| Total | 25 (100.0%) | 23 (100.0%) |
Health & Disability in Park
Health Insurance Coverage by Age in Park
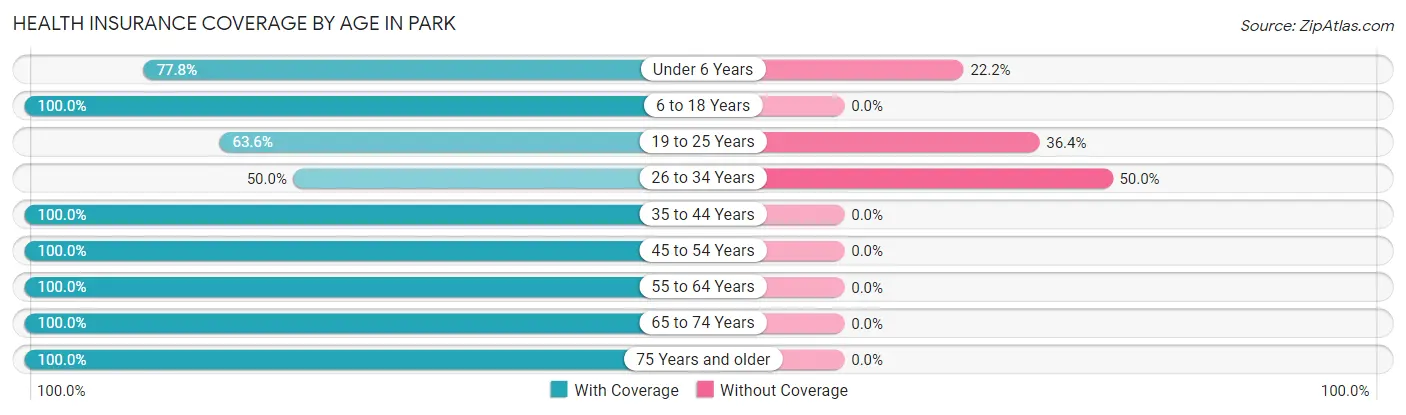
| Age Bracket | With Coverage | Without Coverage |
| Under 6 Years | 7 (77.8%) | 2 (22.2%) |
| 6 to 18 Years | 2 (100.0%) | 0 (0.0%) |
| 19 to 25 Years | 7 (63.6%) | 4 (36.4%) |
| 26 to 34 Years | 3 (50.0%) | 3 (50.0%) |
| 35 to 44 Years | 2 (100.0%) | 0 (0.0%) |
| 45 to 54 Years | 23 (100.0%) | 0 (0.0%) |
| 55 to 64 Years | 19 (100.0%) | 0 (0.0%) |
| 65 to 74 Years | 10 (100.0%) | 0 (0.0%) |
| 75 Years and older | 12 (100.0%) | 0 (0.0%) |
| Total | 85 (90.4%) | 9 (9.6%) |
Health Insurance Coverage by Citizenship Status in Park
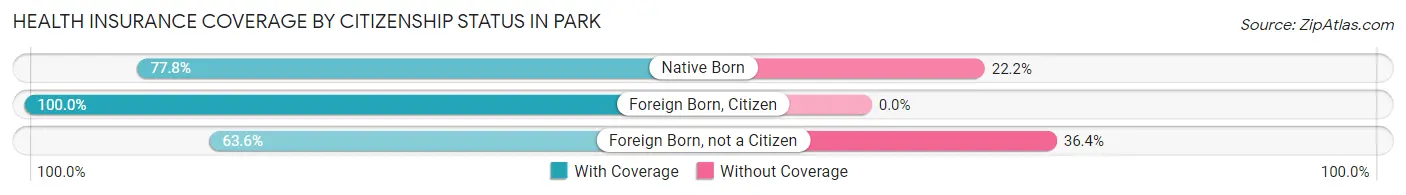
| Citizenship Status | With Coverage | Without Coverage |
| Native Born | 7 (77.8%) | 2 (22.2%) |
| Foreign Born, Citizen | 2 (100.0%) | 0 (0.0%) |
| Foreign Born, not a Citizen | 7 (63.6%) | 4 (36.4%) |
Health Insurance Coverage by Household Income in Park
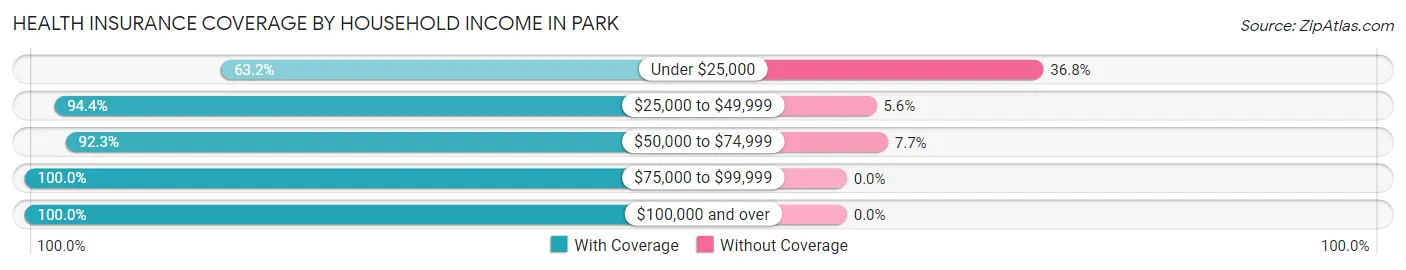
| Household Income | With Coverage | Without Coverage |
| Under $25,000 | 12 (63.2%) | 7 (36.8%) |
| $25,000 to $49,999 | 17 (94.4%) | 1 (5.6%) |
| $50,000 to $74,999 | 12 (92.3%) | 1 (7.7%) |
| $75,000 to $99,999 | 7 (100.0%) | 0 (0.0%) |
| $100,000 and over | 36 (100.0%) | 0 (0.0%) |
Public vs Private Health Insurance Coverage by Age in Park
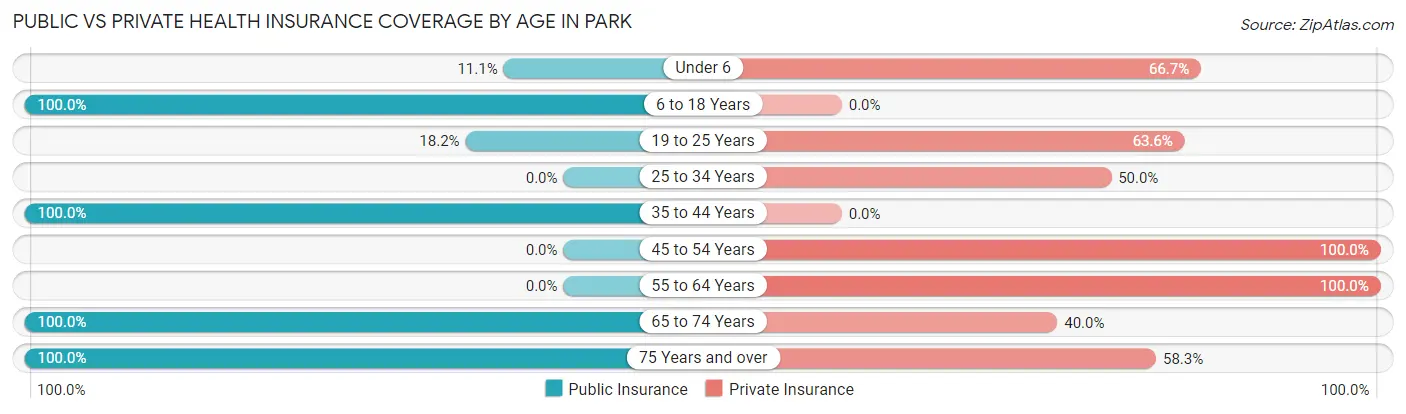
| Age Bracket | Public Insurance | Private Insurance |
| Under 6 | 1 (11.1%) | 6 (66.7%) |
| 6 to 18 Years | 2 (100.0%) | 0 (0.0%) |
| 19 to 25 Years | 2 (18.2%) | 7 (63.6%) |
| 25 to 34 Years | 0 (0.0%) | 3 (50.0%) |
| 35 to 44 Years | 2 (100.0%) | 0 (0.0%) |
| 45 to 54 Years | 0 (0.0%) | 23 (100.0%) |
| 55 to 64 Years | 0 (0.0%) | 19 (100.0%) |
| 65 to 74 Years | 10 (100.0%) | 4 (40.0%) |
| 75 Years and over | 12 (100.0%) | 7 (58.3%) |
| Total | 29 (30.8%) | 69 (73.4%) |
Disability Status by Sex by Age in Park
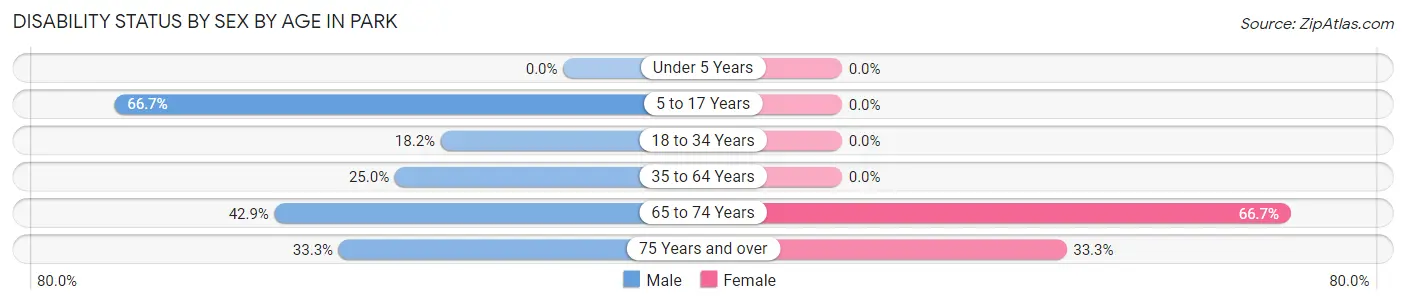
| Age Bracket | Male | Female |
| Under 5 Years | 0 (0.0%) | 0 (0.0%) |
| 5 to 17 Years | 2 (66.7%) | 0 (0.0%) |
| 18 to 34 Years | 2 (18.2%) | 0 (0.0%) |
| 35 to 64 Years | 6 (25.0%) | 0 (0.0%) |
| 65 to 74 Years | 3 (42.9%) | 2 (66.7%) |
| 75 Years and over | 1 (33.3%) | 3 (33.3%) |
Disability Class by Sex by Age in Park
Disability Class: Hearing Difficulty
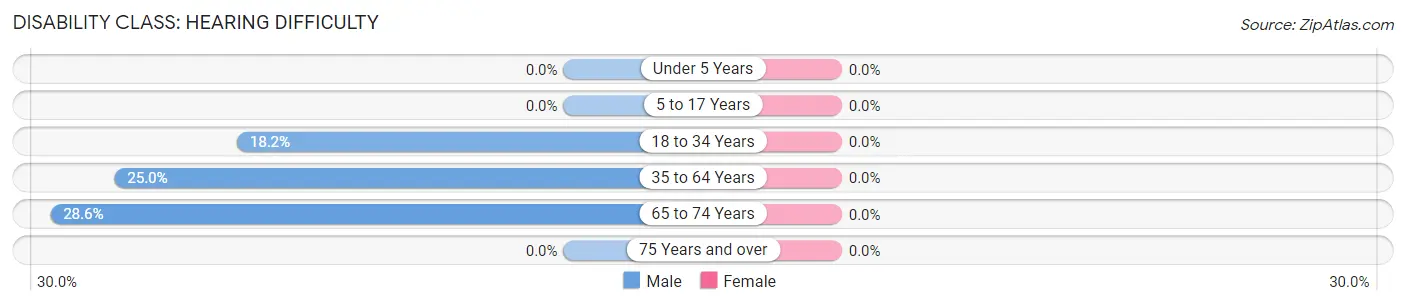
| Age Bracket | Male | Female |
| Under 5 Years | 0 (0.0%) | 0 (0.0%) |
| 5 to 17 Years | 0 (0.0%) | 0 (0.0%) |
| 18 to 34 Years | 2 (18.2%) | 0 (0.0%) |
| 35 to 64 Years | 6 (25.0%) | 0 (0.0%) |
| 65 to 74 Years | 2 (28.6%) | 0 (0.0%) |
| 75 Years and over | 0 (0.0%) | 0 (0.0%) |
Disability Class: Vision Difficulty
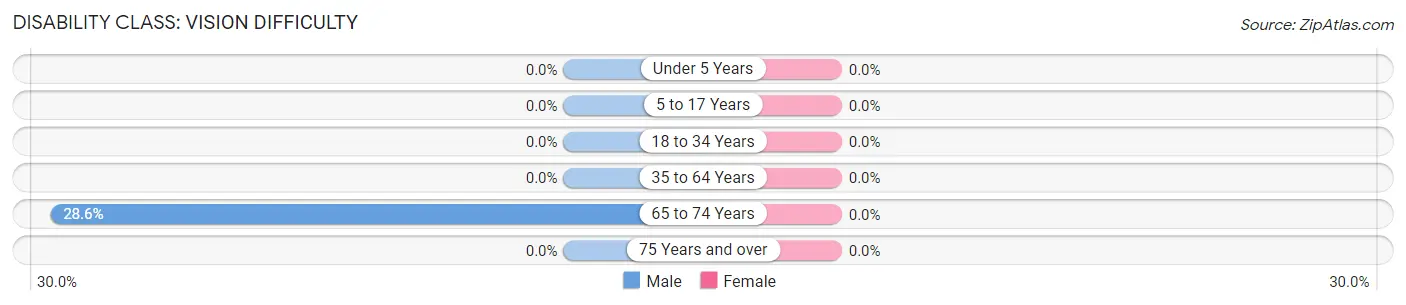
| Age Bracket | Male | Female |
| Under 5 Years | 0 (0.0%) | 0 (0.0%) |
| 5 to 17 Years | 0 (0.0%) | 0 (0.0%) |
| 18 to 34 Years | 0 (0.0%) | 0 (0.0%) |
| 35 to 64 Years | 0 (0.0%) | 0 (0.0%) |
| 65 to 74 Years | 2 (28.6%) | 0 (0.0%) |
| 75 Years and over | 0 (0.0%) | 0 (0.0%) |
Disability Class: Cognitive Difficulty
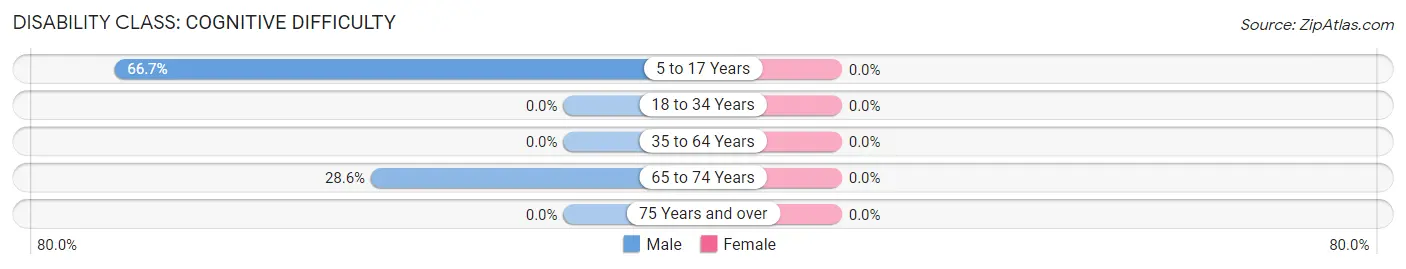
| Age Bracket | Male | Female |
| 5 to 17 Years | 2 (66.7%) | 0 (0.0%) |
| 18 to 34 Years | 0 (0.0%) | 0 (0.0%) |
| 35 to 64 Years | 0 (0.0%) | 0 (0.0%) |
| 65 to 74 Years | 2 (28.6%) | 0 (0.0%) |
| 75 Years and over | 0 (0.0%) | 0 (0.0%) |
Disability Class: Ambulatory Difficulty
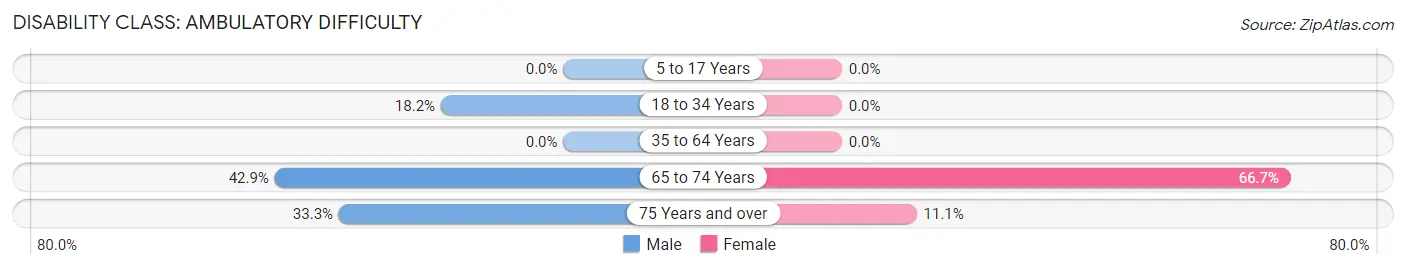
| Age Bracket | Male | Female |
| 5 to 17 Years | 0 (0.0%) | 0 (0.0%) |
| 18 to 34 Years | 2 (18.2%) | 0 (0.0%) |
| 35 to 64 Years | 0 (0.0%) | 0 (0.0%) |
| 65 to 74 Years | 3 (42.9%) | 2 (66.7%) |
| 75 Years and over | 1 (33.3%) | 1 (11.1%) |
Disability Class: Self-Care Difficulty
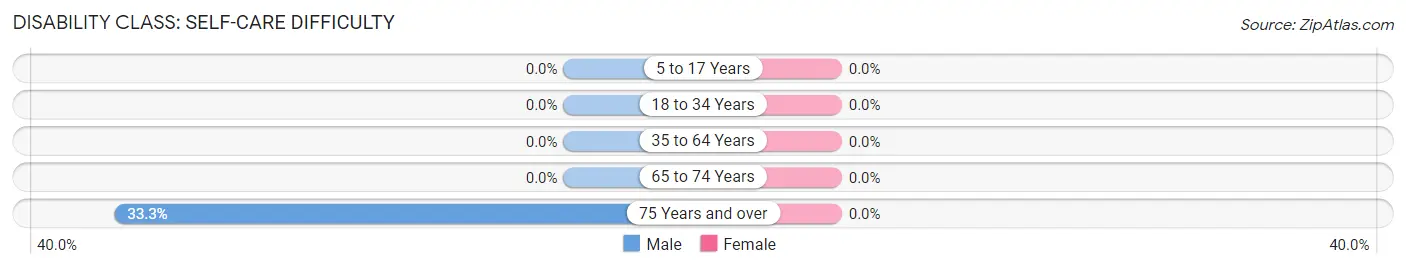
| Age Bracket | Male | Female |
| 5 to 17 Years | 0 (0.0%) | 0 (0.0%) |
| 18 to 34 Years | 0 (0.0%) | 0 (0.0%) |
| 35 to 64 Years | 0 (0.0%) | 0 (0.0%) |
| 65 to 74 Years | 0 (0.0%) | 0 (0.0%) |
| 75 Years and over | 1 (33.3%) | 0 (0.0%) |
Technology Access in Park
Computing Device Access in Park
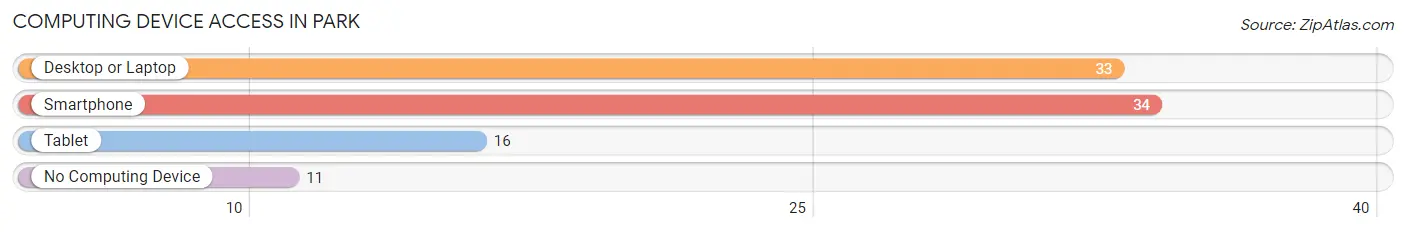
| Device Type | # Households | % Households |
| Desktop or Laptop | 33 | 67.3% |
| Smartphone | 34 | 69.4% |
| Tablet | 16 | 32.7% |
| No Computing Device | 11 | 22.5% |
| Total | 49 | 100.0% |
Internet Access in Park
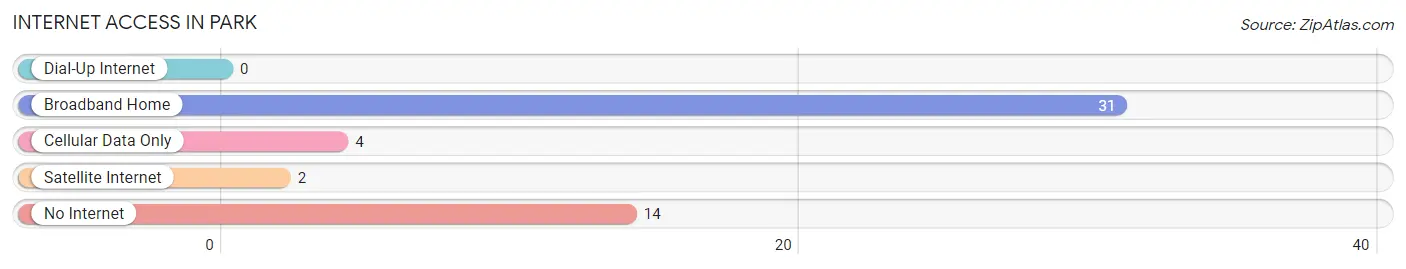
| Internet Type | # Households | % Households |
| Dial-Up Internet | 0 | 0.0% |
| Broadband Home | 31 | 63.3% |
| Cellular Data Only | 4 | 8.2% |
| Satellite Internet | 2 | 4.1% |
| No Internet | 14 | 28.6% |
| Total | 49 | 100.0% |
Park Summary
Park, Kansas is a small city located in the northeastern corner of the state. It is situated in the Flint Hills region of Kansas, and is part of the Manhattan metropolitan area. The city has a population of approximately 1,400 people, and is the county seat of Riley County.
Geography
Park, Kansas is located in the Flint Hills region of Kansas, and is situated in the northeastern corner of the state. The city is located at the intersection of U.S. Route 24 and Kansas Highway 18. The city is situated on the banks of the Big Blue River, and is surrounded by rolling hills and grasslands. The city has a total area of 1.2 square miles, all of which is land.
Climate
Park, Kansas has a humid continental climate, with hot summers and cold winters. The average annual temperature is 54 degrees Fahrenheit, and the average annual precipitation is 33 inches. The city experiences all four seasons, with the warmest months being June, July, and August, and the coldest months being December, January, and February.
Demographics
As of the 2010 census, Park, Kansas had a population of 1,400 people. The racial makeup of the city was 95.6% White, 0.6% African American, 0.4% Native American, 0.4% Asian, 0.1% Pacific Islander, 0.9% from other races, and 1.9% from two or more races. Hispanic or Latino of any race were 2.9% of the population.
Economy
Park, Kansas is a small city with a limited economy. The city is home to several small businesses, including a grocery store, a hardware store, and a few restaurants. The city is also home to a few manufacturing companies, including a plastics manufacturer and a metal fabrication company. The city is also home to a few agricultural businesses, including a dairy farm and a cattle ranch.
History
Park, Kansas was founded in 1855 by a group of settlers from Ohio. The city was originally named Parkville, and was the county seat of Riley County. The city was incorporated in 1872, and the name was changed to Park. The city was a major stop on the Santa Fe Trail, and was a popular destination for travelers and traders. The city was also home to a number of businesses, including a hotel, a bank, and a newspaper.
In the late 19th century, Park, Kansas was a major center for the cattle industry. The city was home to several large ranches, and was a major shipping point for cattle. The city was also home to a number of businesses, including a flour mill, a creamery, and a brickyard.
In the early 20th century, Park, Kansas was a major center for the oil industry. The city was home to several oil refineries, and was a major shipping point for oil. The city was also home to a number of businesses, including a foundry, a machine shop, and a lumber yard.
Today, Park, Kansas is a small city with a limited economy. The city is home to several small businesses, and is a popular destination for tourists and outdoor enthusiasts. The city is also home to a few manufacturing companies, and is a major center for the agricultural industry.
Common Questions
What is Per Capita Income in Park?
Per Capita income in Park is $43,852.
What is the Median Family Income in Park?
Median Family Income in Park is $117,857.
What is Income or Wage Gap in Park?
Income or Wage Gap in Park is 47.4%.
Women in Park earn 52.6 cents for every dollar earned by a man.
What is Family Income Deficit in Park?
Family Income Deficit in Park is $8,325.
Families that are below poverty line in Park earn $8,325 less on average than the poverty threshold level.
What is Inequality or Gini Index in Park?
Inequality or Gini Index in Park is 0.46.
What is the Total Population of Park?
Total Population of Park is 94.
What is the Total Male Population of Park?
Total Male Population of Park is 52.
What is the Total Female Population of Park?
Total Female Population of Park is 42.
What is the Ratio of Males per 100 Females in Park?
There are 123.81 Males per 100 Females in Park.
What is the Ratio of Females per 100 Males in Park?
There are 80.77 Females per 100 Males in Park.
What is the Median Population Age in Park?
Median Population Age in Park is 52.0 Years.
What is the Average Family Size in Park
Average Family Size in Park is 2.7 People.
What is the Average Household Size in Park
Average Household Size in Park is 1.9 People.
How Large is the Labor Force in Park?
There are 65 People in the Labor Forcein in Park.
What is the Percentage of People in the Labor Force in Park?
78.3% of People are in the Labor Force in Park.