Columbus, KS Map & Demographics
Columbus Map
Columbus Overview
$24,807
PER CAPITA INCOME
$53,938
AVG FAMILY INCOME
$39,777
AVG HOUSEHOLD INCOME
1.8%
WAGE / INCOME GAP [ % ]
98.2¢/ $1
WAGE / INCOME GAP [ $ ]
$7,982
FAMILY INCOME DEFICIT
0.46
INEQUALITY / GINI INDEX
2,922
TOTAL POPULATION
1,273
MALE POPULATION
1,649
FEMALE POPULATION
77.20
MALES / 100 FEMALES
129.54
FEMALES / 100 MALES
40.9
MEDIAN AGE
3.0
AVG FAMILY SIZE
2.2
AVG HOUSEHOLD SIZE
1,189
LABOR FORCE [ PEOPLE ]
48.6%
PERCENT IN LABOR FORCE
1.4%
UNEMPLOYMENT RATE
Columbus Zip Codes
Columbus Area Codes
Income in Columbus
Income Overview in Columbus
Per Capita Income in Columbus is $24,807, while median incomes of families and households are $53,938 and $39,777 respectively.
| Characteristic | Number | Measure |
| Per Capita Income | 2,922 | $24,807 |
| Median Family Income | 677 | $53,938 |
| Mean Family Income | 677 | $68,732 |
| Median Household Income | 1,279 | $39,777 |
| Mean Household Income | 1,279 | $53,338 |
| Income Deficit | 677 | $7,982 |
| Wage / Income Gap (%) | 2,922 | 1.78% |
| Wage / Income Gap ($) | 2,922 | 98.22¢ per $1 |
| Gini / Inequality Index | 2,922 | 0.46 |
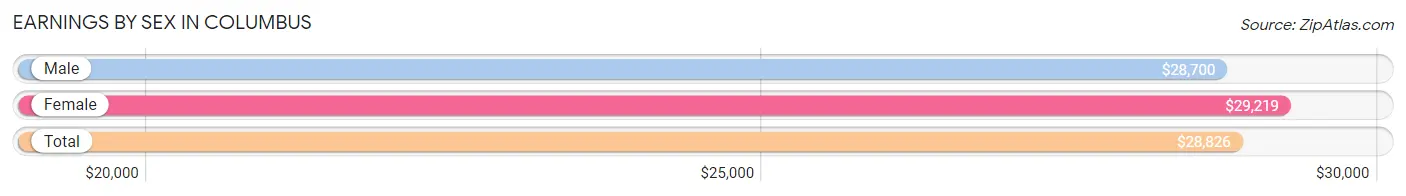
Earnings by Sex in Columbus
Average Earnings in Columbus are $28,826, $28,700 for men and $29,219 for women, a difference of 1.8%.
| Sex | Number | Average Earnings |
| Male | 700 (52.7%) | $28,700 |
| Female | 627 (47.2%) | $29,219 |
| Total | 1,327 (100.0%) | $28,826 |
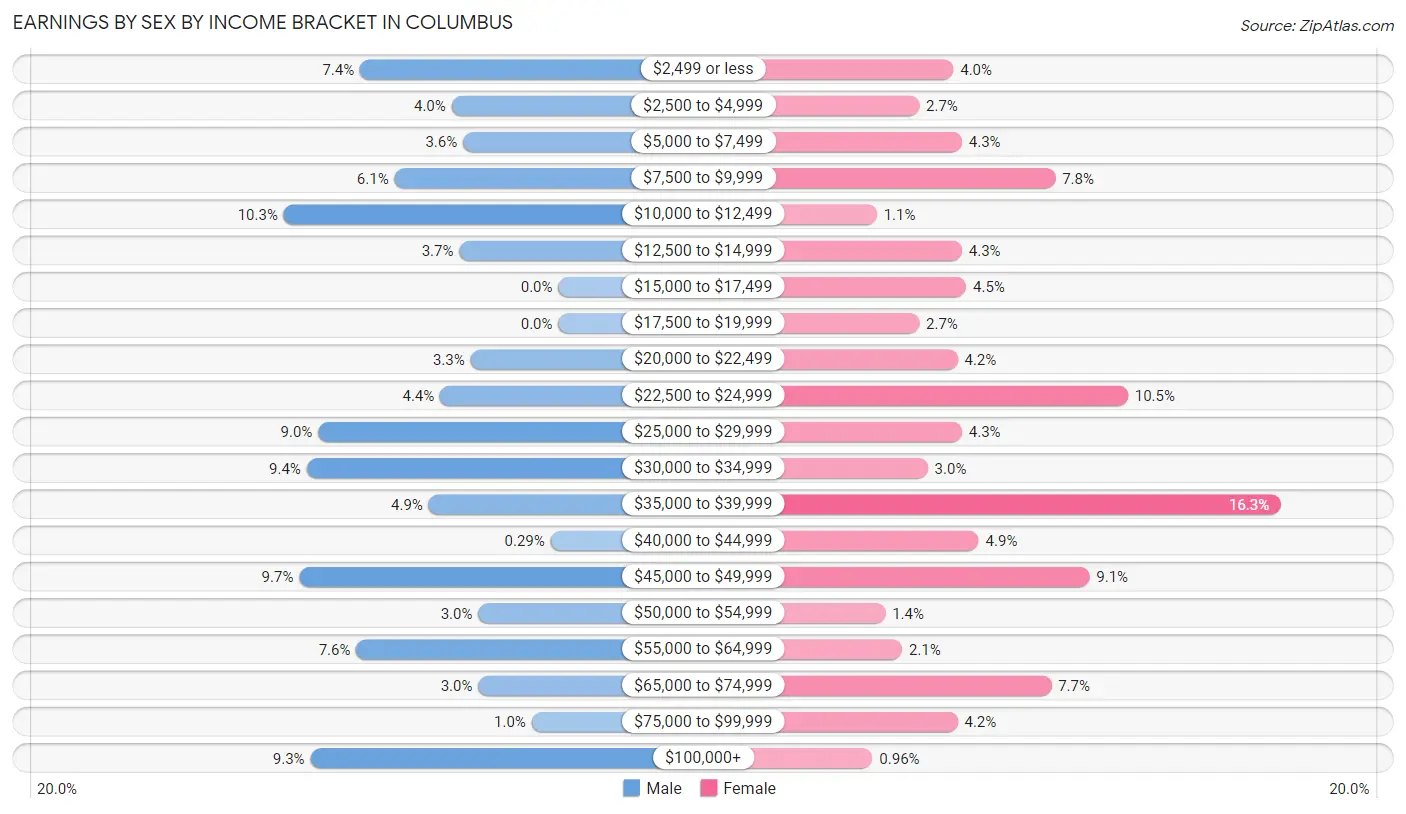
Earnings by Sex by Income Bracket in Columbus
The most common earnings brackets in Columbus are $10,000 to $12,499 for men (72 | 10.3%) and $35,000 to $39,999 for women (102 | 16.3%).
| Income | Male | Female |
| $2,499 or less | 52 (7.4%) | 25 (4.0%) |
| $2,500 to $4,999 | 28 (4.0%) | 17 (2.7%) |
| $5,000 to $7,499 | 25 (3.6%) | 27 (4.3%) |
| $7,500 to $9,999 | 43 (6.1%) | 49 (7.8%) |
| $10,000 to $12,499 | 72 (10.3%) | 7 (1.1%) |
| $12,500 to $14,999 | 26 (3.7%) | 27 (4.3%) |
| $15,000 to $17,499 | 0 (0.0%) | 28 (4.5%) |
| $17,500 to $19,999 | 0 (0.0%) | 17 (2.7%) |
| $20,000 to $22,499 | 23 (3.3%) | 26 (4.2%) |
| $22,500 to $24,999 | 31 (4.4%) | 66 (10.5%) |
| $25,000 to $29,999 | 63 (9.0%) | 27 (4.3%) |
| $30,000 to $34,999 | 66 (9.4%) | 19 (3.0%) |
| $35,000 to $39,999 | 34 (4.9%) | 102 (16.3%) |
| $40,000 to $44,999 | 2 (0.3%) | 31 (4.9%) |
| $45,000 to $49,999 | 68 (9.7%) | 57 (9.1%) |
| $50,000 to $54,999 | 21 (3.0%) | 9 (1.4%) |
| $55,000 to $64,999 | 53 (7.6%) | 13 (2.1%) |
| $65,000 to $74,999 | 21 (3.0%) | 48 (7.7%) |
| $75,000 to $99,999 | 7 (1.0%) | 26 (4.2%) |
| $100,000+ | 65 (9.3%) | 6 (1.0%) |
| Total | 700 (100.0%) | 627 (100.0%) |
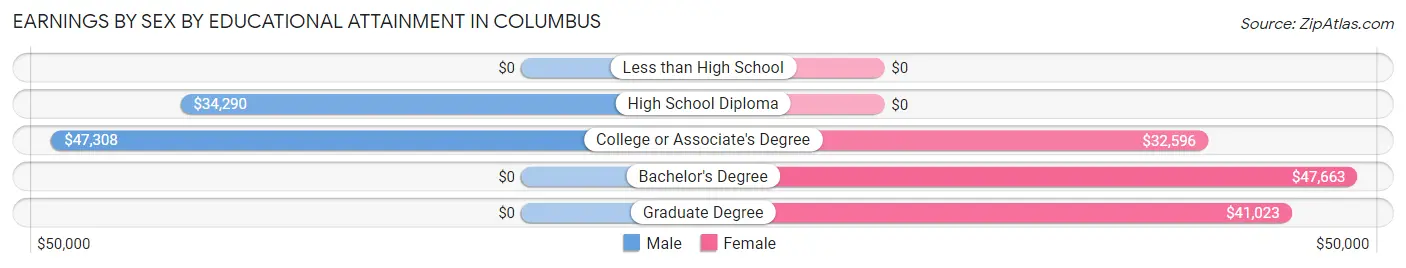
Earnings by Sex by Educational Attainment in Columbus
Average earnings in Columbus are $33,011 for men and $35,550 for women, a difference of 7.1%. Men with an educational attainment of college or associate's degree enjoy the highest average annual earnings of $47,308, while those with high school diploma education earn the least with $34,290. Women with an educational attainment of bachelor's degree earn the most with the average annual earnings of $47,663, while those with college or associate's degree education have the smallest earnings of $32,596.
| Educational Attainment | Male Income | Female Income |
| Less than High School | - | - |
| High School Diploma | $34,290 | $0 |
| College or Associate's Degree | $47,308 | $32,596 |
| Bachelor's Degree | - | - |
| Graduate Degree | - | - |
| Total | $33,011 | $35,550 |
Family Income in Columbus
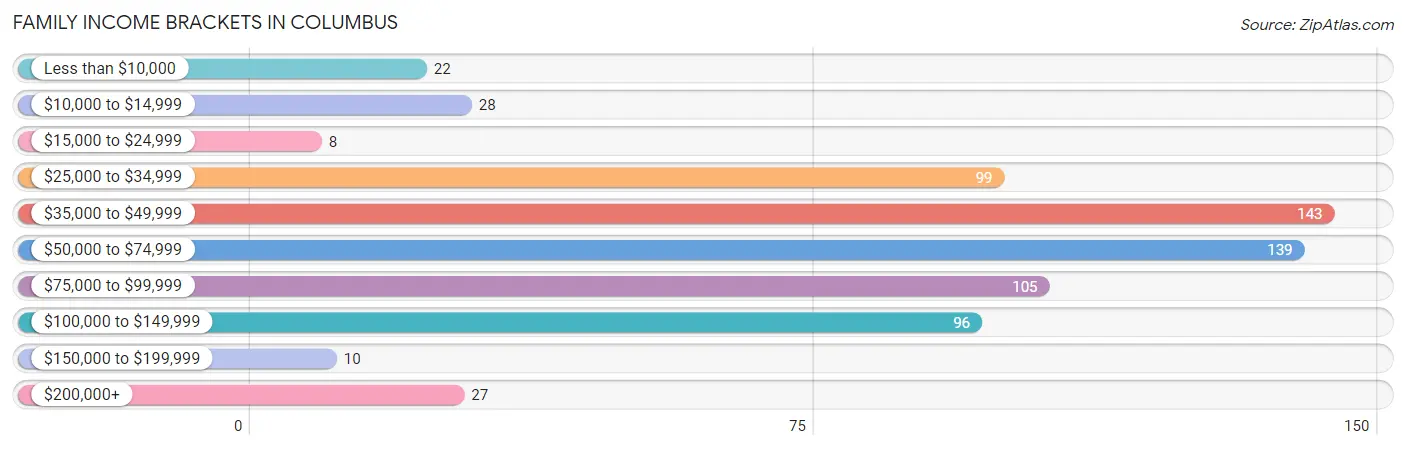
Family Income Brackets in Columbus
According to the Columbus family income data, there are 143 families falling into the $35,000 to $49,999 income range, which is the most common income bracket and makes up 21.1% of all families. Conversely, the $15,000 to $24,999 income bracket is the least frequent group with only 8 families (1.2%) belonging to this category.
| Income Bracket | # Families | % Families |
| Less than $10,000 | 22 | 3.2% |
| $10,000 to $14,999 | 28 | 4.1% |
| $15,000 to $24,999 | 8 | 1.2% |
| $25,000 to $34,999 | 99 | 14.6% |
| $35,000 to $49,999 | 143 | 21.1% |
| $50,000 to $74,999 | 139 | 20.5% |
| $75,000 to $99,999 | 105 | 15.5% |
| $100,000 to $149,999 | 96 | 14.2% |
| $150,000 to $199,999 | 10 | 1.5% |
| $200,000+ | 27 | 4.0% |
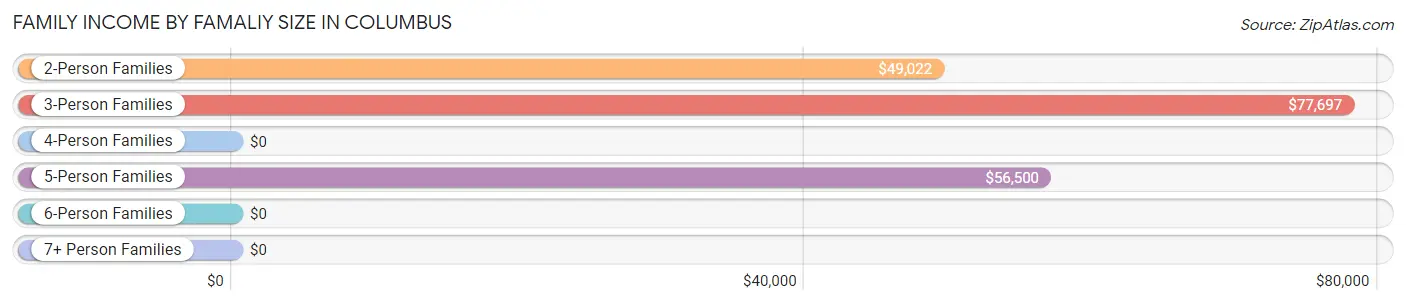
Family Income by Famaliy Size in Columbus
3-person families (112 | 16.5%) account for the highest median family income in Columbus with $77,697 per family, while 3-person families (112 | 16.5%) have the highest median income of $25,899 per family member.
| Income Bracket | # Families | Median Income |
| 2-Person Families | 428 (63.2%) | $49,022 |
| 3-Person Families | 112 (16.5%) | $77,697 |
| 4-Person Families | 86 (12.7%) | $0 |
| 5-Person Families | 32 (4.7%) | $56,500 |
| 6-Person Families | 0 (0.0%) | $0 |
| 7+ Person Families | 19 (2.8%) | $0 |
| Total | 677 (100.0%) | $53,938 |
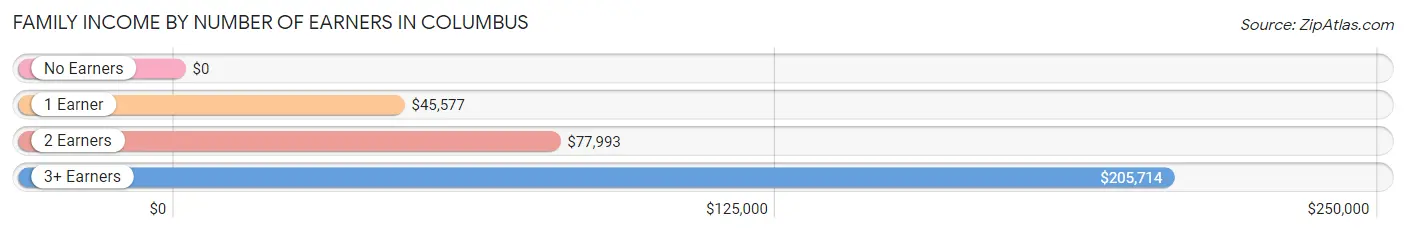
Family Income by Number of Earners in Columbus
| Number of Earners | # Families | Median Income |
| No Earners | 128 (18.9%) | $0 |
| 1 Earner | 252 (37.2%) | $45,577 |
| 2 Earners | 265 (39.1%) | $77,993 |
| 3+ Earners | 32 (4.7%) | $205,714 |
| Total | 677 (100.0%) | $53,938 |
Household Income in Columbus
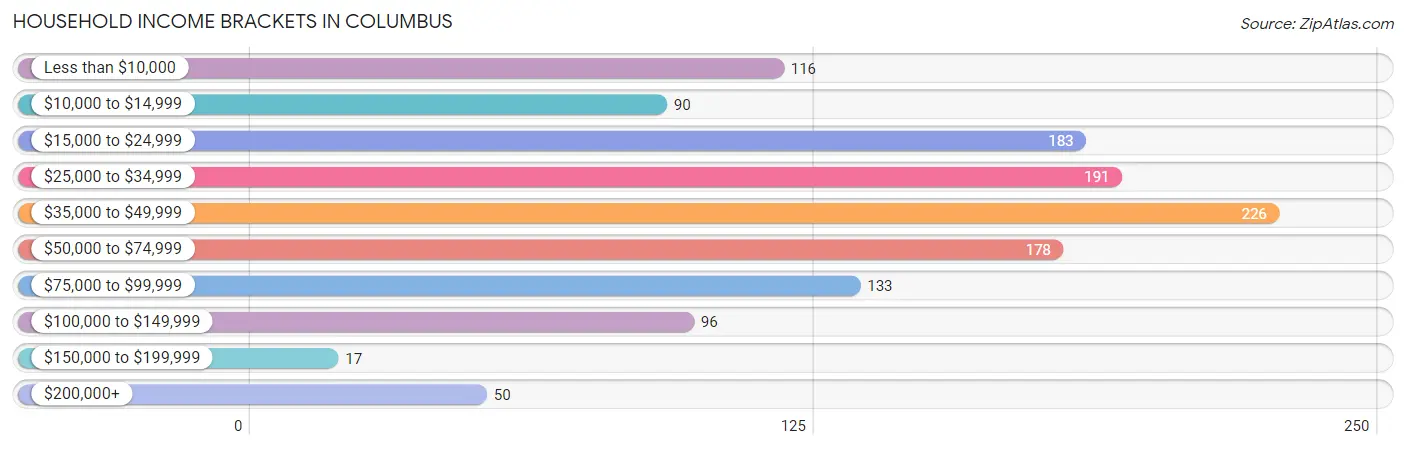
Household Income Brackets in Columbus
With 226 households falling in the category, the $35,000 to $49,999 income range is the most frequent in Columbus, accounting for 17.7% of all households. In contrast, only 17 households (1.3%) fall into the $150,000 to $199,999 income bracket, making it the least populous group.
| Income Bracket | # Households | % Households |
| Less than $10,000 | 116 | 9.1% |
| $10,000 to $14,999 | 90 | 7.0% |
| $15,000 to $24,999 | 183 | 14.3% |
| $25,000 to $34,999 | 191 | 14.9% |
| $35,000 to $49,999 | 226 | 17.7% |
| $50,000 to $74,999 | 178 | 13.9% |
| $75,000 to $99,999 | 133 | 10.4% |
| $100,000 to $149,999 | 96 | 7.5% |
| $150,000 to $199,999 | 17 | 1.3% |
| $200,000+ | 50 | 3.9% |
Household Income by Householder Age in Columbus
The median household income in Columbus is $39,777, with the highest median household income of $41,659 found in the 25 to 44 years age bracket for the primary householder. A total of 423 households (33.1%) fall into this category. Meanwhile, the 15 to 24 years age bracket for the primary householder has the lowest median household income of $29,315, with 55 households (4.3%) in this group.
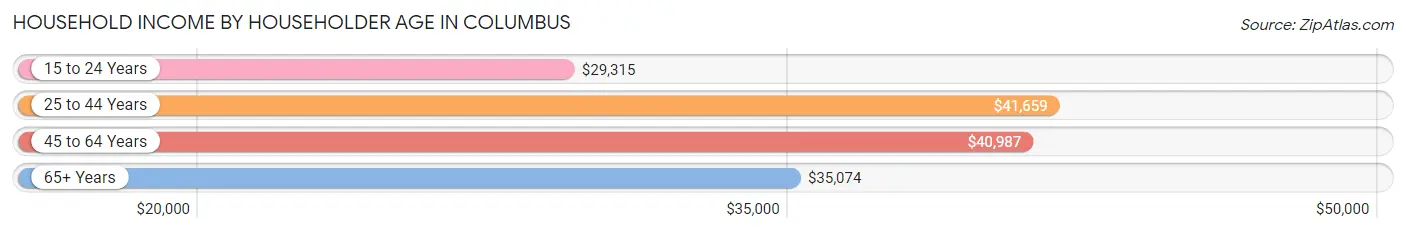
| Income Bracket | # Households | Median Income |
| 15 to 24 Years | 55 (4.3%) | $29,315 |
| 25 to 44 Years | 423 (33.1%) | $41,659 |
| 45 to 64 Years | 467 (36.5%) | $40,987 |
| 65+ Years | 334 (26.1%) | $35,074 |
| Total | 1,279 (100.0%) | $39,777 |
Poverty in Columbus
Income Below Poverty by Sex and Age in Columbus
With 17.8% poverty level for males and 16.6% for females among the residents of Columbus, 25 to 34 year old males and 25 to 34 year old females are the most vulnerable to poverty, with 83 males (34.4%) and 74 females (29.5%) in their respective age groups living below the poverty level.
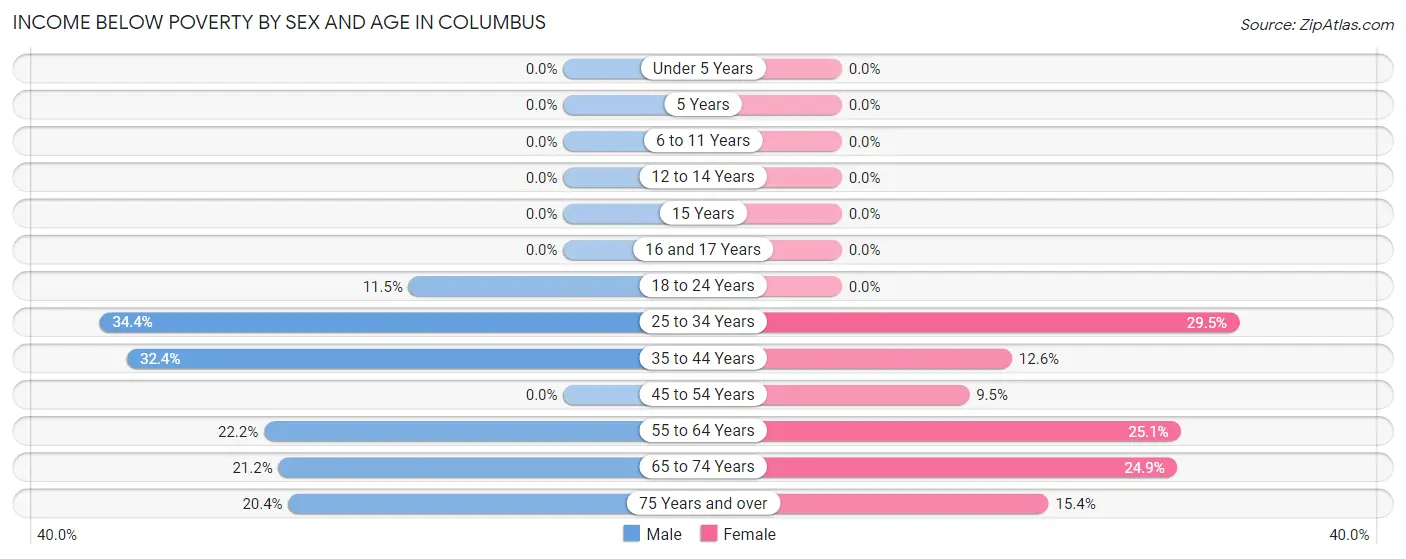
| Age Bracket | Male | Female |
| Under 5 Years | 0 (0.0%) | 0 (0.0%) |
| 5 Years | 0 (0.0%) | 0 (0.0%) |
| 6 to 11 Years | 0 (0.0%) | 0 (0.0%) |
| 12 to 14 Years | 0 (0.0%) | 0 (0.0%) |
| 15 Years | 0 (0.0%) | 0 (0.0%) |
| 16 and 17 Years | 0 (0.0%) | 0 (0.0%) |
| 18 to 24 Years | 21 (11.5%) | 0 (0.0%) |
| 25 to 34 Years | 83 (34.4%) | 74 (29.5%) |
| 35 to 44 Years | 46 (32.4%) | 25 (12.6%) |
| 45 to 54 Years | 0 (0.0%) | 7 (9.5%) |
| 55 to 64 Years | 30 (22.2%) | 89 (25.1%) |
| 65 to 74 Years | 22 (21.1%) | 42 (24.8%) |
| 75 Years and over | 20 (20.4%) | 31 (15.3%) |
| Total | 222 (17.8%) | 268 (16.6%) |
Income Above Poverty by Sex and Age in Columbus
According to the poverty statistics in Columbus, males aged under 5 years and females aged under 5 years are the age groups that are most secure financially, with 100.0% of males and 100.0% of females in these age groups living above the poverty line.
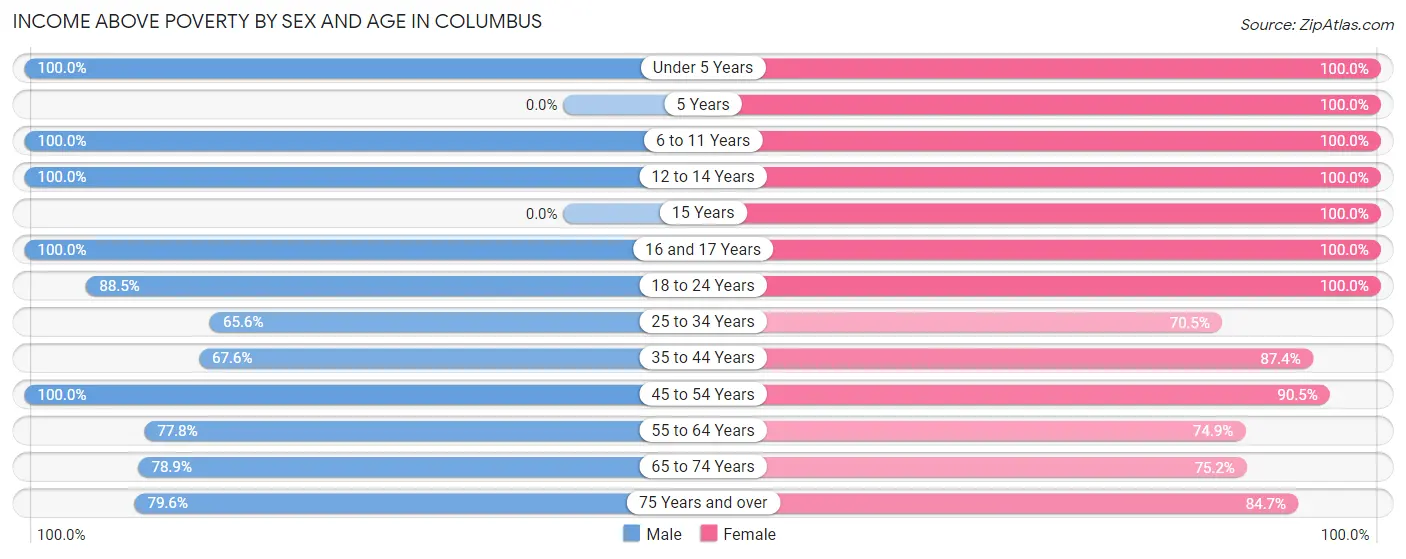
| Age Bracket | Male | Female |
| Under 5 Years | 48 (100.0%) | 129 (100.0%) |
| 5 Years | 0 (0.0%) | 28 (100.0%) |
| 6 to 11 Years | 92 (100.0%) | 61 (100.0%) |
| 12 to 14 Years | 41 (100.0%) | 32 (100.0%) |
| 15 Years | 0 (0.0%) | 44 (100.0%) |
| 16 and 17 Years | 40 (100.0%) | 18 (100.0%) |
| 18 to 24 Years | 162 (88.5%) | 58 (100.0%) |
| 25 to 34 Years | 158 (65.6%) | 177 (70.5%) |
| 35 to 44 Years | 96 (67.6%) | 173 (87.4%) |
| 45 to 54 Years | 123 (100.0%) | 67 (90.5%) |
| 55 to 64 Years | 105 (77.8%) | 265 (74.9%) |
| 65 to 74 Years | 82 (78.8%) | 127 (75.1%) |
| 75 Years and over | 78 (79.6%) | 171 (84.7%) |
| Total | 1,025 (82.2%) | 1,350 (83.4%) |
Income Below Poverty Among Married-Couple Families in Columbus
The poverty statistics for married-couple families in Columbus show that 10.2% or 50 of the total 488 families live below the poverty line. Families with no children have the highest poverty rate of 12.7%, comprising of 50 families. On the other hand, families with 1 or 2 children have the lowest poverty rate of 0.0%, which includes 0 families.
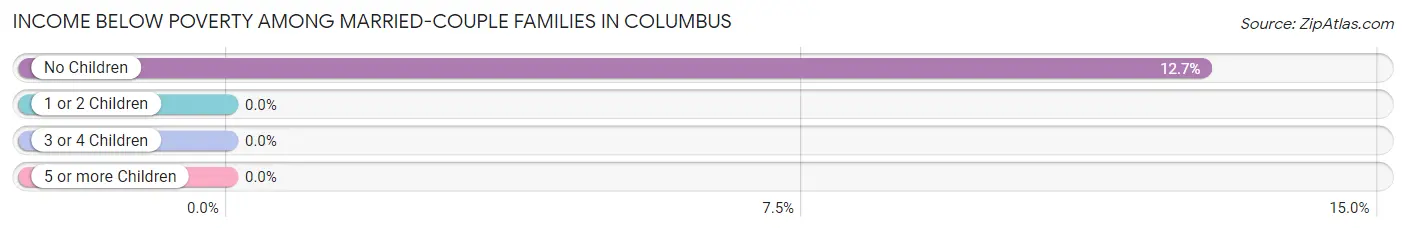
| Children | Above Poverty | Below Poverty |
| No Children | 343 (87.3%) | 50 (12.7%) |
| 1 or 2 Children | 67 (100.0%) | 0 (0.0%) |
| 3 or 4 Children | 28 (100.0%) | 0 (0.0%) |
| 5 or more Children | 0 (0.0%) | 0 (0.0%) |
| Total | 438 (89.7%) | 50 (10.2%) |
Income Below Poverty Among Single-Parent Households in Columbus
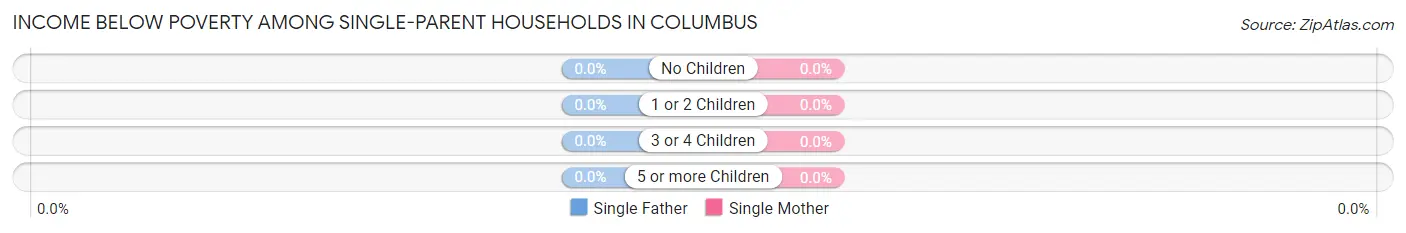
| Children | Single Father | Single Mother |
| No Children | 0 (0.0%) | 0 (0.0%) |
| 1 or 2 Children | 0 (0.0%) | 0 (0.0%) |
| 3 or 4 Children | 0 (0.0%) | 0 (0.0%) |
| 5 or more Children | 0 (0.0%) | 0 (0.0%) |
| Total | 0 (0.0%) | 0 (0.0%) |
Income Below Poverty Among Married-Couple vs Single-Parent Households in Columbus
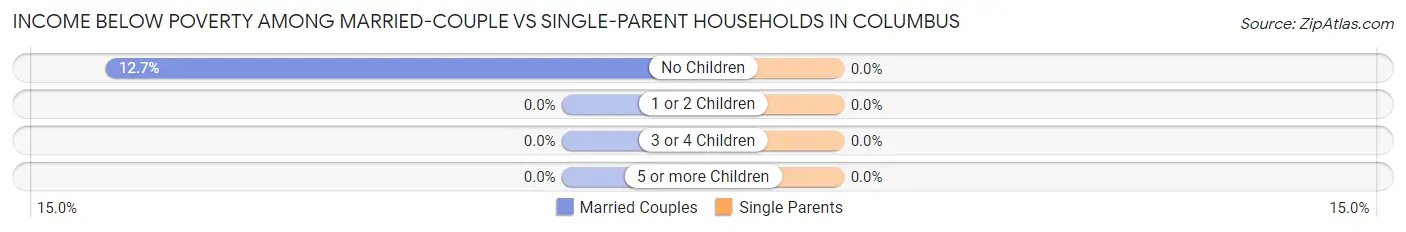
| Children | Married-Couple Families | Single-Parent Households |
| No Children | 50 (12.7%) | 0 (0.0%) |
| 1 or 2 Children | 0 (0.0%) | 0 (0.0%) |
| 3 or 4 Children | 0 (0.0%) | 0 (0.0%) |
| 5 or more Children | 0 (0.0%) | 0 (0.0%) |
| Total | 50 (10.2%) | 0 (0.0%) |
Race in Columbus
The most populous races in Columbus are White / Caucasian (2,520 | 86.2%), Two or more Races (251 | 8.6%), and Black / African American (106 | 3.6%).
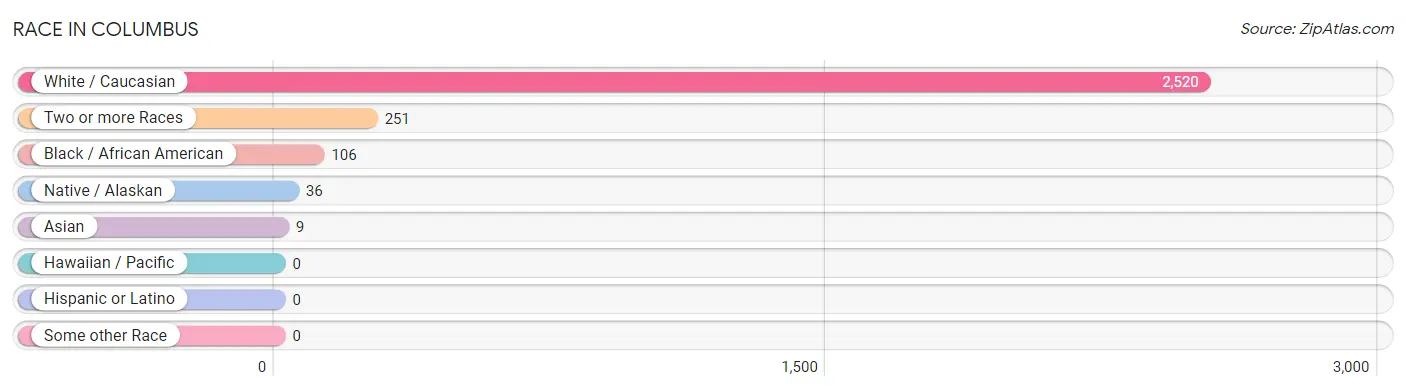
| Race | # Population | % Population |
| Asian | 9 | 0.3% |
| Black / African American | 106 | 3.6% |
| Hawaiian / Pacific | 0 | 0.0% |
| Hispanic or Latino | 0 | 0.0% |
| Native / Alaskan | 36 | 1.2% |
| White / Caucasian | 2,520 | 86.2% |
| Two or more Races | 251 | 8.6% |
| Some other Race | 0 | 0.0% |
| Total | 2,922 | 100.0% |
Ancestry in Columbus
The most populous ancestries reported in Columbus are American (777 | 26.6%), German (488 | 16.7%), Irish (371 | 12.7%), English (341 | 11.7%), and Italian (234 | 8.0%), together accounting for 75.7% of all Columbus residents.
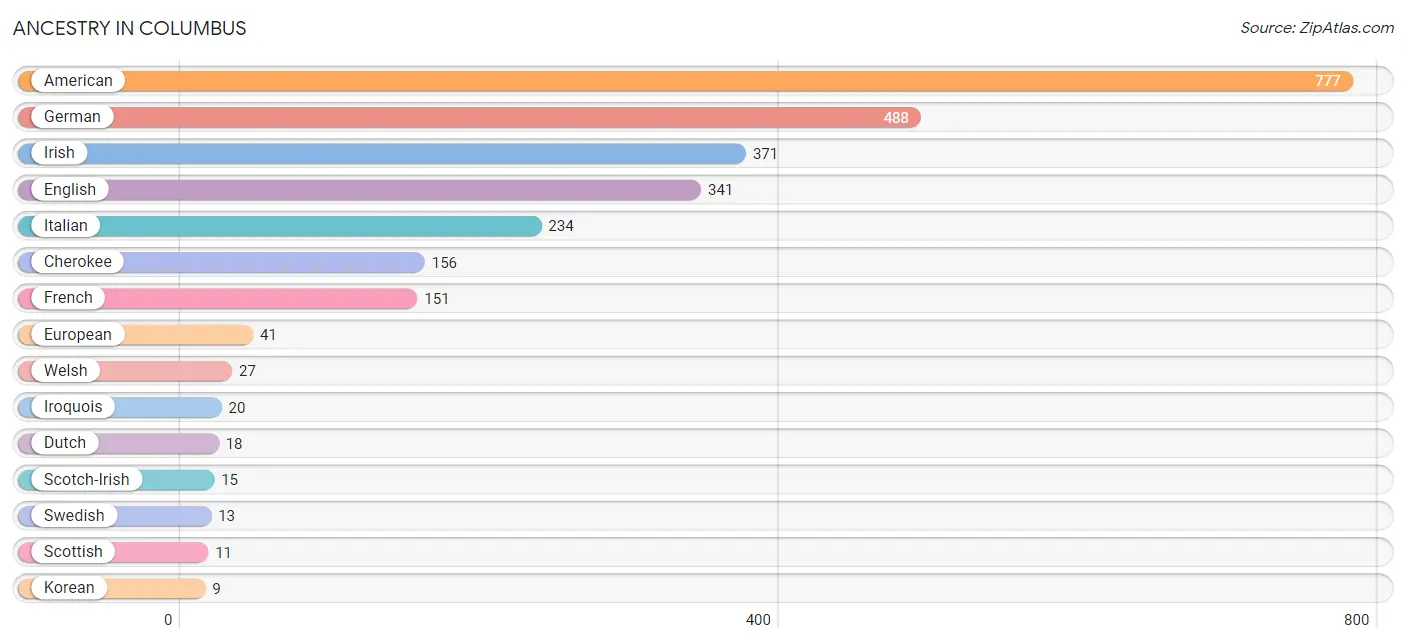
| Ancestry | # Population | % Population |
| American | 777 | 26.6% |
| Cherokee | 156 | 5.3% |
| Dutch | 18 | 0.6% |
| English | 341 | 11.7% |
| European | 41 | 1.4% |
| French | 151 | 5.2% |
| German | 488 | 16.7% |
| Indian (Asian) | 5 | 0.2% |
| Irish | 371 | 12.7% |
| Iroquois | 20 | 0.7% |
| Italian | 234 | 8.0% |
| Korean | 9 | 0.3% |
| Osage | 6 | 0.2% |
| Polish | 8 | 0.3% |
| Scotch-Irish | 15 | 0.5% |
| Scottish | 11 | 0.4% |
| Swedish | 13 | 0.4% |
| Thai | 5 | 0.2% |
| Welsh | 27 | 0.9% | View All 19 Rows |
Immigrants in Columbus
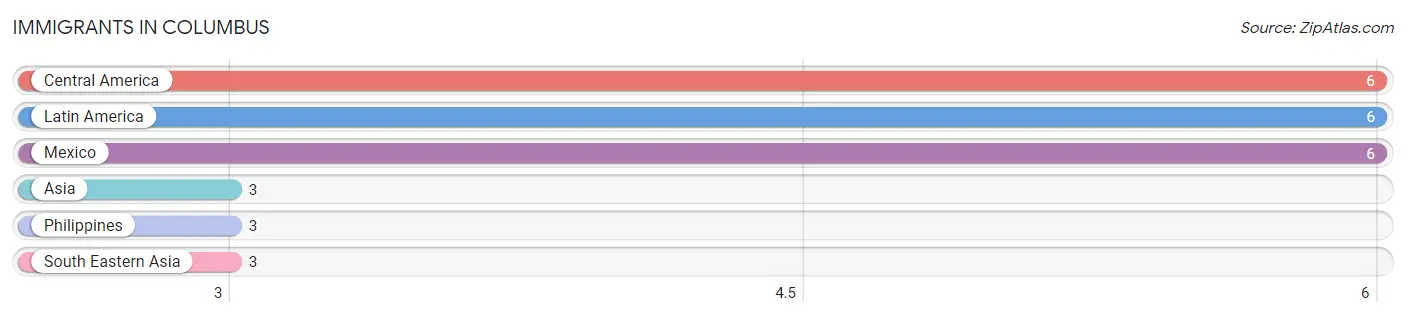
The most numerous immigrant groups reported in Columbus came from Central America (6 | 0.2%), Latin America (6 | 0.2%), Mexico (6 | 0.2%), Asia (3 | 0.1%), and Philippines (3 | 0.1%), together accounting for 0.8% of all Columbus residents.
| Immigration Origin | # Population | % Population |
| Asia | 3 | 0.1% |
| Central America | 6 | 0.2% |
| Latin America | 6 | 0.2% |
| Mexico | 6 | 0.2% |
| Philippines | 3 | 0.1% |
| South Eastern Asia | 3 | 0.1% | View All 6 Rows |
Sex and Age in Columbus
Sex and Age in Columbus
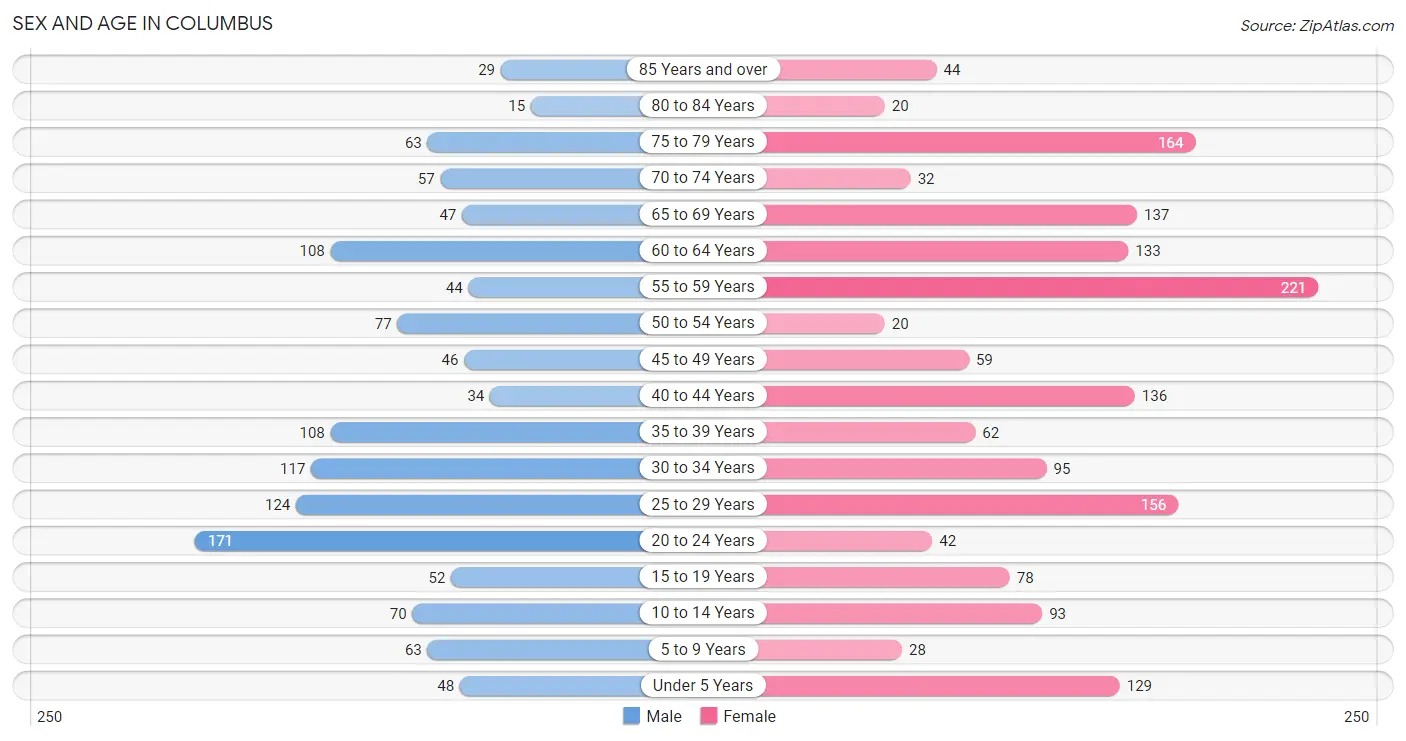
The most populous age groups in Columbus are 20 to 24 Years (171 | 13.4%) for men and 55 to 59 Years (221 | 13.4%) for women.
| Age Bracket | Male | Female |
| Under 5 Years | 48 (3.8%) | 129 (7.8%) |
| 5 to 9 Years | 63 (5.0%) | 28 (1.7%) |
| 10 to 14 Years | 70 (5.5%) | 93 (5.6%) |
| 15 to 19 Years | 52 (4.1%) | 78 (4.7%) |
| 20 to 24 Years | 171 (13.4%) | 42 (2.5%) |
| 25 to 29 Years | 124 (9.7%) | 156 (9.5%) |
| 30 to 34 Years | 117 (9.2%) | 95 (5.8%) |
| 35 to 39 Years | 108 (8.5%) | 62 (3.8%) |
| 40 to 44 Years | 34 (2.7%) | 136 (8.3%) |
| 45 to 49 Years | 46 (3.6%) | 59 (3.6%) |
| 50 to 54 Years | 77 (6.0%) | 20 (1.2%) |
| 55 to 59 Years | 44 (3.5%) | 221 (13.4%) |
| 60 to 64 Years | 108 (8.5%) | 133 (8.1%) |
| 65 to 69 Years | 47 (3.7%) | 137 (8.3%) |
| 70 to 74 Years | 57 (4.5%) | 32 (1.9%) |
| 75 to 79 Years | 63 (5.0%) | 164 (10.0%) |
| 80 to 84 Years | 15 (1.2%) | 20 (1.2%) |
| 85 Years and over | 29 (2.3%) | 44 (2.7%) |
| Total | 1,273 (100.0%) | 1,649 (100.0%) |
Families and Households in Columbus
Median Family Size in Columbus
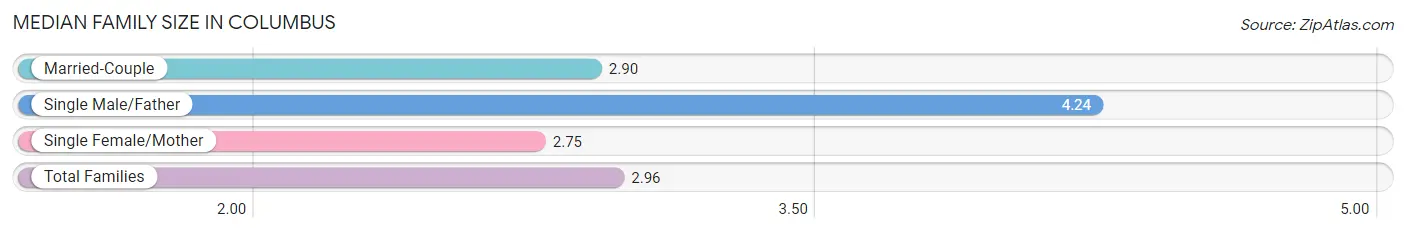
The median family size in Columbus is 2.96 persons per family, with single male/father families (45 | 6.7%) accounting for the largest median family size of 4.24 persons per family. On the other hand, single female/mother families (144 | 21.3%) represent the smallest median family size with 2.75 persons per family.
| Family Type | # Families | Family Size |
| Married-Couple | 488 (72.1%) | 2.90 |
| Single Male/Father | 45 (6.7%) | 4.24 |
| Single Female/Mother | 144 (21.3%) | 2.75 |
| Total Families | 677 (100.0%) | 2.96 |
Median Household Size in Columbus
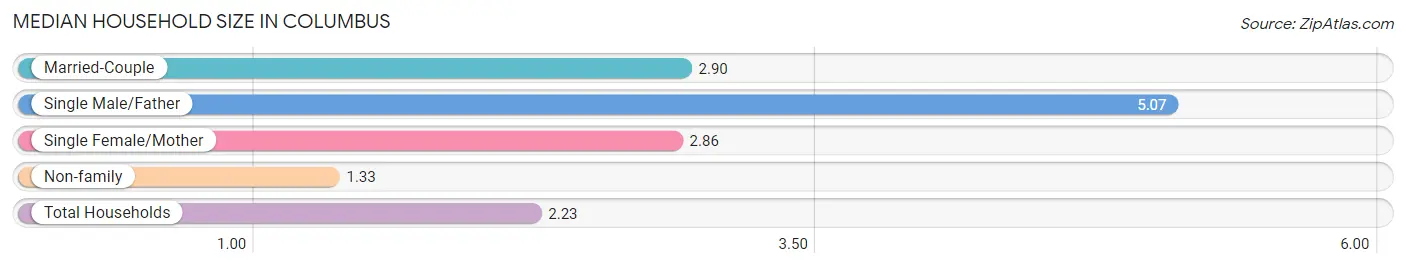
The median household size in Columbus is 2.23 persons per household, with single male/father households (45 | 3.5%) accounting for the largest median household size of 5.07 persons per household. non-family households (602 | 47.1%) represent the smallest median household size with 1.33 persons per household.
| Household Type | # Households | Household Size |
| Married-Couple | 488 (38.2%) | 2.90 |
| Single Male/Father | 45 (3.5%) | 5.07 |
| Single Female/Mother | 144 (11.3%) | 2.86 |
| Non-family | 602 (47.1%) | 1.33 |
| Total Households | 1,279 (100.0%) | 2.23 |
Household Size by Marriage Status in Columbus
Out of a total of 1,279 households in Columbus, 677 (52.9%) are family households, while 602 (47.1%) are nonfamily households. The most numerous type of family households are 2-person households, comprising 420, and the most common type of nonfamily households are 1-person households, comprising 419.
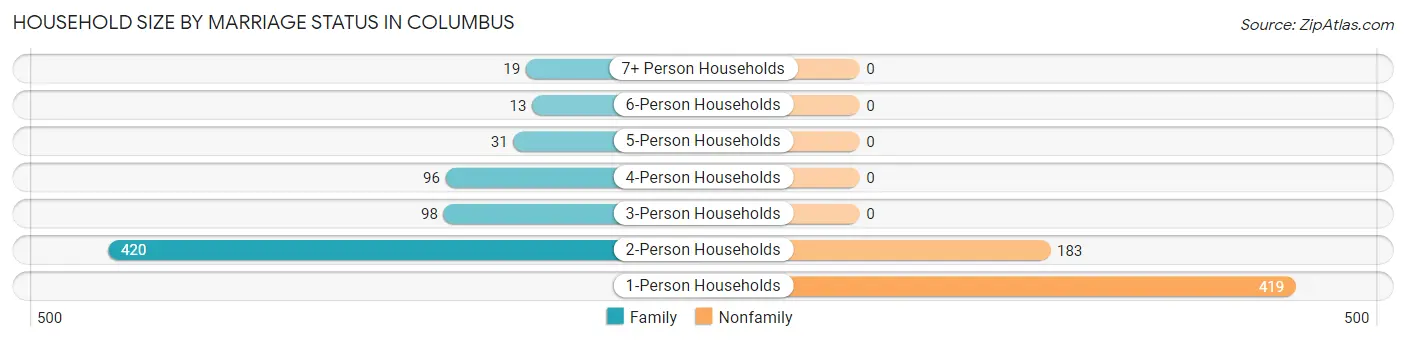
| Household Size | Family Households | Nonfamily Households |
| 1-Person Households | - | 419 (32.8%) |
| 2-Person Households | 420 (32.8%) | 183 (14.3%) |
| 3-Person Households | 98 (7.7%) | 0 (0.0%) |
| 4-Person Households | 96 (7.5%) | 0 (0.0%) |
| 5-Person Households | 31 (2.4%) | 0 (0.0%) |
| 6-Person Households | 13 (1.0%) | 0 (0.0%) |
| 7+ Person Households | 19 (1.5%) | 0 (0.0%) |
| Total | 677 (52.9%) | 602 (47.1%) |
Female Fertility in Columbus
Fertility by Age in Columbus
Average fertility rate in Columbus is 51.0 births per 1,000 women. Women in the age bracket of 15 to 19 years have the highest fertility rate with 115.0 births per 1,000 women. Women in the age bracket of 20 to 34 years acount for 71.9% of all women with births.
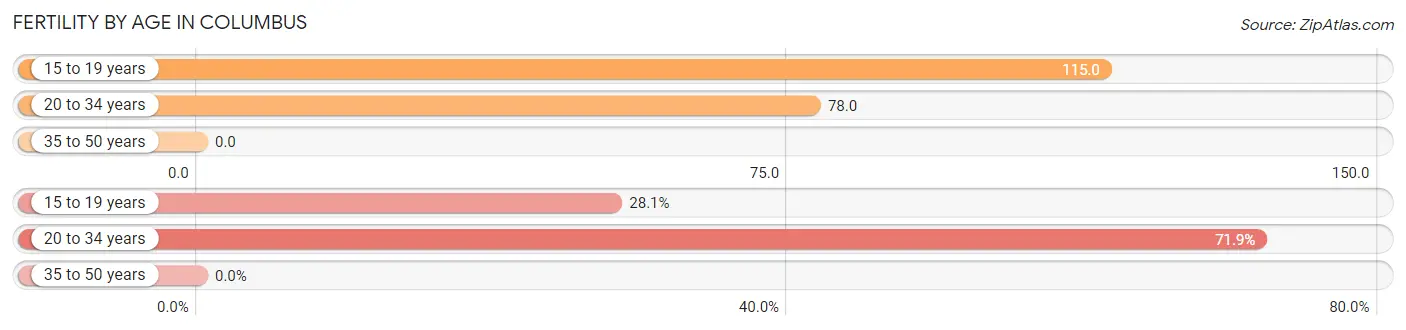
| Age Bracket | Women with Births | Births / 1,000 Women |
| 15 to 19 years | 9 (28.1%) | 115.0 |
| 20 to 34 years | 23 (71.9%) | 78.0 |
| 35 to 50 years | 0 (0.0%) | 0.0 |
| Total | 32 (100.0%) | 51.0 |
Fertility by Age by Marriage Status in Columbus
71.9% of women with births (32) in Columbus are married. The highest percentage of unmarried women with births falls into 15 to 19 years age bracket with 100.0% of them unmarried at the time of birth, while the lowest percentage of unmarried women with births belong to 20 to 34 years age bracket with 0.0% of them unmarried.
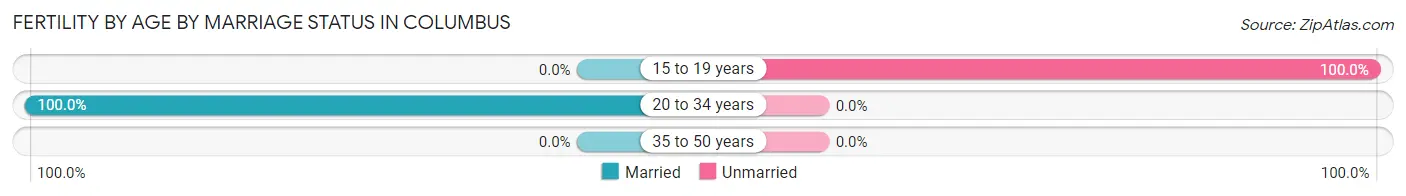
| Age Bracket | Married | Unmarried |
| 15 to 19 years | 0 (0.0%) | 9 (100.0%) |
| 20 to 34 years | 23 (100.0%) | 0 (0.0%) |
| 35 to 50 years | 0 (0.0%) | 0 (0.0%) |
| Total | 23 (71.9%) | 9 (28.1%) |
Fertility by Education in Columbus
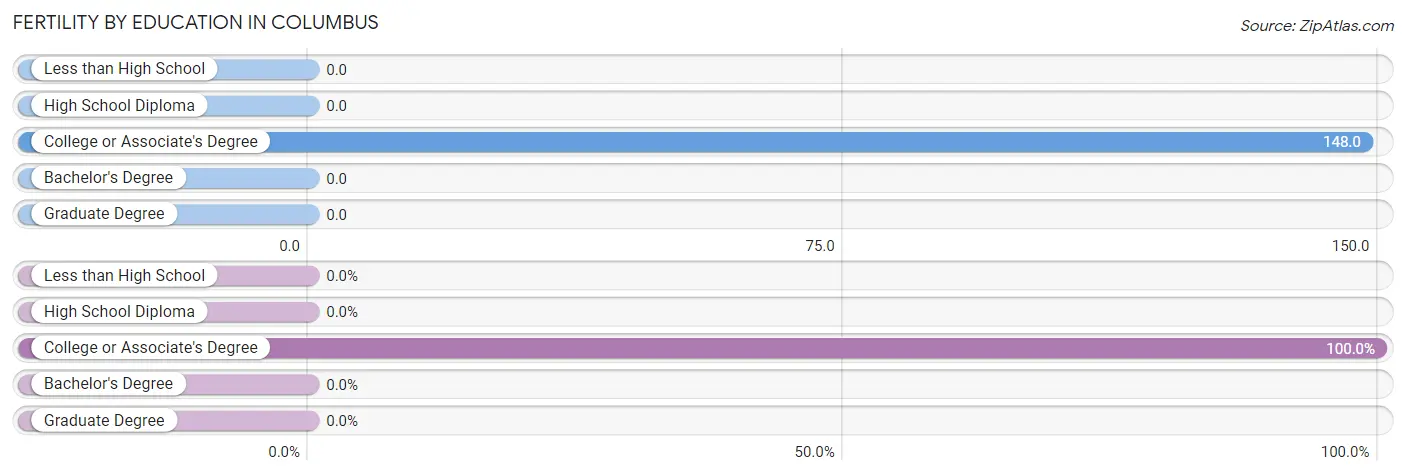
| Educational Attainment | Women with Births | Births / 1,000 Women |
| Less than High School | 0 (0.0%) | 0.0 |
| High School Diploma | 0 (0.0%) | 0.0 |
| College or Associate's Degree | 32 (100.0%) | 148.0 |
| Bachelor's Degree | 0 (0.0%) | 0.0 |
| Graduate Degree | 0 (0.0%) | 0.0 |
| Total | 32 (100.0%) | 51.0 |
Fertility by Education by Marriage Status in Columbus
28.1% of women with births in Columbus are unmarried. Women with the educational attainment of college or associate's degree are most likely to be married with 71.9% of them married at childbirth, while women with the educational attainment of college or associate's degree are least likely to be married with 28.1% of them unmarried at childbirth.
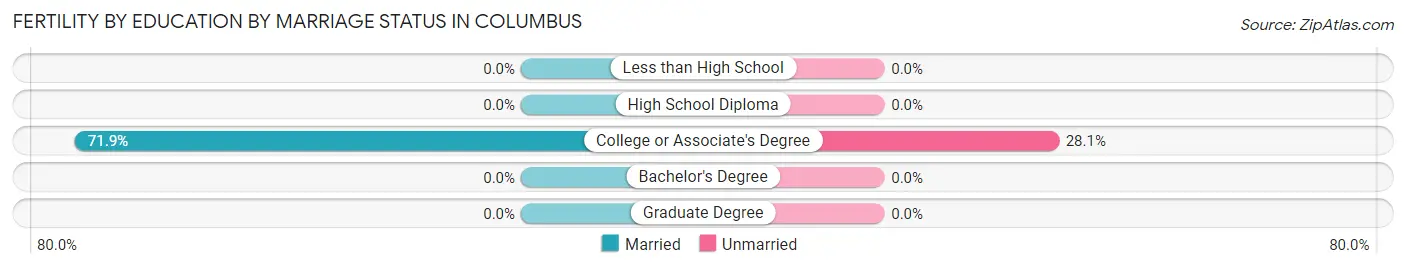
| Educational Attainment | Married | Unmarried |
| Less than High School | 0 (0.0%) | 0 (0.0%) |
| High School Diploma | 0 (0.0%) | 0 (0.0%) |
| College or Associate's Degree | 23 (71.9%) | 9 (28.1%) |
| Bachelor's Degree | 0 (0.0%) | 0 (0.0%) |
| Graduate Degree | 0 (0.0%) | 0 (0.0%) |
| Total | 23 (71.9%) | 9 (28.1%) |
Employment Characteristics in Columbus
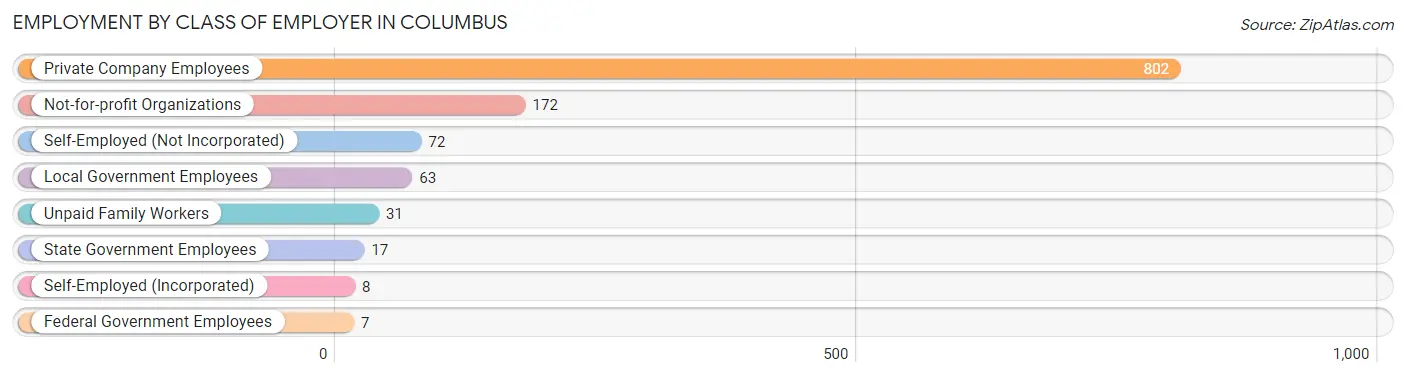
Employment by Class of Employer in Columbus
Among the 1,172 employed individuals in Columbus, private company employees (802 | 68.4%), not-for-profit organizations (172 | 14.7%), and self-employed (not incorporated) (72 | 6.1%) make up the most common classes of employment.
| Employer Class | # Employees | % Employees |
| Private Company Employees | 802 | 68.4% |
| Self-Employed (Incorporated) | 8 | 0.7% |
| Self-Employed (Not Incorporated) | 72 | 6.1% |
| Not-for-profit Organizations | 172 | 14.7% |
| Local Government Employees | 63 | 5.4% |
| State Government Employees | 17 | 1.5% |
| Federal Government Employees | 7 | 0.6% |
| Unpaid Family Workers | 31 | 2.6% |
| Total | 1,172 | 100.0% |
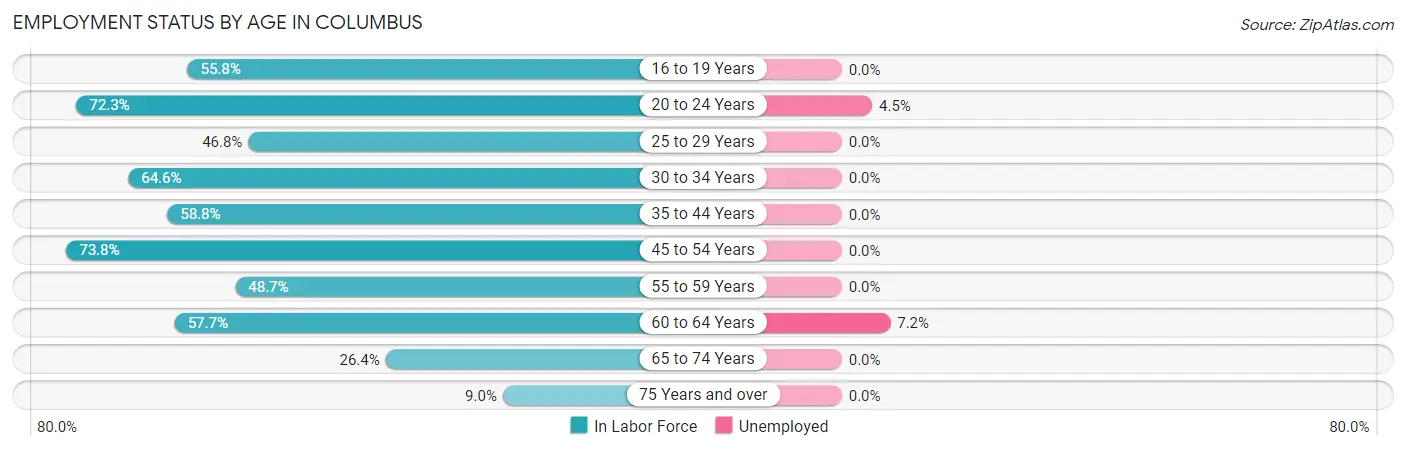
Employment Status by Age in Columbus
According to the labor force statistics for Columbus, out of the total population over 16 years of age (2,447), 48.6% or 1,189 individuals are in the labor force, with 1.4% or 17 of them unemployed. The age group with the highest labor force participation rate is 45 to 54 years, with 73.8% or 149 individuals in the labor force. Within the labor force, the 60 to 64 years age range has the highest percentage of unemployed individuals, with 7.2% or 10 of them being unemployed.
| Age Bracket | In Labor Force | Unemployed |
| 16 to 19 Years | 48 (55.8%) | 0 (0.0%) |
| 20 to 24 Years | 154 (72.3%) | 7 (4.5%) |
| 25 to 29 Years | 131 (46.8%) | 0 (0.0%) |
| 30 to 34 Years | 137 (64.6%) | 0 (0.0%) |
| 35 to 44 Years | 200 (58.8%) | 0 (0.0%) |
| 45 to 54 Years | 149 (73.8%) | 0 (0.0%) |
| 55 to 59 Years | 129 (48.7%) | 0 (0.0%) |
| 60 to 64 Years | 139 (57.7%) | 10 (7.2%) |
| 65 to 74 Years | 72 (26.4%) | 0 (0.0%) |
| 75 Years and over | 30 (9.0%) | 0 (0.0%) |
| Total | 1,189 (48.6%) | 17 (1.4%) |
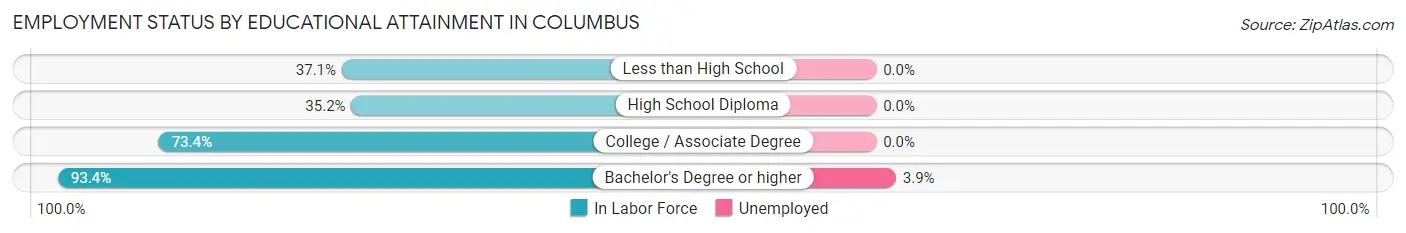
Employment Status by Educational Attainment in Columbus
According to labor force statistics for Columbus, 57.5% of individuals (885) out of the total population between 25 and 64 years of age (1,540) are in the labor force, with 1.1% or 10 of them being unemployed. The group with the highest labor force participation rate are those with the educational attainment of bachelor's degree or higher, with 93.4% or 256 individuals in the labor force. Within the labor force, individuals with bachelor's degree or higher education have the highest percentage of unemployment, with 3.9% or 10 of them being unemployed.
| Educational Attainment | In Labor Force | Unemployed |
| Less than High School | 53 (37.1%) | 0 (0.0%) |
| High School Diploma | 229 (35.2%) | 0 (0.0%) |
| College / Associate Degree | 347 (73.4%) | 0 (0.0%) |
| Bachelor's Degree or higher | 256 (93.4%) | 11 (3.9%) |
| Total | 886 (57.5%) | 17 (1.1%) |
Employment Occupations by Sex in Columbus
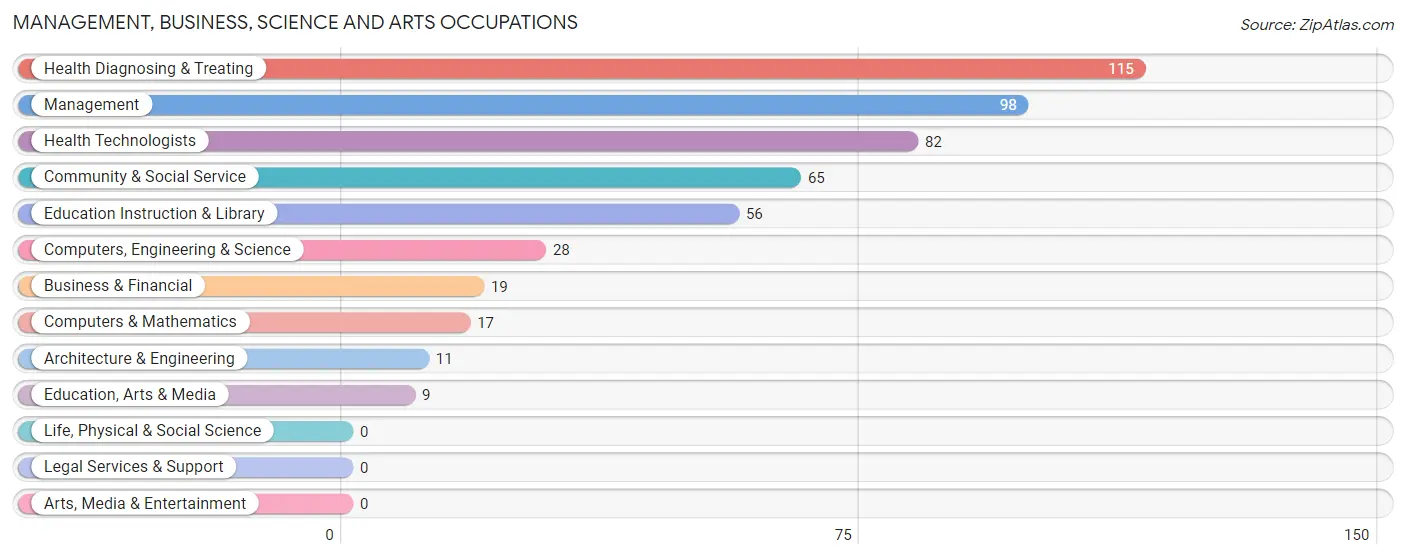
Management, Business, Science and Arts Occupations
The most common Management, Business, Science and Arts occupations in Columbus are Health Diagnosing & Treating (115 | 9.8%), Management (98 | 8.4%), Health Technologists (82 | 7.0%), Community & Social Service (65 | 5.6%), and Education Instruction & Library (56 | 4.8%).
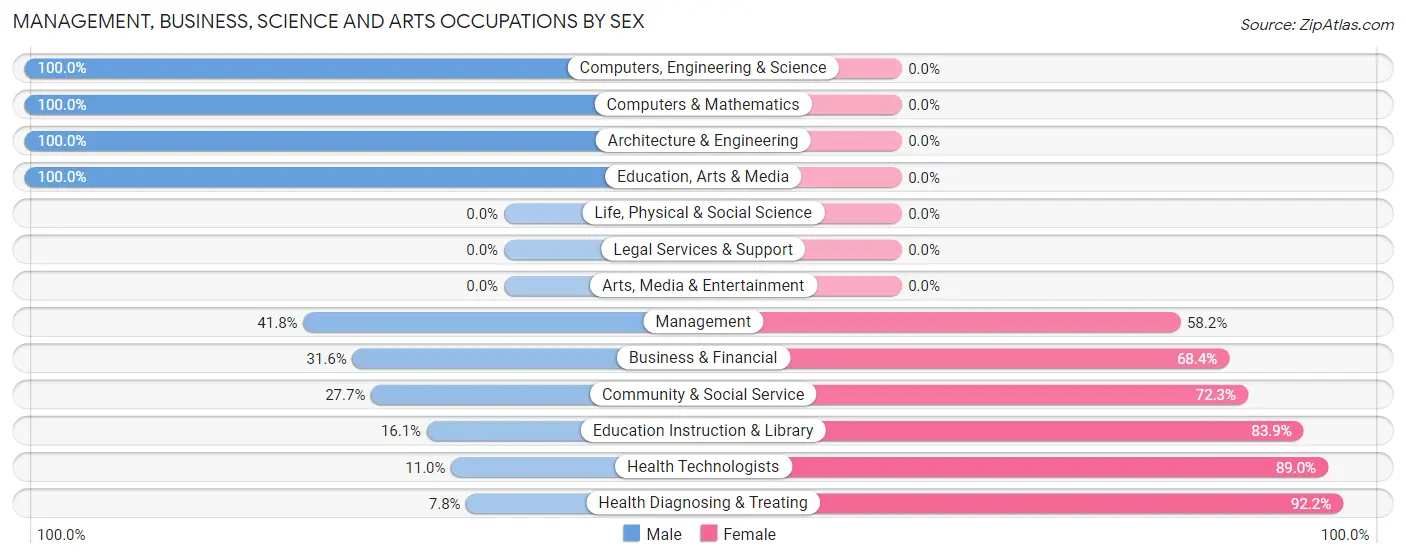
Management, Business, Science and Arts Occupations by Sex
Within the Management, Business, Science and Arts occupations in Columbus, the most male-oriented occupations are Computers, Engineering & Science (100.0%), Computers & Mathematics (100.0%), and Architecture & Engineering (100.0%), while the most female-oriented occupations are Health Diagnosing & Treating (92.2%), Health Technologists (89.0%), and Education Instruction & Library (83.9%).
| Occupation | Male | Female |
| Management | 41 (41.8%) | 57 (58.2%) |
| Business & Financial | 6 (31.6%) | 13 (68.4%) |
| Computers, Engineering & Science | 28 (100.0%) | 0 (0.0%) |
| Computers & Mathematics | 17 (100.0%) | 0 (0.0%) |
| Architecture & Engineering | 11 (100.0%) | 0 (0.0%) |
| Life, Physical & Social Science | 0 (0.0%) | 0 (0.0%) |
| Community & Social Service | 18 (27.7%) | 47 (72.3%) |
| Education, Arts & Media | 9 (100.0%) | 0 (0.0%) |
| Legal Services & Support | 0 (0.0%) | 0 (0.0%) |
| Education Instruction & Library | 9 (16.1%) | 47 (83.9%) |
| Arts, Media & Entertainment | 0 (0.0%) | 0 (0.0%) |
| Health Diagnosing & Treating | 9 (7.8%) | 106 (92.2%) |
| Health Technologists | 9 (11.0%) | 73 (89.0%) |
| Total (Category) | 102 (31.4%) | 223 (68.6%) |
| Total (Overall) | 590 (50.3%) | 582 (49.7%) |
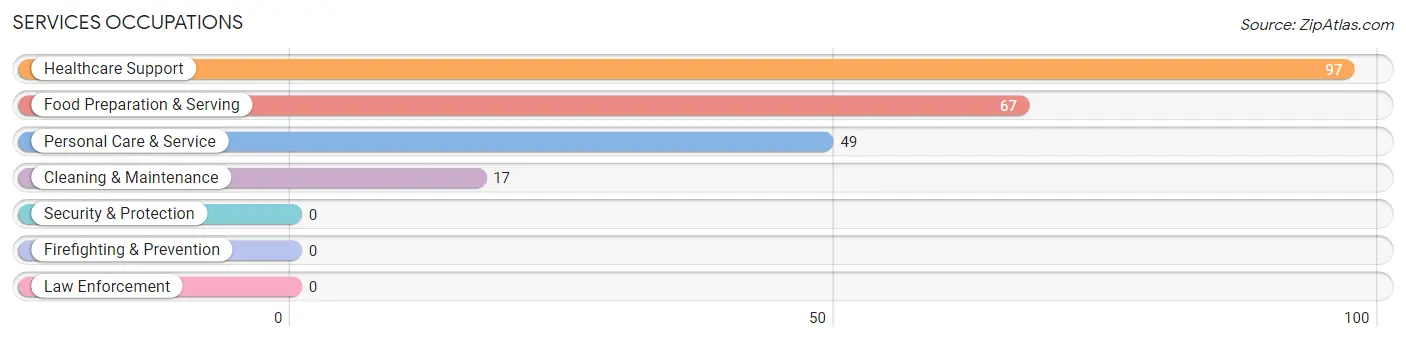
Services Occupations
The most common Services occupations in Columbus are Healthcare Support (97 | 8.3%), Food Preparation & Serving (67 | 5.7%), Personal Care & Service (49 | 4.2%), and Cleaning & Maintenance (17 | 1.5%).
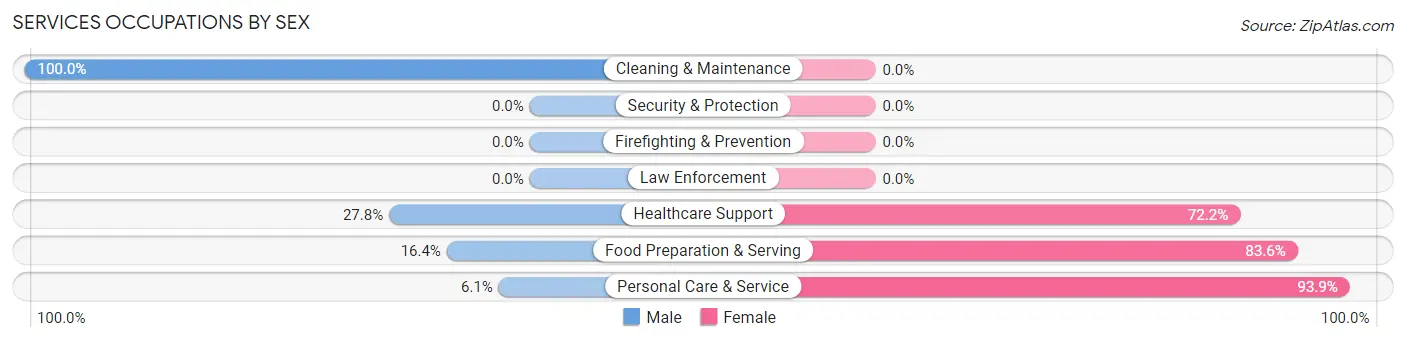
Services Occupations by Sex
Within the Services occupations in Columbus, the most male-oriented occupations are Cleaning & Maintenance (100.0%), Healthcare Support (27.8%), and Food Preparation & Serving (16.4%), while the most female-oriented occupations are Personal Care & Service (93.9%), Food Preparation & Serving (83.6%), and Healthcare Support (72.2%).
| Occupation | Male | Female |
| Healthcare Support | 27 (27.8%) | 70 (72.2%) |
| Security & Protection | 0 (0.0%) | 0 (0.0%) |
| Firefighting & Prevention | 0 (0.0%) | 0 (0.0%) |
| Law Enforcement | 0 (0.0%) | 0 (0.0%) |
| Food Preparation & Serving | 11 (16.4%) | 56 (83.6%) |
| Cleaning & Maintenance | 17 (100.0%) | 0 (0.0%) |
| Personal Care & Service | 3 (6.1%) | 46 (93.9%) |
| Total (Category) | 58 (25.2%) | 172 (74.8%) |
| Total (Overall) | 590 (50.3%) | 582 (49.7%) |
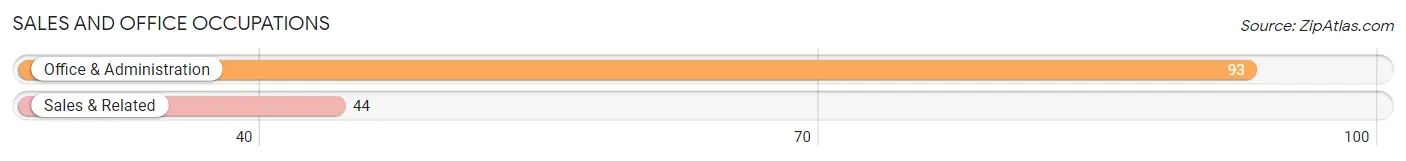
Sales and Office Occupations
The most common Sales and Office occupations in Columbus are Office & Administration (93 | 7.9%), and Sales & Related (44 | 3.7%).
Sales and Office Occupations by Sex
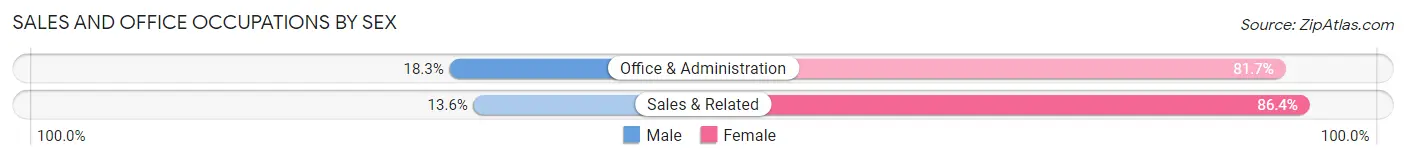
| Occupation | Male | Female |
| Sales & Related | 6 (13.6%) | 38 (86.4%) |
| Office & Administration | 17 (18.3%) | 76 (81.7%) |
| Total (Category) | 23 (16.8%) | 114 (83.2%) |
| Total (Overall) | 590 (50.3%) | 582 (49.7%) |
Natural Resources, Construction and Maintenance Occupations
The most common Natural Resources, Construction and Maintenance occupations in Columbus are Installation, Maintenance & Repair (123 | 10.5%), Construction & Extraction (118 | 10.1%), and Farming, Fishing & Forestry (36 | 3.1%).

Natural Resources, Construction and Maintenance Occupations by Sex
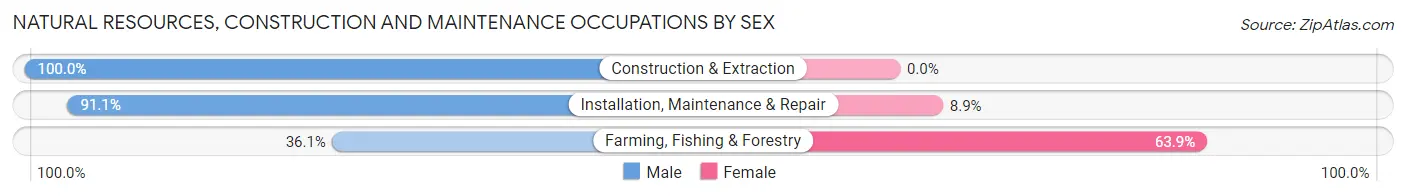
| Occupation | Male | Female |
| Farming, Fishing & Forestry | 13 (36.1%) | 23 (63.9%) |
| Construction & Extraction | 118 (100.0%) | 0 (0.0%) |
| Installation, Maintenance & Repair | 112 (91.1%) | 11 (8.9%) |
| Total (Category) | 243 (87.7%) | 34 (12.3%) |
| Total (Overall) | 590 (50.3%) | 582 (49.7%) |
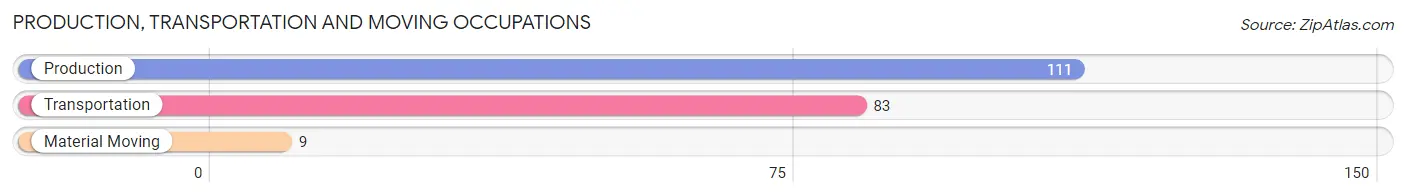
Production, Transportation and Moving Occupations
The most common Production, Transportation and Moving occupations in Columbus are Production (111 | 9.5%), Transportation (83 | 7.1%), and Material Moving (9 | 0.8%).
Production, Transportation and Moving Occupations by Sex
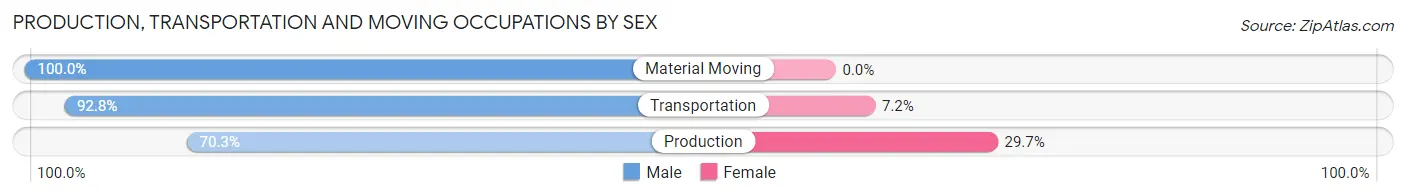
| Occupation | Male | Female |
| Production | 78 (70.3%) | 33 (29.7%) |
| Transportation | 77 (92.8%) | 6 (7.2%) |
| Material Moving | 9 (100.0%) | 0 (0.0%) |
| Total (Category) | 164 (80.8%) | 39 (19.2%) |
| Total (Overall) | 590 (50.3%) | 582 (49.7%) |
Employment Industries by Sex in Columbus
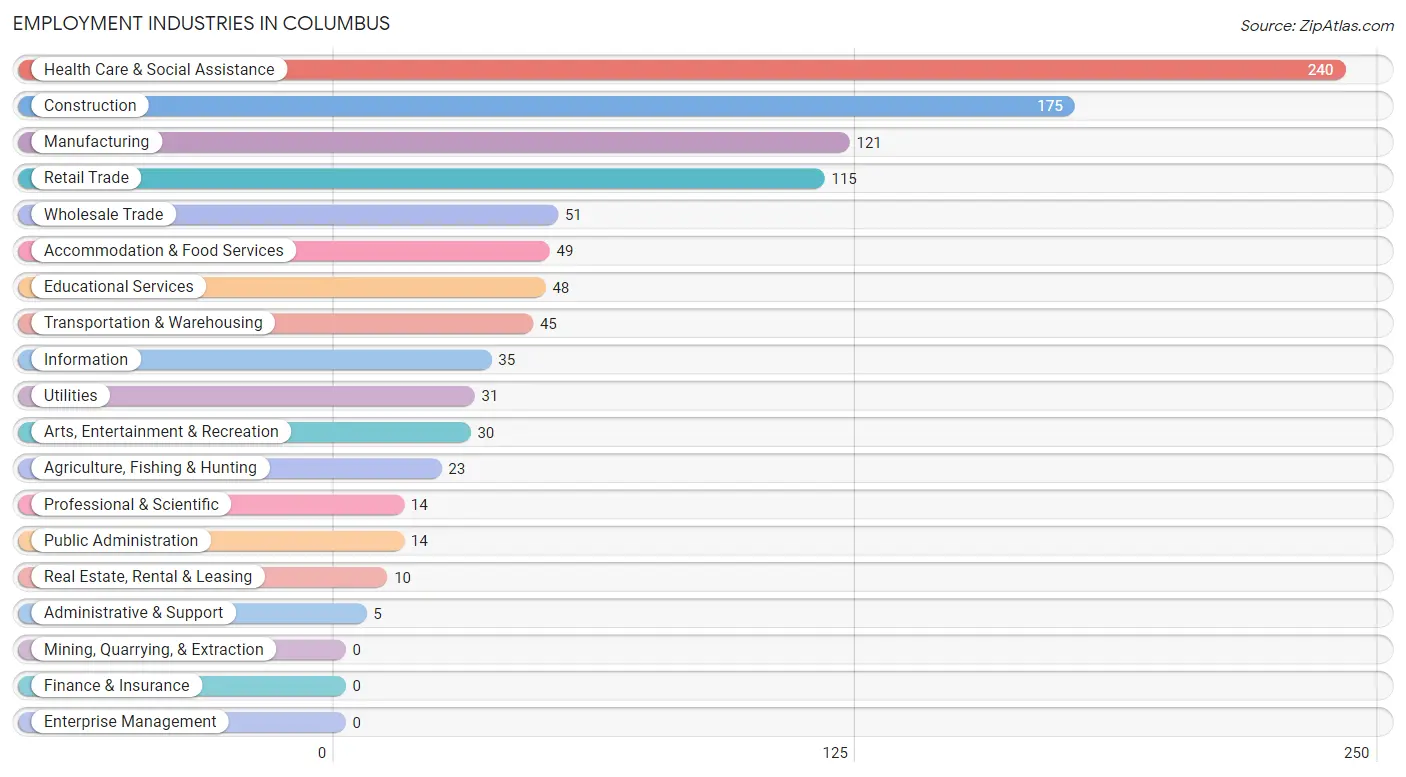
Employment Industries in Columbus
The major employment industries in Columbus include Health Care & Social Assistance (240 | 20.5%), Construction (175 | 14.9%), Manufacturing (121 | 10.3%), Retail Trade (115 | 9.8%), and Wholesale Trade (51 | 4.3%).
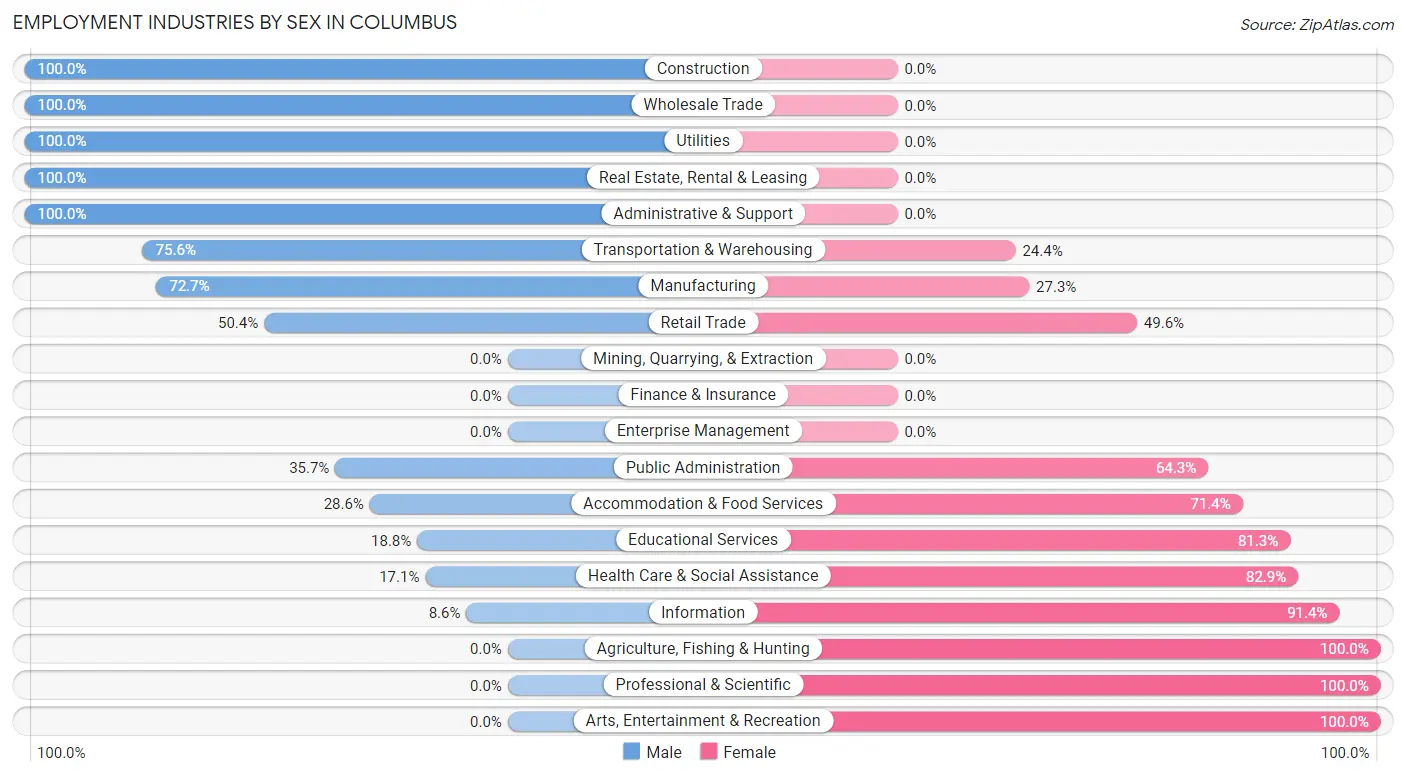
Employment Industries by Sex in Columbus
The Columbus industries that see more men than women are Construction (100.0%), Wholesale Trade (100.0%), and Utilities (100.0%), whereas the industries that tend to have a higher number of women are Agriculture, Fishing & Hunting (100.0%), Professional & Scientific (100.0%), and Arts, Entertainment & Recreation (100.0%).
| Industry | Male | Female |
| Agriculture, Fishing & Hunting | 0 (0.0%) | 23 (100.0%) |
| Mining, Quarrying, & Extraction | 0 (0.0%) | 0 (0.0%) |
| Construction | 175 (100.0%) | 0 (0.0%) |
| Manufacturing | 88 (72.7%) | 33 (27.3%) |
| Wholesale Trade | 51 (100.0%) | 0 (0.0%) |
| Retail Trade | 58 (50.4%) | 57 (49.6%) |
| Transportation & Warehousing | 34 (75.6%) | 11 (24.4%) |
| Utilities | 31 (100.0%) | 0 (0.0%) |
| Information | 3 (8.6%) | 32 (91.4%) |
| Finance & Insurance | 0 (0.0%) | 0 (0.0%) |
| Real Estate, Rental & Leasing | 10 (100.0%) | 0 (0.0%) |
| Professional & Scientific | 0 (0.0%) | 14 (100.0%) |
| Enterprise Management | 0 (0.0%) | 0 (0.0%) |
| Administrative & Support | 5 (100.0%) | 0 (0.0%) |
| Educational Services | 9 (18.8%) | 39 (81.2%) |
| Health Care & Social Assistance | 41 (17.1%) | 199 (82.9%) |
| Arts, Entertainment & Recreation | 0 (0.0%) | 30 (100.0%) |
| Accommodation & Food Services | 14 (28.6%) | 35 (71.4%) |
| Public Administration | 5 (35.7%) | 9 (64.3%) |
| Total | 590 (50.3%) | 582 (49.7%) |
Education in Columbus
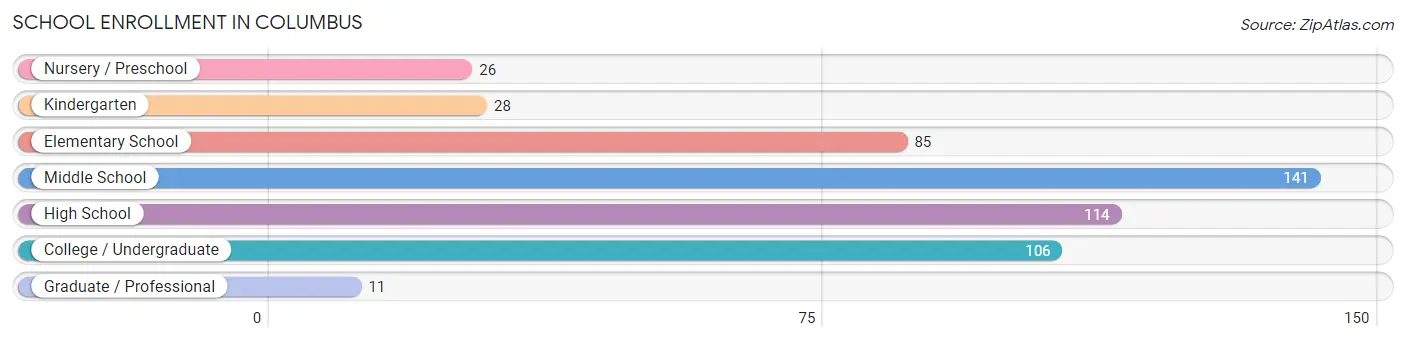
School Enrollment in Columbus
The most common levels of schooling among the 511 students in Columbus are middle school (141 | 27.6%), high school (114 | 22.3%), and college / undergraduate (106 | 20.7%).
| School Level | # Students | % Students |
| Nursery / Preschool | 26 | 5.1% |
| Kindergarten | 28 | 5.5% |
| Elementary School | 85 | 16.6% |
| Middle School | 141 | 27.6% |
| High School | 114 | 22.3% |
| College / Undergraduate | 106 | 20.7% |
| Graduate / Professional | 11 | 2.1% |
| Total | 511 | 100.0% |
School Enrollment by Age by Funding Source in Columbus
Out of a total of 511 students who are enrolled in schools in Columbus, 23 (4.5%) attend a private institution, while the remaining 488 (95.5%) are enrolled in public schools. The age group of 35 years and over has the highest likelihood of being enrolled in private schools, with 11 (100.0% in the age bracket) enrolled. Conversely, the age group of 5 to 9 year old has the lowest likelihood of being enrolled in a private school, with 91 (100.0% in the age bracket) attending a public institution.
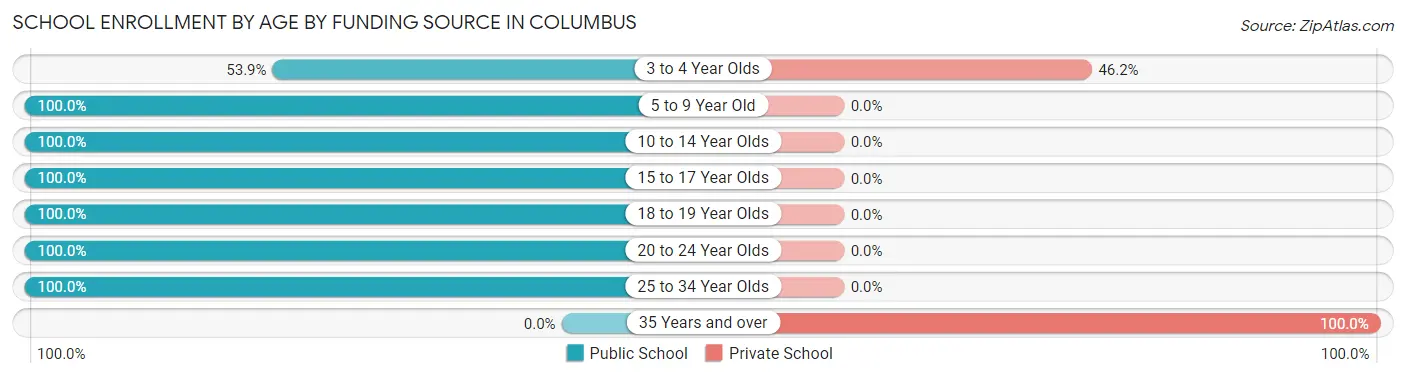
| Age Bracket | Public School | Private School |
| 3 to 4 Year Olds | 14 (53.8%) | 12 (46.2%) |
| 5 to 9 Year Old | 91 (100.0%) | 0 (0.0%) |
| 10 to 14 Year Olds | 163 (100.0%) | 0 (0.0%) |
| 15 to 17 Year Olds | 102 (100.0%) | 0 (0.0%) |
| 18 to 19 Year Olds | 28 (100.0%) | 0 (0.0%) |
| 20 to 24 Year Olds | 75 (100.0%) | 0 (0.0%) |
| 25 to 34 Year Olds | 15 (100.0%) | 0 (0.0%) |
| 35 Years and over | 0 (0.0%) | 11 (100.0%) |
| Total | 488 (95.5%) | 23 (4.5%) |
Educational Attainment by Field of Study in Columbus
Education (174 | 36.1%), science & technology (73 | 15.1%), business (51 | 10.6%), bio, nature & agricultural (34 | 7.0%), and liberal arts & history (34 | 7.0%) are the most common fields of study among 482 individuals in Columbus who have obtained a bachelor's degree or higher.
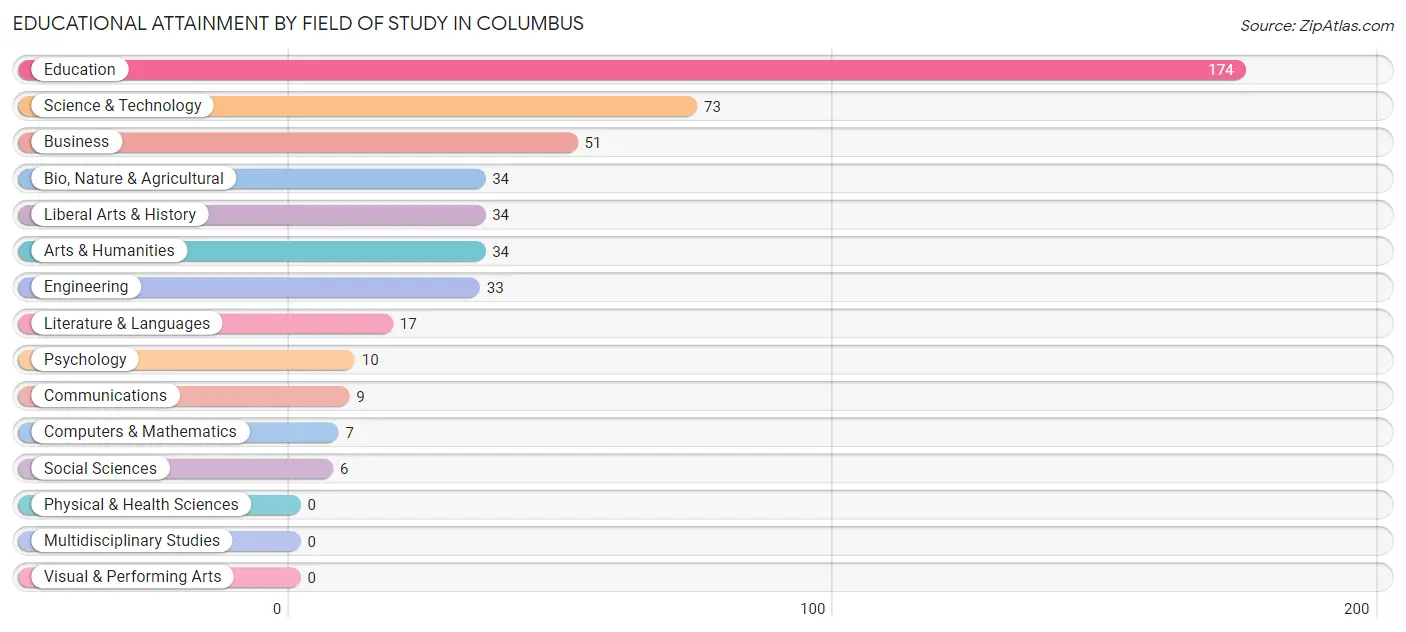
| Field of Study | # Graduates | % Graduates |
| Computers & Mathematics | 7 | 1.5% |
| Bio, Nature & Agricultural | 34 | 7.0% |
| Physical & Health Sciences | 0 | 0.0% |
| Psychology | 10 | 2.1% |
| Social Sciences | 6 | 1.2% |
| Engineering | 33 | 6.9% |
| Multidisciplinary Studies | 0 | 0.0% |
| Science & Technology | 73 | 15.1% |
| Business | 51 | 10.6% |
| Education | 174 | 36.1% |
| Literature & Languages | 17 | 3.5% |
| Liberal Arts & History | 34 | 7.0% |
| Visual & Performing Arts | 0 | 0.0% |
| Communications | 9 | 1.9% |
| Arts & Humanities | 34 | 7.0% |
| Total | 482 | 100.0% |
Transportation & Commute in Columbus
Vehicle Availability by Sex in Columbus
The most prevalent vehicle ownership categories in Columbus are males with 2 vehicles (229, accounting for 39.0%) and females with 2 vehicles (240, making up 39.5%).
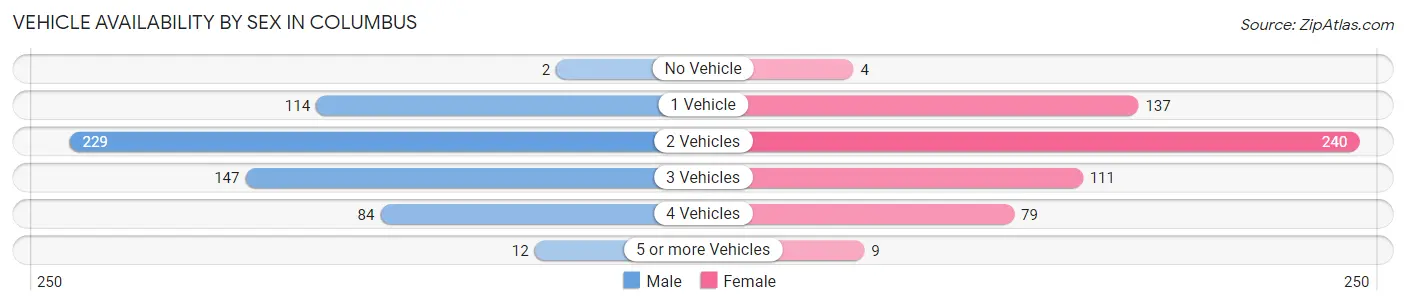
| Vehicles Available | Male | Female |
| No Vehicle | 2 (0.3%) | 4 (0.7%) |
| 1 Vehicle | 114 (19.4%) | 137 (23.6%) |
| 2 Vehicles | 229 (39.0%) | 240 (41.4%) |
| 3 Vehicles | 147 (25.0%) | 111 (19.1%) |
| 4 Vehicles | 84 (14.3%) | 79 (13.6%) |
| 5 or more Vehicles | 12 (2.0%) | 9 (1.5%) |
| Total | 588 (100.0%) | 580 (100.0%) |
Commute Time in Columbus
The most frequently occuring commute durations in Columbus are 5 to 9 minutes (253 commuters, 22.0%), 10 to 14 minutes (237 commuters, 20.6%), and less than 5 minutes (158 commuters, 13.7%).
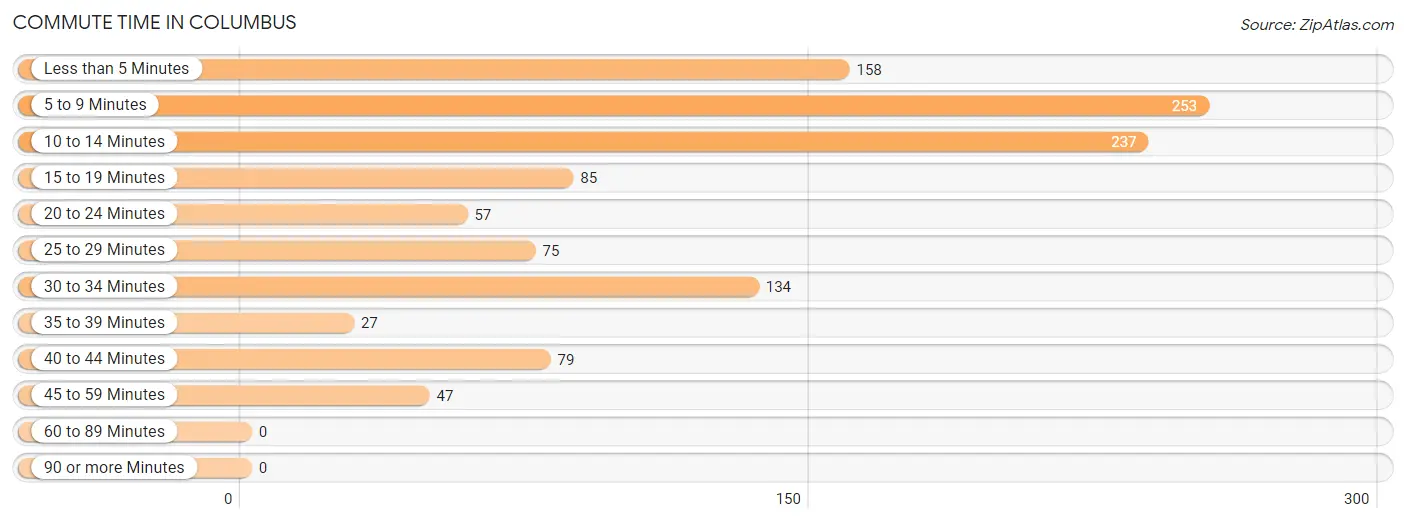
| Commute Time | # Commuters | % Commuters |
| Less than 5 Minutes | 158 | 13.7% |
| 5 to 9 Minutes | 253 | 22.0% |
| 10 to 14 Minutes | 237 | 20.6% |
| 15 to 19 Minutes | 85 | 7.4% |
| 20 to 24 Minutes | 57 | 5.0% |
| 25 to 29 Minutes | 75 | 6.5% |
| 30 to 34 Minutes | 134 | 11.6% |
| 35 to 39 Minutes | 27 | 2.3% |
| 40 to 44 Minutes | 79 | 6.9% |
| 45 to 59 Minutes | 47 | 4.1% |
| 60 to 89 Minutes | 0 | 0.0% |
| 90 or more Minutes | 0 | 0.0% |
Commute Time by Sex in Columbus
The most common commute times in Columbus are 10 to 14 minutes (147 commuters, 25.6%) for males and 5 to 9 minutes (131 commuters, 22.7%) for females.
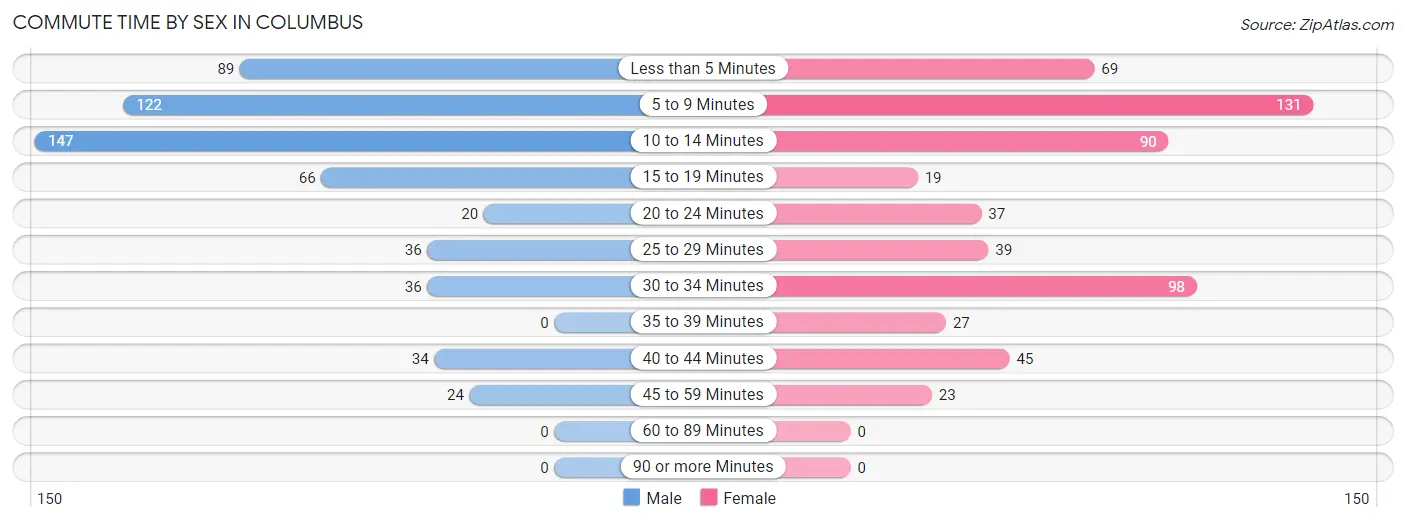
| Commute Time | Male | Female |
| Less than 5 Minutes | 89 (15.5%) | 69 (11.9%) |
| 5 to 9 Minutes | 122 (21.2%) | 131 (22.7%) |
| 10 to 14 Minutes | 147 (25.6%) | 90 (15.6%) |
| 15 to 19 Minutes | 66 (11.5%) | 19 (3.3%) |
| 20 to 24 Minutes | 20 (3.5%) | 37 (6.4%) |
| 25 to 29 Minutes | 36 (6.3%) | 39 (6.8%) |
| 30 to 34 Minutes | 36 (6.3%) | 98 (17.0%) |
| 35 to 39 Minutes | 0 (0.0%) | 27 (4.7%) |
| 40 to 44 Minutes | 34 (5.9%) | 45 (7.8%) |
| 45 to 59 Minutes | 24 (4.2%) | 23 (4.0%) |
| 60 to 89 Minutes | 0 (0.0%) | 0 (0.0%) |
| 90 or more Minutes | 0 (0.0%) | 0 (0.0%) |
Time of Departure to Work by Sex in Columbus
The most frequent times of departure to work in Columbus are 7:00 AM to 7:29 AM (121, 21.1%) for males and 6:30 AM to 6:59 AM (89, 15.4%) for females.
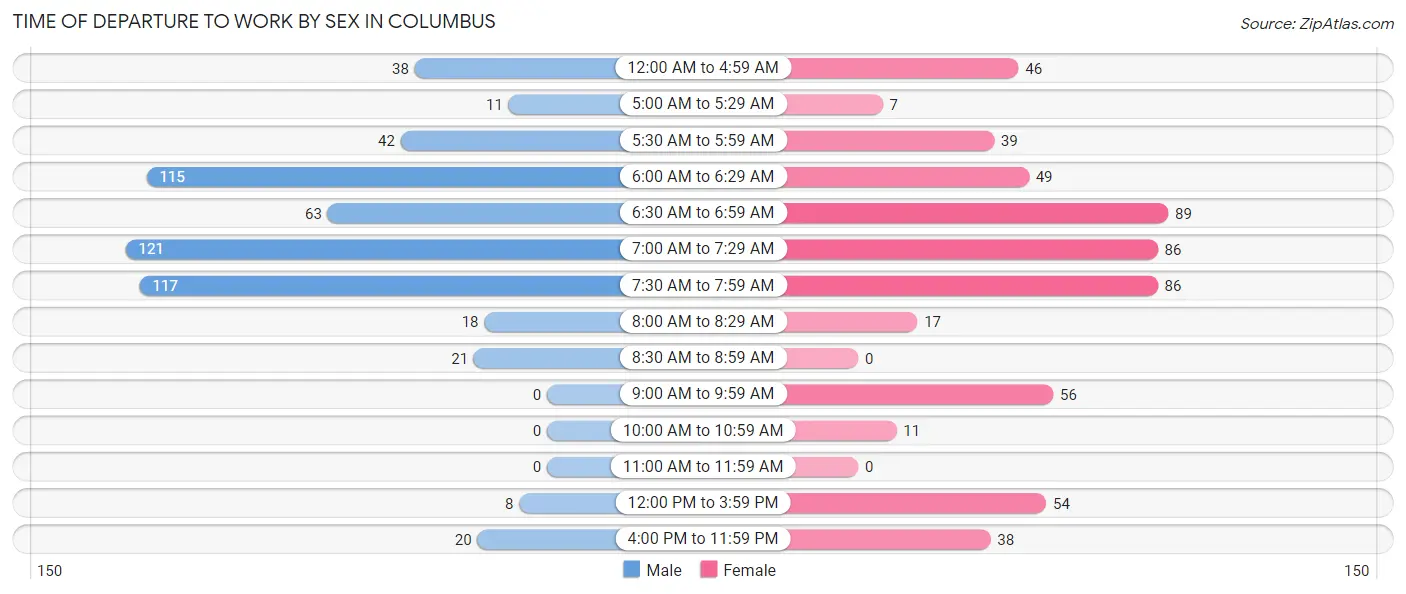
| Time of Departure | Male | Female |
| 12:00 AM to 4:59 AM | 38 (6.6%) | 46 (8.0%) |
| 5:00 AM to 5:29 AM | 11 (1.9%) | 7 (1.2%) |
| 5:30 AM to 5:59 AM | 42 (7.3%) | 39 (6.8%) |
| 6:00 AM to 6:29 AM | 115 (20.0%) | 49 (8.5%) |
| 6:30 AM to 6:59 AM | 63 (11.0%) | 89 (15.4%) |
| 7:00 AM to 7:29 AM | 121 (21.1%) | 86 (14.9%) |
| 7:30 AM to 7:59 AM | 117 (20.4%) | 86 (14.9%) |
| 8:00 AM to 8:29 AM | 18 (3.1%) | 17 (2.9%) |
| 8:30 AM to 8:59 AM | 21 (3.7%) | 0 (0.0%) |
| 9:00 AM to 9:59 AM | 0 (0.0%) | 56 (9.7%) |
| 10:00 AM to 10:59 AM | 0 (0.0%) | 11 (1.9%) |
| 11:00 AM to 11:59 AM | 0 (0.0%) | 0 (0.0%) |
| 12:00 PM to 3:59 PM | 8 (1.4%) | 54 (9.3%) |
| 4:00 PM to 11:59 PM | 20 (3.5%) | 38 (6.6%) |
| Total | 574 (100.0%) | 578 (100.0%) |
Housing Occupancy in Columbus
Occupancy by Ownership in Columbus
Of the total 1,279 dwellings in Columbus, owner-occupied units account for 726 (56.8%), while renter-occupied units make up 553 (43.2%).
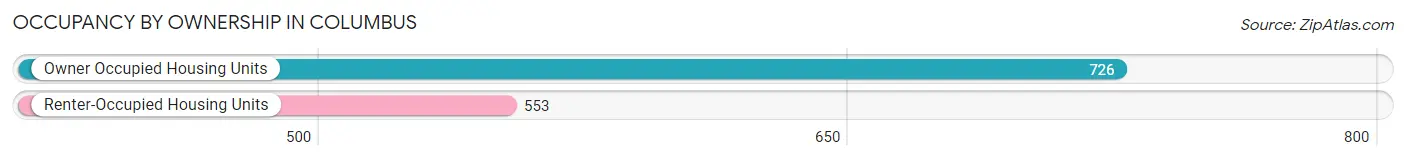
| Occupancy | # Housing Units | % Housing Units |
| Owner Occupied Housing Units | 726 | 56.8% |
| Renter-Occupied Housing Units | 553 | 43.2% |
| Total Occupied Housing Units | 1,279 | 100.0% |
Occupancy by Household Size in Columbus
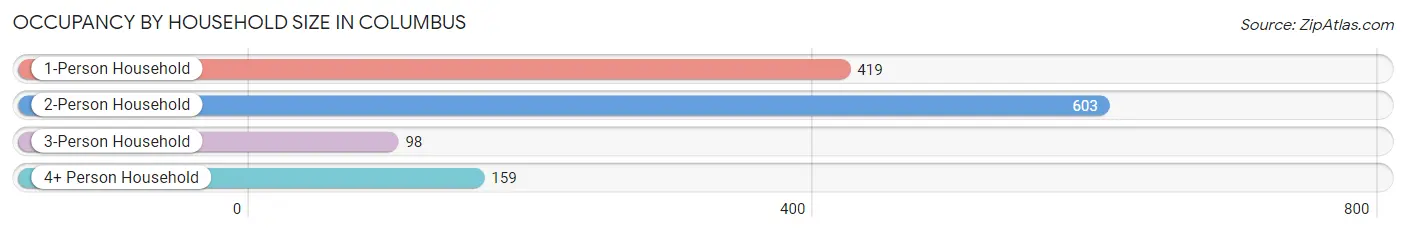
| Household Size | # Housing Units | % Housing Units |
| 1-Person Household | 419 | 32.8% |
| 2-Person Household | 603 | 47.1% |
| 3-Person Household | 98 | 7.7% |
| 4+ Person Household | 159 | 12.4% |
| Total Housing Units | 1,279 | 100.0% |
Occupancy by Ownership by Household Size in Columbus
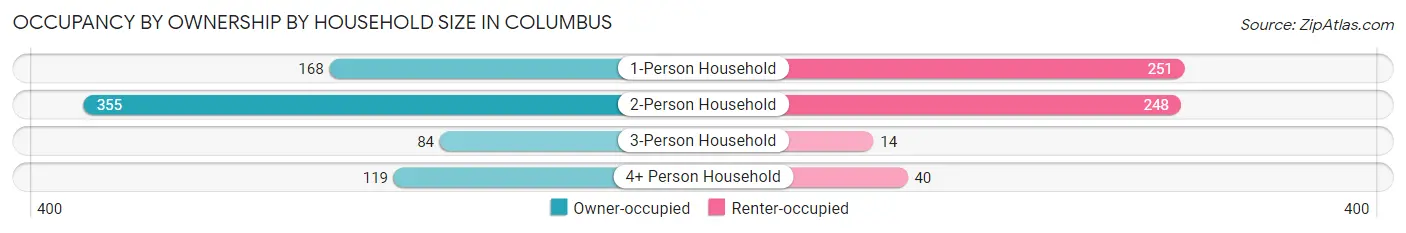
| Household Size | Owner-occupied | Renter-occupied |
| 1-Person Household | 168 (40.1%) | 251 (59.9%) |
| 2-Person Household | 355 (58.9%) | 248 (41.1%) |
| 3-Person Household | 84 (85.7%) | 14 (14.3%) |
| 4+ Person Household | 119 (74.8%) | 40 (25.2%) |
| Total Housing Units | 726 (56.8%) | 553 (43.2%) |
Occupancy by Educational Attainment in Columbus
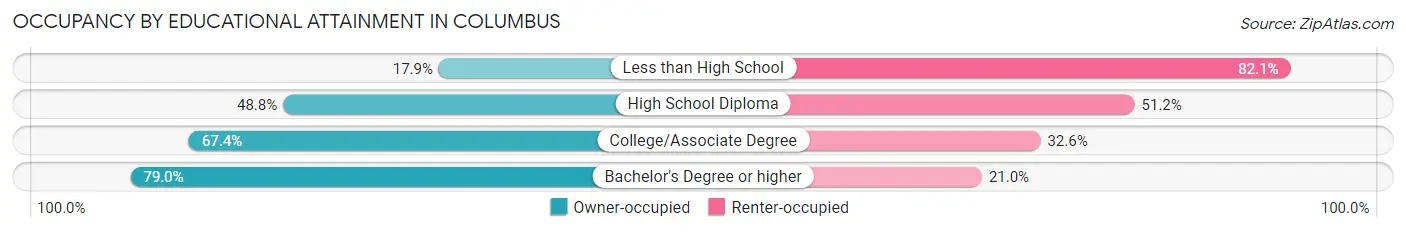
| Household Size | Owner-occupied | Renter-occupied |
| Less than High School | 27 (17.9%) | 124 (82.1%) |
| High School Diploma | 236 (48.8%) | 248 (51.2%) |
| College/Associate Degree | 267 (67.4%) | 129 (32.6%) |
| Bachelor's Degree or higher | 196 (79.0%) | 52 (21.0%) |
Occupancy by Age of Householder in Columbus
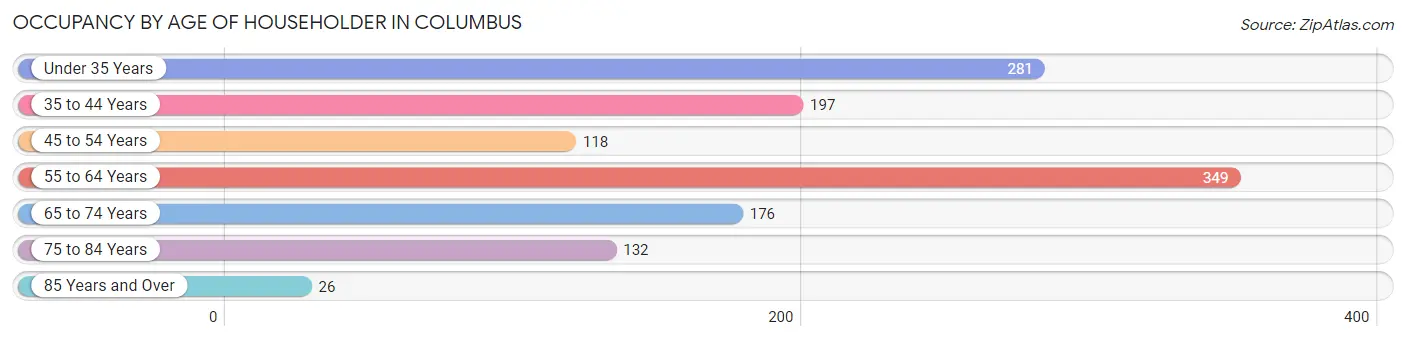
| Age Bracket | # Households | % Households |
| Under 35 Years | 281 | 22.0% |
| 35 to 44 Years | 197 | 15.4% |
| 45 to 54 Years | 118 | 9.2% |
| 55 to 64 Years | 349 | 27.3% |
| 65 to 74 Years | 176 | 13.8% |
| 75 to 84 Years | 132 | 10.3% |
| 85 Years and Over | 26 | 2.0% |
| Total | 1,279 | 100.0% |
Housing Finances in Columbus
Median Income by Occupancy in Columbus
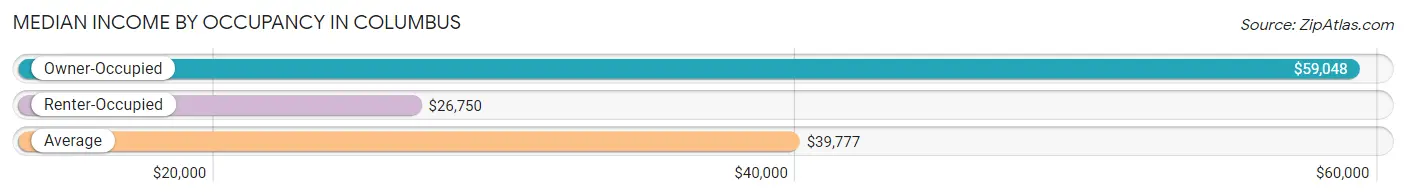
| Occupancy Type | # Households | Median Income |
| Owner-Occupied | 726 (56.8%) | $59,048 |
| Renter-Occupied | 553 (43.2%) | $26,750 |
| Average | 1,279 (100.0%) | $39,777 |
Occupancy by Householder Income Bracket in Columbus
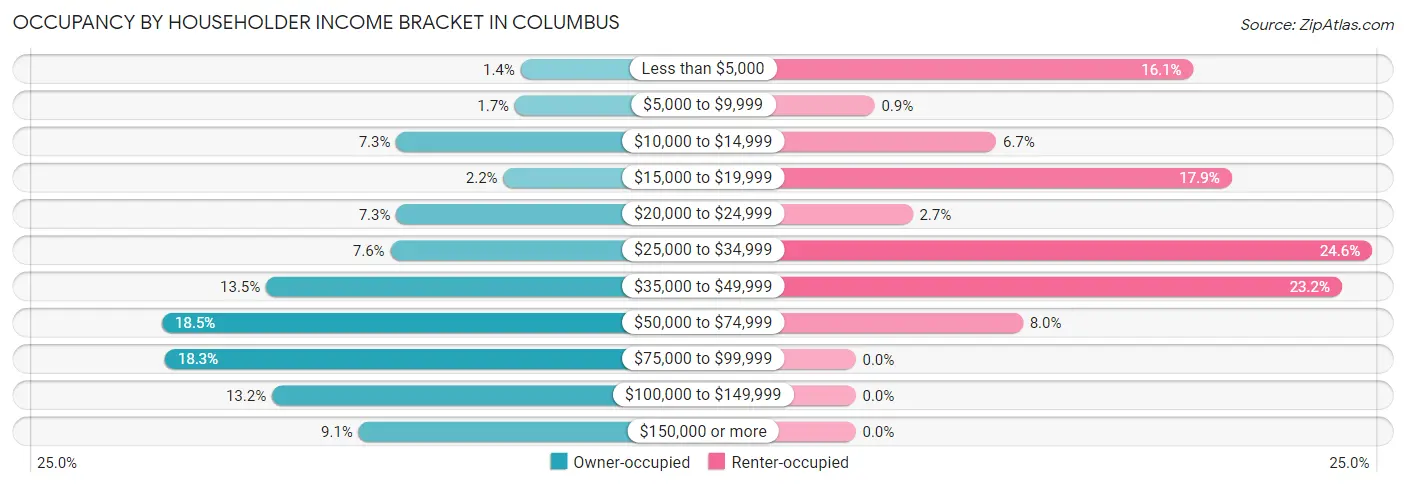
| Income Bracket | Owner-occupied | Renter-occupied |
| Less than $5,000 | 10 (1.4%) | 89 (16.1%) |
| $5,000 to $9,999 | 12 (1.7%) | 5 (0.9%) |
| $10,000 to $14,999 | 53 (7.3%) | 37 (6.7%) |
| $15,000 to $19,999 | 16 (2.2%) | 99 (17.9%) |
| $20,000 to $24,999 | 53 (7.3%) | 15 (2.7%) |
| $25,000 to $34,999 | 55 (7.6%) | 136 (24.6%) |
| $35,000 to $49,999 | 98 (13.5%) | 128 (23.2%) |
| $50,000 to $74,999 | 134 (18.5%) | 44 (8.0%) |
| $75,000 to $99,999 | 133 (18.3%) | 0 (0.0%) |
| $100,000 to $149,999 | 96 (13.2%) | 0 (0.0%) |
| $150,000 or more | 66 (9.1%) | 0 (0.0%) |
| Total | 726 (100.0%) | 553 (100.0%) |
Monthly Housing Cost Tiers in Columbus
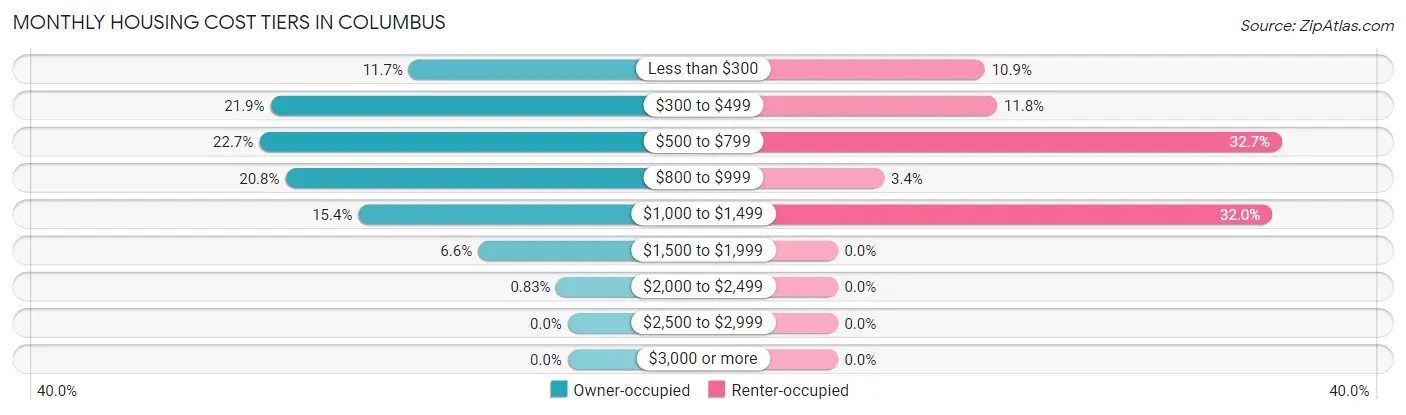
| Monthly Cost | Owner-occupied | Renter-occupied |
| Less than $300 | 85 (11.7%) | 60 (10.8%) |
| $300 to $499 | 159 (21.9%) | 65 (11.7%) |
| $500 to $799 | 165 (22.7%) | 181 (32.7%) |
| $800 to $999 | 151 (20.8%) | 19 (3.4%) |
| $1,000 to $1,499 | 112 (15.4%) | 177 (32.0%) |
| $1,500 to $1,999 | 48 (6.6%) | 0 (0.0%) |
| $2,000 to $2,499 | 6 (0.8%) | 0 (0.0%) |
| $2,500 to $2,999 | 0 (0.0%) | 0 (0.0%) |
| $3,000 or more | 0 (0.0%) | 0 (0.0%) |
| Total | 726 (100.0%) | 553 (100.0%) |
Physical Housing Characteristics in Columbus
Housing Structures in Columbus
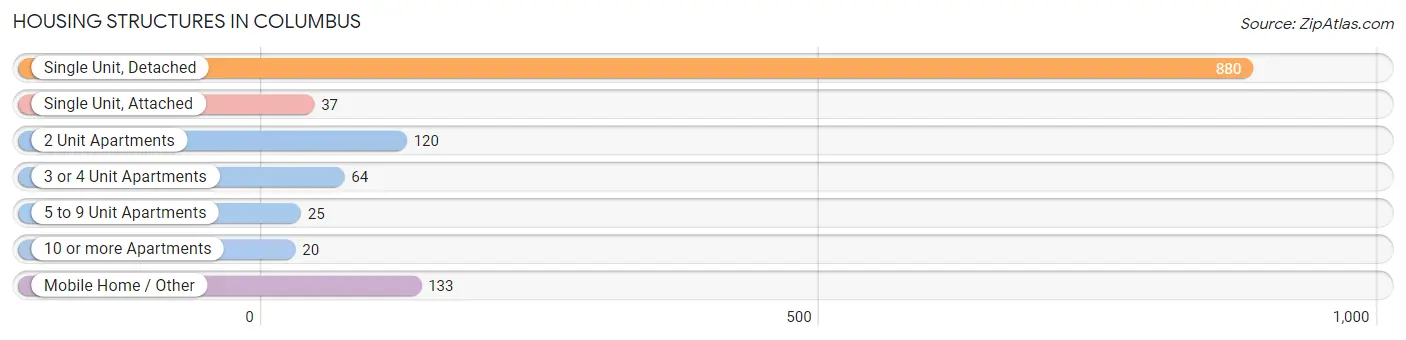
| Structure Type | # Housing Units | % Housing Units |
| Single Unit, Detached | 880 | 68.8% |
| Single Unit, Attached | 37 | 2.9% |
| 2 Unit Apartments | 120 | 9.4% |
| 3 or 4 Unit Apartments | 64 | 5.0% |
| 5 to 9 Unit Apartments | 25 | 1.9% |
| 10 or more Apartments | 20 | 1.6% |
| Mobile Home / Other | 133 | 10.4% |
| Total | 1,279 | 100.0% |
Housing Structures by Occupancy in Columbus
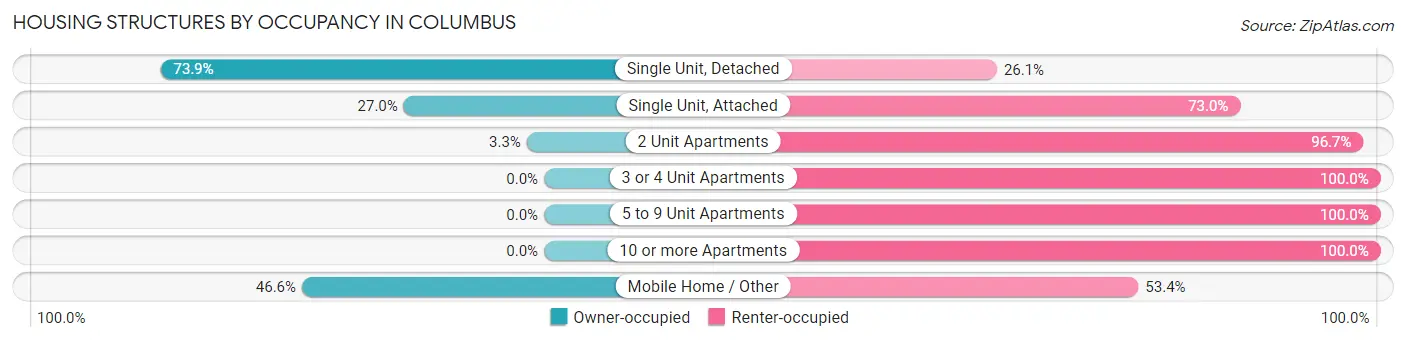
| Structure Type | Owner-occupied | Renter-occupied |
| Single Unit, Detached | 650 (73.9%) | 230 (26.1%) |
| Single Unit, Attached | 10 (27.0%) | 27 (73.0%) |
| 2 Unit Apartments | 4 (3.3%) | 116 (96.7%) |
| 3 or 4 Unit Apartments | 0 (0.0%) | 64 (100.0%) |
| 5 to 9 Unit Apartments | 0 (0.0%) | 25 (100.0%) |
| 10 or more Apartments | 0 (0.0%) | 20 (100.0%) |
| Mobile Home / Other | 62 (46.6%) | 71 (53.4%) |
| Total | 726 (56.8%) | 553 (43.2%) |
Housing Structures by Number of Rooms in Columbus
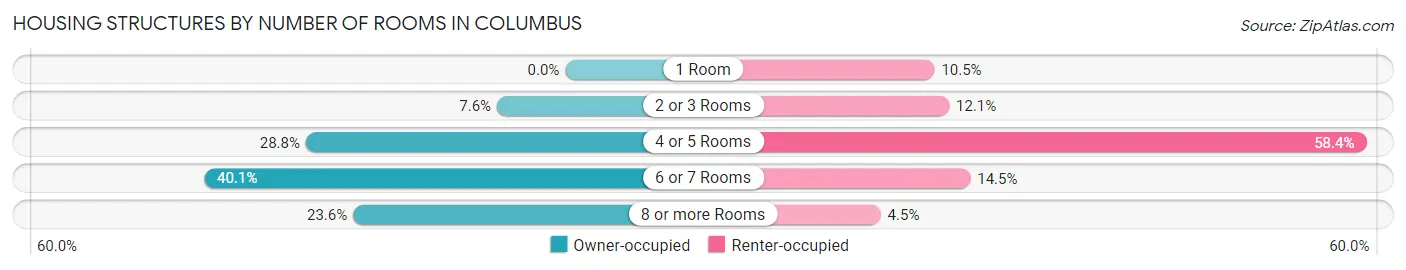
| Number of Rooms | Owner-occupied | Renter-occupied |
| 1 Room | 0 (0.0%) | 58 (10.5%) |
| 2 or 3 Rooms | 55 (7.6%) | 67 (12.1%) |
| 4 or 5 Rooms | 209 (28.8%) | 323 (58.4%) |
| 6 or 7 Rooms | 291 (40.1%) | 80 (14.5%) |
| 8 or more Rooms | 171 (23.5%) | 25 (4.5%) |
| Total | 726 (100.0%) | 553 (100.0%) |
Housing Structure by Heating Type in Columbus
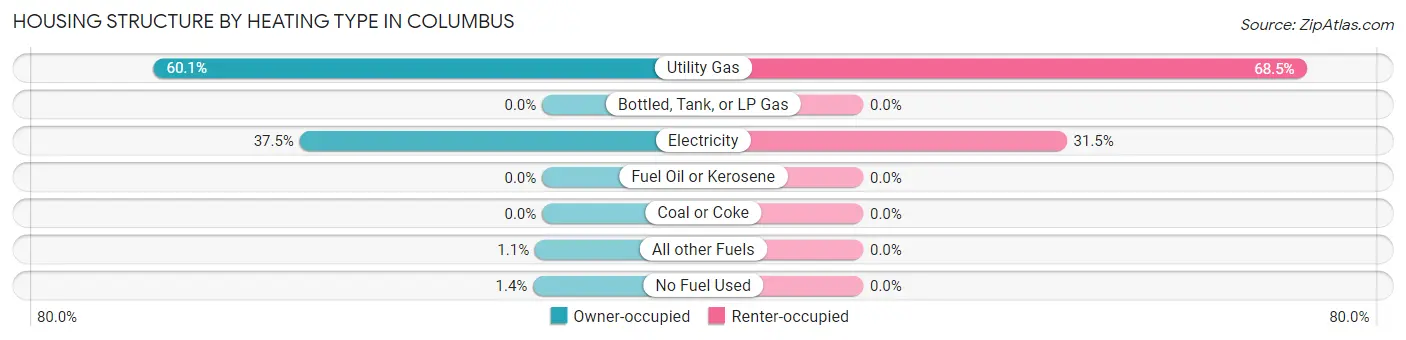
| Heating Type | Owner-occupied | Renter-occupied |
| Utility Gas | 436 (60.1%) | 379 (68.5%) |
| Bottled, Tank, or LP Gas | 0 (0.0%) | 0 (0.0%) |
| Electricity | 272 (37.5%) | 174 (31.5%) |
| Fuel Oil or Kerosene | 0 (0.0%) | 0 (0.0%) |
| Coal or Coke | 0 (0.0%) | 0 (0.0%) |
| All other Fuels | 8 (1.1%) | 0 (0.0%) |
| No Fuel Used | 10 (1.4%) | 0 (0.0%) |
| Total | 726 (100.0%) | 553 (100.0%) |
Household Vehicle Usage in Columbus
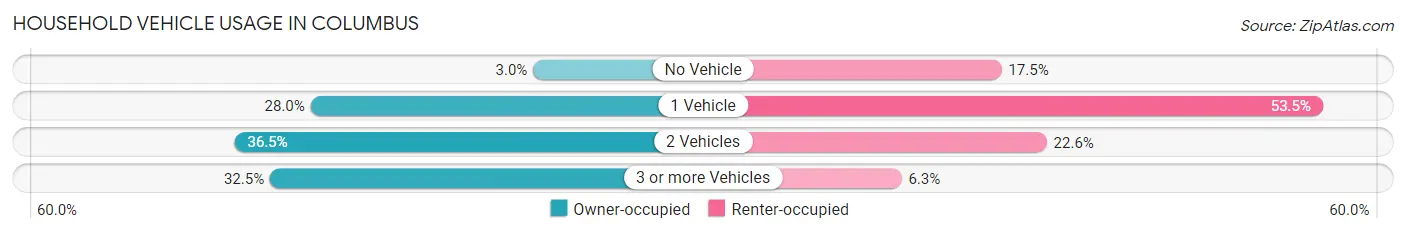
| Vehicles per Household | Owner-occupied | Renter-occupied |
| No Vehicle | 22 (3.0%) | 97 (17.5%) |
| 1 Vehicle | 203 (28.0%) | 296 (53.5%) |
| 2 Vehicles | 265 (36.5%) | 125 (22.6%) |
| 3 or more Vehicles | 236 (32.5%) | 35 (6.3%) |
| Total | 726 (100.0%) | 553 (100.0%) |
Real Estate & Mortgages in Columbus
Real Estate and Mortgage Overview in Columbus
| Characteristic | Without Mortgage | With Mortgage |
| Housing Units | 346 | 380 |
| Median Property Value | $51,000 | $102,400 |
| Median Household Income | $54,722 | $57 |
| Monthly Housing Costs | $407 | $0 |
| Real Estate Taxes | $845 | $0 |
Property Value by Mortgage Status in Columbus
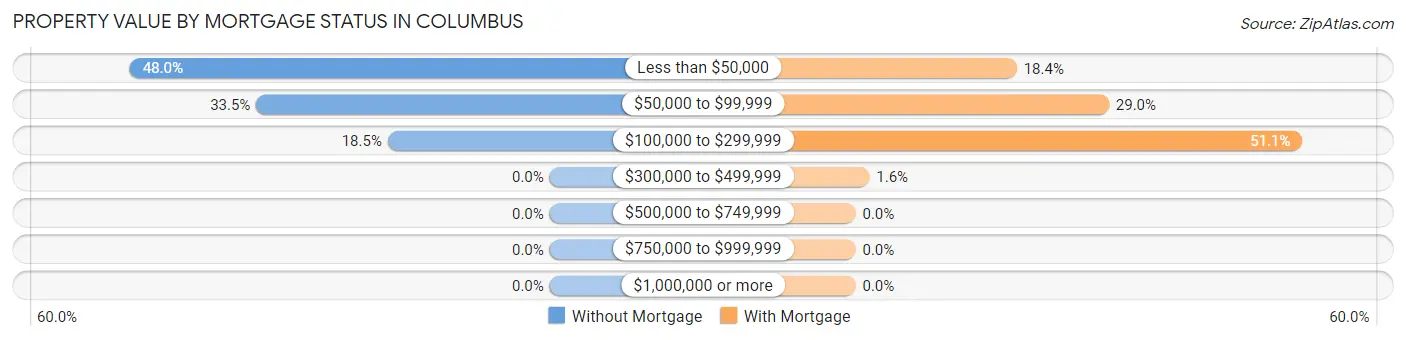
| Property Value | Without Mortgage | With Mortgage |
| Less than $50,000 | 166 (48.0%) | 70 (18.4%) |
| $50,000 to $99,999 | 116 (33.5%) | 110 (28.9%) |
| $100,000 to $299,999 | 64 (18.5%) | 194 (51.0%) |
| $300,000 to $499,999 | 0 (0.0%) | 6 (1.6%) |
| $500,000 to $749,999 | 0 (0.0%) | 0 (0.0%) |
| $750,000 to $999,999 | 0 (0.0%) | 0 (0.0%) |
| $1,000,000 or more | 0 (0.0%) | 0 (0.0%) |
| Total | 346 (100.0%) | 380 (100.0%) |
Household Income by Mortgage Status in Columbus
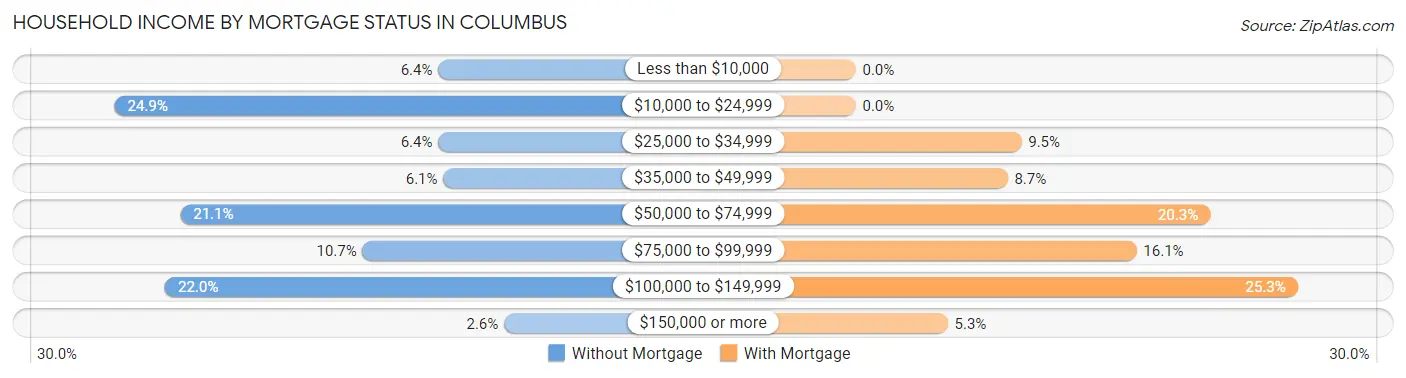
| Household Income | Without Mortgage | With Mortgage |
| Less than $10,000 | 22 (6.4%) | 0 (0.0%) |
| $10,000 to $24,999 | 86 (24.9%) | 0 (0.0%) |
| $25,000 to $34,999 | 22 (6.4%) | 36 (9.5%) |
| $35,000 to $49,999 | 21 (6.1%) | 33 (8.7%) |
| $50,000 to $74,999 | 73 (21.1%) | 77 (20.3%) |
| $75,000 to $99,999 | 37 (10.7%) | 61 (16.1%) |
| $100,000 to $149,999 | 76 (22.0%) | 96 (25.3%) |
| $150,000 or more | 9 (2.6%) | 20 (5.3%) |
| Total | 346 (100.0%) | 380 (100.0%) |
Property Value to Household Income Ratio in Columbus
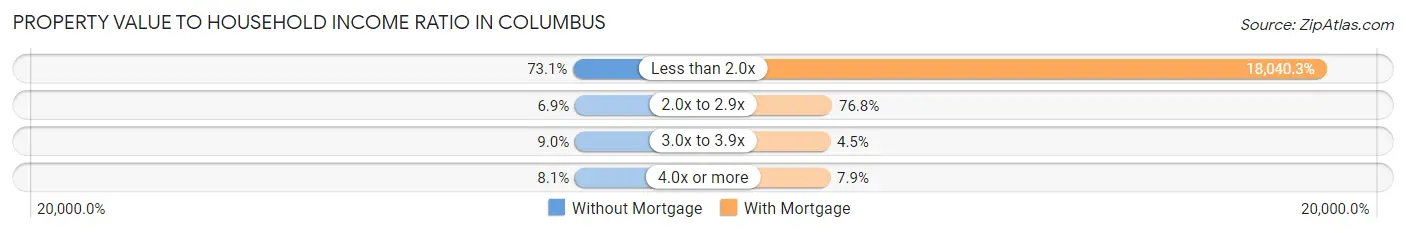
| Value-to-Income Ratio | Without Mortgage | With Mortgage |
| Less than 2.0x | 253 (73.1%) | 68,553 (18,040.3%) |
| 2.0x to 2.9x | 24 (6.9%) | 292 (76.8%) |
| 3.0x to 3.9x | 31 (9.0%) | 17 (4.5%) |
| 4.0x or more | 28 (8.1%) | 30 (7.9%) |
| Total | 346 (100.0%) | 380 (100.0%) |
Real Estate Taxes by Mortgage Status in Columbus
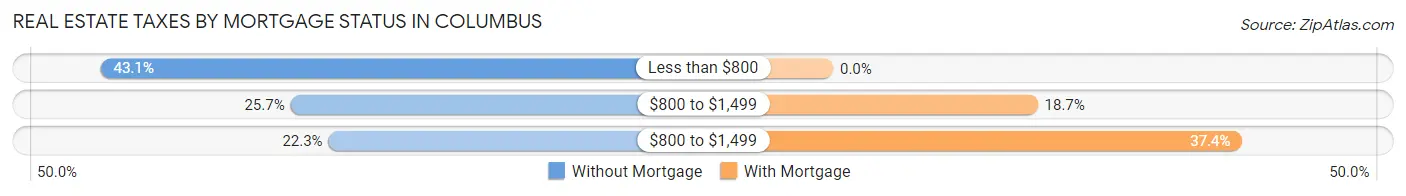
| Property Taxes | Without Mortgage | With Mortgage |
| Less than $800 | 149 (43.1%) | 0 (0.0%) |
| $800 to $1,499 | 89 (25.7%) | 71 (18.7%) |
| $800 to $1,499 | 77 (22.3%) | 142 (37.4%) |
| Total | 346 (100.0%) | 380 (100.0%) |
Health & Disability in Columbus
Health Insurance Coverage by Age in Columbus
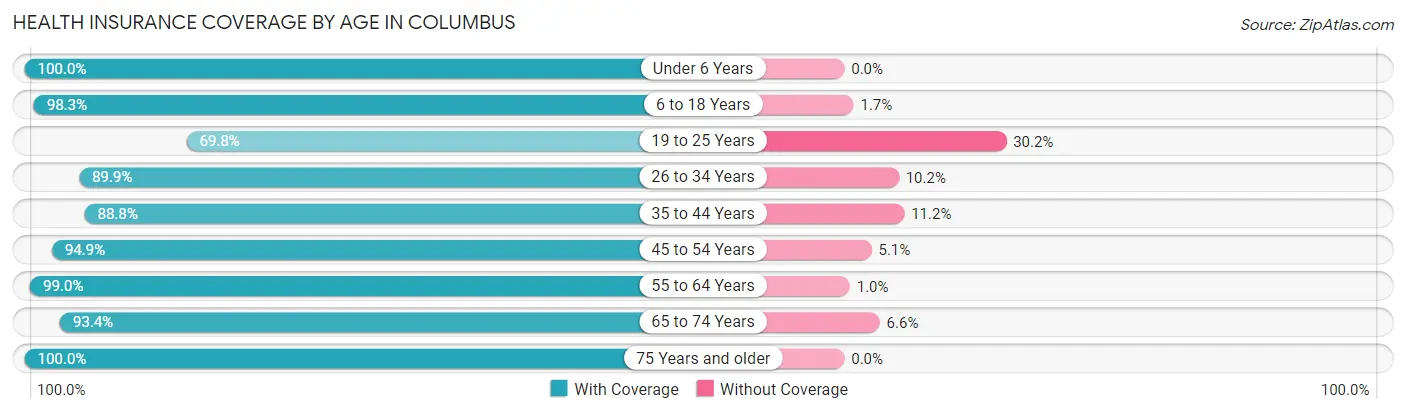
| Age Bracket | With Coverage | Without Coverage |
| Under 6 Years | 205 (100.0%) | 0 (0.0%) |
| 6 to 18 Years | 343 (98.3%) | 6 (1.7%) |
| 19 to 25 Years | 215 (69.8%) | 93 (30.2%) |
| 26 to 34 Years | 363 (89.8%) | 41 (10.2%) |
| 35 to 44 Years | 302 (88.8%) | 38 (11.2%) |
| 45 to 54 Years | 187 (94.9%) | 10 (5.1%) |
| 55 to 64 Years | 484 (99.0%) | 5 (1.0%) |
| 65 to 74 Years | 255 (93.4%) | 18 (6.6%) |
| 75 Years and older | 300 (100.0%) | 0 (0.0%) |
| Total | 2,654 (92.6%) | 211 (7.4%) |
Health Insurance Coverage by Citizenship Status in Columbus
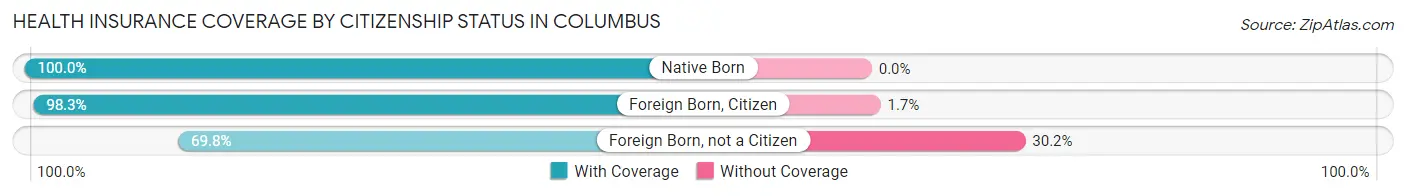
| Citizenship Status | With Coverage | Without Coverage |
| Native Born | 205 (100.0%) | 0 (0.0%) |
| Foreign Born, Citizen | 343 (98.3%) | 6 (1.7%) |
| Foreign Born, not a Citizen | 215 (69.8%) | 93 (30.2%) |
Health Insurance Coverage by Household Income in Columbus
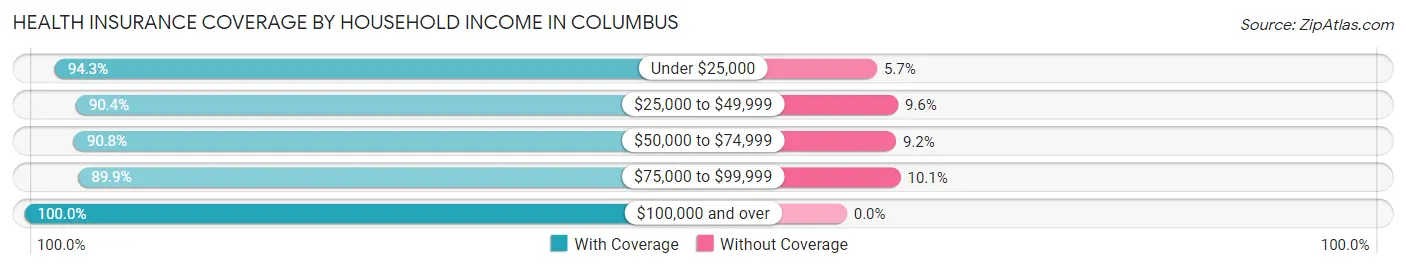
| Household Income | With Coverage | Without Coverage |
| Under $25,000 | 483 (94.3%) | 29 (5.7%) |
| $25,000 to $49,999 | 782 (90.4%) | 83 (9.6%) |
| $50,000 to $74,999 | 433 (90.8%) | 44 (9.2%) |
| $75,000 to $99,999 | 491 (89.9%) | 55 (10.1%) |
| $100,000 and over | 456 (100.0%) | 0 (0.0%) |
Public vs Private Health Insurance Coverage by Age in Columbus
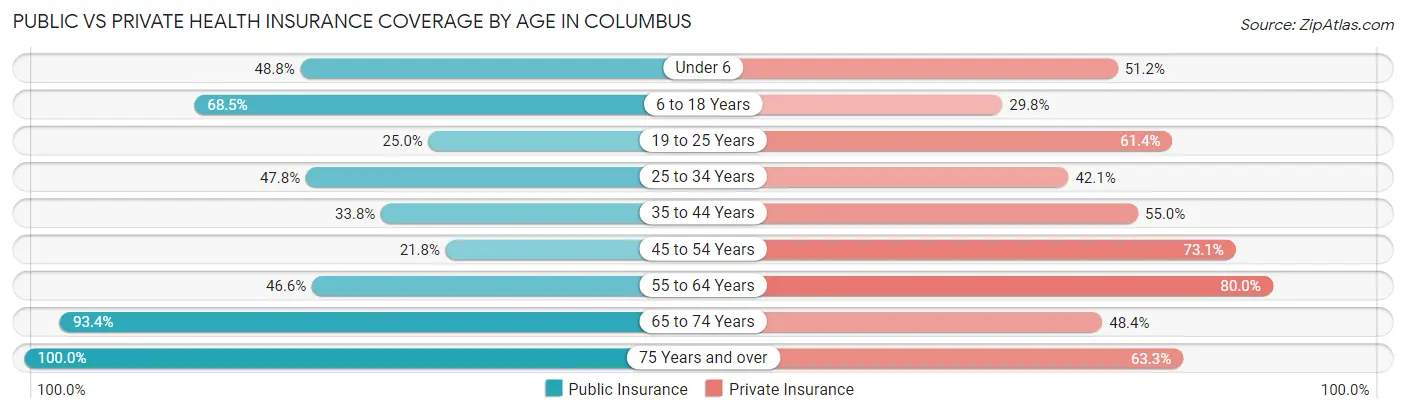
| Age Bracket | Public Insurance | Private Insurance |
| Under 6 | 100 (48.8%) | 105 (51.2%) |
| 6 to 18 Years | 239 (68.5%) | 104 (29.8%) |
| 19 to 25 Years | 77 (25.0%) | 189 (61.4%) |
| 25 to 34 Years | 193 (47.8%) | 170 (42.1%) |
| 35 to 44 Years | 115 (33.8%) | 187 (55.0%) |
| 45 to 54 Years | 43 (21.8%) | 144 (73.1%) |
| 55 to 64 Years | 228 (46.6%) | 391 (80.0%) |
| 65 to 74 Years | 255 (93.4%) | 132 (48.3%) |
| 75 Years and over | 300 (100.0%) | 190 (63.3%) |
| Total | 1,550 (54.1%) | 1,612 (56.3%) |
Disability Status by Sex by Age in Columbus
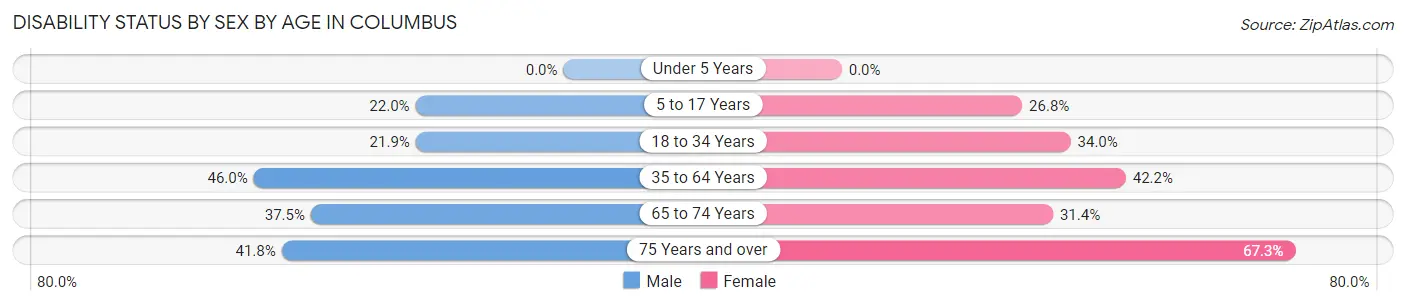
| Age Bracket | Male | Female |
| Under 5 Years | 0 (0.0%) | 0 (0.0%) |
| 5 to 17 Years | 38 (22.0%) | 49 (26.8%) |
| 18 to 34 Years | 93 (21.9%) | 105 (34.0%) |
| 35 to 64 Years | 184 (46.0%) | 264 (42.2%) |
| 65 to 74 Years | 39 (37.5%) | 53 (31.4%) |
| 75 Years and over | 41 (41.8%) | 136 (67.3%) |
Disability Class by Sex by Age in Columbus
Disability Class: Hearing Difficulty
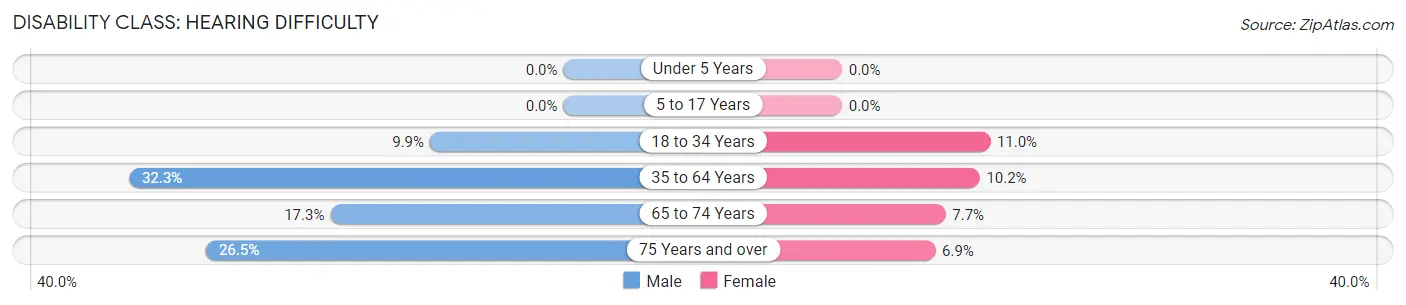
| Age Bracket | Male | Female |
| Under 5 Years | 0 (0.0%) | 0 (0.0%) |
| 5 to 17 Years | 0 (0.0%) | 0 (0.0%) |
| 18 to 34 Years | 42 (9.9%) | 34 (11.0%) |
| 35 to 64 Years | 129 (32.3%) | 64 (10.2%) |
| 65 to 74 Years | 18 (17.3%) | 13 (7.7%) |
| 75 Years and over | 26 (26.5%) | 14 (6.9%) |
Disability Class: Vision Difficulty
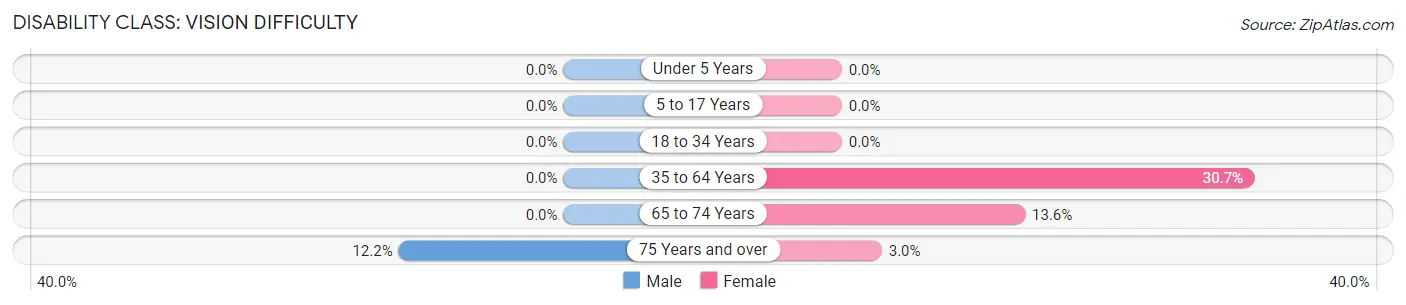
| Age Bracket | Male | Female |
| Under 5 Years | 0 (0.0%) | 0 (0.0%) |
| 5 to 17 Years | 0 (0.0%) | 0 (0.0%) |
| 18 to 34 Years | 0 (0.0%) | 0 (0.0%) |
| 35 to 64 Years | 0 (0.0%) | 192 (30.7%) |
| 65 to 74 Years | 0 (0.0%) | 23 (13.6%) |
| 75 Years and over | 12 (12.2%) | 6 (3.0%) |
Disability Class: Cognitive Difficulty
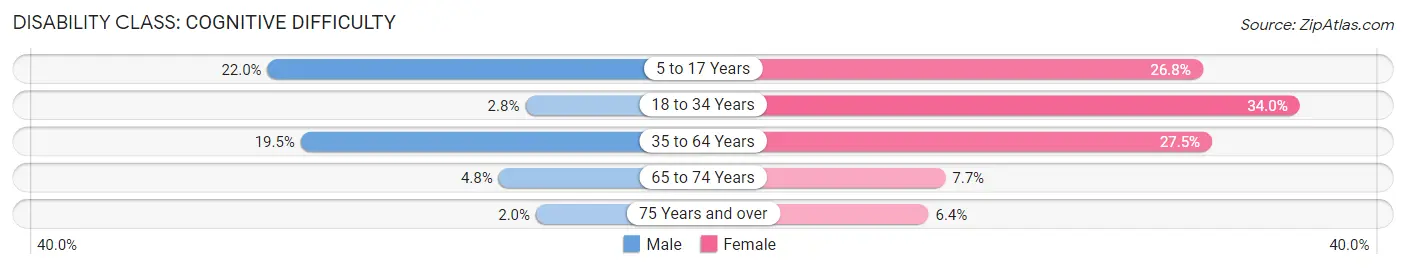
| Age Bracket | Male | Female |
| 5 to 17 Years | 38 (22.0%) | 49 (26.8%) |
| 18 to 34 Years | 12 (2.8%) | 105 (34.0%) |
| 35 to 64 Years | 78 (19.5%) | 172 (27.5%) |
| 65 to 74 Years | 5 (4.8%) | 13 (7.7%) |
| 75 Years and over | 2 (2.0%) | 13 (6.4%) |
Disability Class: Ambulatory Difficulty
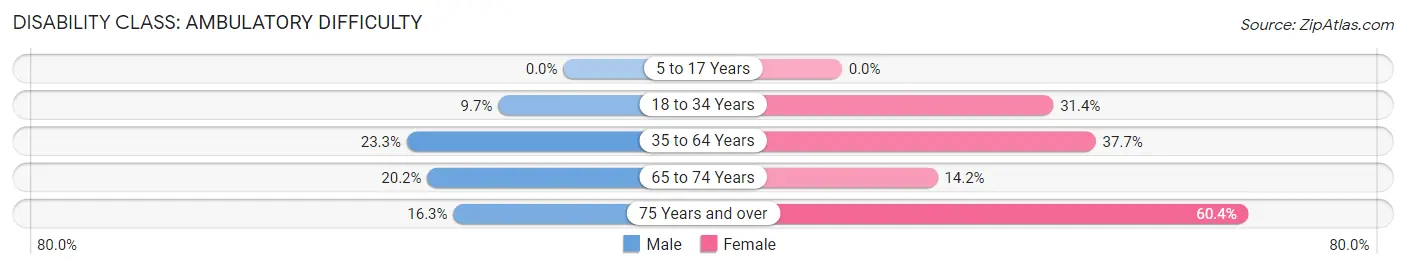
| Age Bracket | Male | Female |
| 5 to 17 Years | 0 (0.0%) | 0 (0.0%) |
| 18 to 34 Years | 41 (9.7%) | 97 (31.4%) |
| 35 to 64 Years | 93 (23.3%) | 236 (37.7%) |
| 65 to 74 Years | 21 (20.2%) | 24 (14.2%) |
| 75 Years and over | 16 (16.3%) | 122 (60.4%) |
Disability Class: Self-Care Difficulty
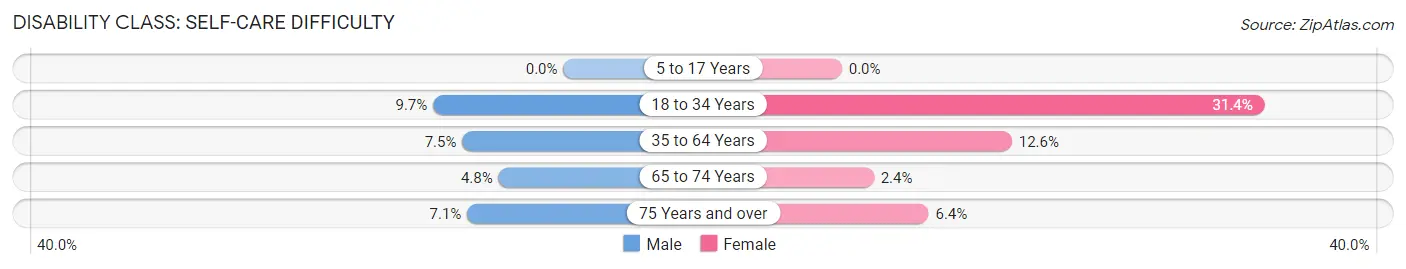
| Age Bracket | Male | Female |
| 5 to 17 Years | 0 (0.0%) | 0 (0.0%) |
| 18 to 34 Years | 41 (9.7%) | 97 (31.4%) |
| 35 to 64 Years | 30 (7.5%) | 79 (12.6%) |
| 65 to 74 Years | 5 (4.8%) | 4 (2.4%) |
| 75 Years and over | 7 (7.1%) | 13 (6.4%) |
Technology Access in Columbus
Computing Device Access in Columbus
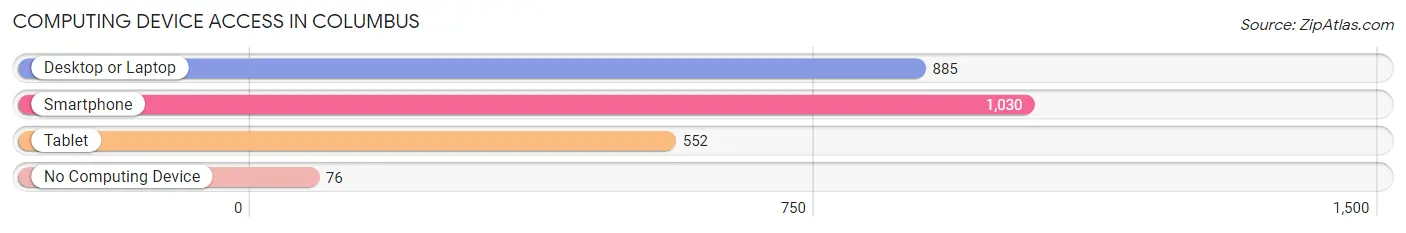
| Device Type | # Households | % Households |
| Desktop or Laptop | 885 | 69.2% |
| Smartphone | 1,030 | 80.5% |
| Tablet | 552 | 43.2% |
| No Computing Device | 76 | 5.9% |
| Total | 1,279 | 100.0% |
Internet Access in Columbus
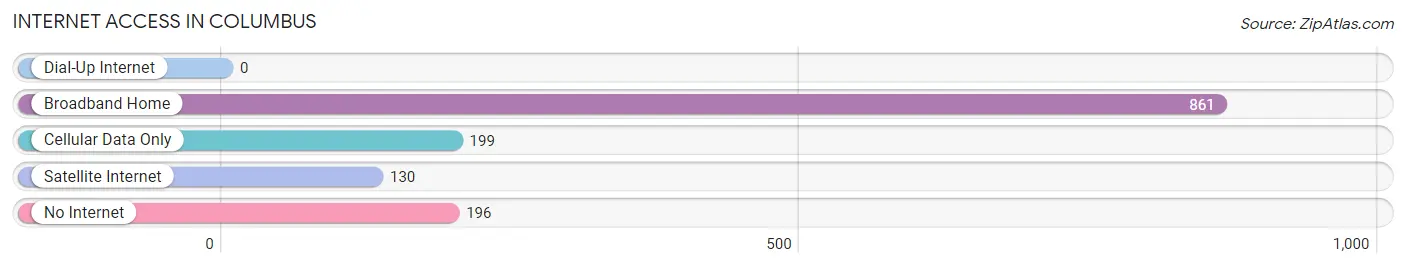
| Internet Type | # Households | % Households |
| Dial-Up Internet | 0 | 0.0% |
| Broadband Home | 861 | 67.3% |
| Cellular Data Only | 199 | 15.6% |
| Satellite Internet | 130 | 10.2% |
| No Internet | 196 | 15.3% |
| Total | 1,279 | 100.0% |
Columbus Summary
Columbus, Kansas is a small town located in Cherokee County in the southeastern corner of the state. The town was founded in 1867 and is named after Christopher Columbus. It is located on the banks of the Spring River and is home to a population of just over 1,000 people.
History
The area that is now Columbus was originally inhabited by the Osage Indians. The first white settlers arrived in the area in the late 1840s and the town was officially founded in 1867. The town was named after Christopher Columbus and was originally a trading post for the Osage Indians.
In 1871, the first post office was established in Columbus and the town was incorporated in 1872. The first school was built in 1873 and the first newspaper, the Columbus Courier, was established in 1875.
In the late 19th century, Columbus was a thriving agricultural community. The town was home to several businesses, including a flour mill, a sawmill, a blacksmith shop, and a general store.
Geography
Columbus is located in the southeastern corner of Kansas, in Cherokee County. It is situated on the banks of the Spring River and is surrounded by rolling hills and farmland. The town is located about 30 miles from the Oklahoma border and about 50 miles from the Missouri border.
The climate in Columbus is generally mild, with hot summers and cold winters. The average temperature in the summer is around 80 degrees Fahrenheit and the average temperature in the winter is around 40 degrees Fahrenheit.
Economy
The economy of Columbus is largely based on agriculture. The town is home to several farms and ranches, as well as a few small businesses. The town is also home to a few manufacturing companies, including a furniture factory and a plastics factory.
The town is also home to a few tourist attractions, including the Cherokee County Historical Museum and the Spring River Zoo.
Demographics
As of the 2010 census, the population of Columbus was 1,039. The racial makeup of the town was 95.3% White, 0.9% African American, 0.7% Native American, 0.3% Asian, 0.1% Pacific Islander, and 2.7% from other races. Hispanic or Latino of any race were 4.2% of the population.
The median household income in Columbus was $35,938 and the median family income was $41,250. The per capita income in the town was $17,845. About 16.2% of the population was below the poverty line.
Conclusion
Columbus, Kansas is a small town located in Cherokee County in the southeastern corner of the state. The town was founded in 1867 and is named after Christopher Columbus. It is located on the banks of the Spring River and is home to a population of just over 1,000 people. The economy of Columbus is largely based on agriculture, with a few small businesses and manufacturing companies. The town is also home to a few tourist attractions, including the Cherokee County Historical Museum and the Spring River Zoo. The population of Columbus is largely white, with a small percentage of African American, Native American, Asian, and Pacific Islander residents. The median household income in Columbus is slightly below the national average.
Common Questions
What is Per Capita Income in Columbus?
Per Capita income in Columbus is $24,807.
What is the Median Family Income in Columbus?
Median Family Income in Columbus is $53,938.
What is the Median Household income in Columbus?
Median Household Income in Columbus is $39,777.
What is Income or Wage Gap in Columbus?
Income or Wage Gap in Columbus is 1.8%.
Women in Columbus earn 98.2 cents for every dollar earned by a man.
What is Family Income Deficit in Columbus?
Family Income Deficit in Columbus is $7,982.
Families that are below poverty line in Columbus earn $7,982 less on average than the poverty threshold level.
What is Inequality or Gini Index in Columbus?
Inequality or Gini Index in Columbus is 0.46.
What is the Total Population of Columbus?
Total Population of Columbus is 2,922.
What is the Total Male Population of Columbus?
Total Male Population of Columbus is 1,273.
What is the Total Female Population of Columbus?
Total Female Population of Columbus is 1,649.
What is the Ratio of Males per 100 Females in Columbus?
There are 77.20 Males per 100 Females in Columbus.
What is the Ratio of Females per 100 Males in Columbus?
There are 129.54 Females per 100 Males in Columbus.
What is the Median Population Age in Columbus?
Median Population Age in Columbus is 40.9 Years.
What is the Average Family Size in Columbus
Average Family Size in Columbus is 3.0 People.
What is the Average Household Size in Columbus
Average Household Size in Columbus is 2.2 People.
How Large is the Labor Force in Columbus?
There are 1,189 People in the Labor Forcein in Columbus.
What is the Percentage of People in the Labor Force in Columbus?
48.6% of People are in the Labor Force in Columbus.
What is the Unemployment Rate in Columbus?
Unemployment Rate in Columbus is 1.4%.