Barnes, KS Map & Demographics
Barnes Map
Barnes Overview
$30,941
PER CAPITA INCOME
$52,500
AVG FAMILY INCOME
$37,500
AVG HOUSEHOLD INCOME
30.1%
WAGE / INCOME GAP [ % ]
69.9¢/ $1
WAGE / INCOME GAP [ $ ]
0.54
INEQUALITY / GINI INDEX
150
TOTAL POPULATION
82
MALE POPULATION
68
FEMALE POPULATION
120.59
MALES / 100 FEMALES
82.93
FEMALES / 100 MALES
54.1
MEDIAN AGE
2.9
AVG FAMILY SIZE
2.0
AVG HOUSEHOLD SIZE
72
LABOR FORCE [ PEOPLE ]
54.1%
PERCENT IN LABOR FORCE
Barnes Zip Codes
Barnes Area Codes
Income in Barnes
Income Overview in Barnes
Per Capita Income in Barnes is $30,941, while median incomes of families and households are $52,500 and $37,500 respectively.
| Characteristic | Number | Measure |
| Per Capita Income | 150 | $30,941 |
| Median Family Income | 34 | $52,500 |
| Mean Family Income | 34 | $87,185 |
| Median Household Income | 76 | $37,500 |
| Mean Household Income | 76 | $59,911 |
| Income Deficit | 34 | $0 |
| Wage / Income Gap (%) | 150 | 30.07% |
| Wage / Income Gap ($) | 150 | 69.93¢ per $1 |
| Gini / Inequality Index | 150 | 0.54 |
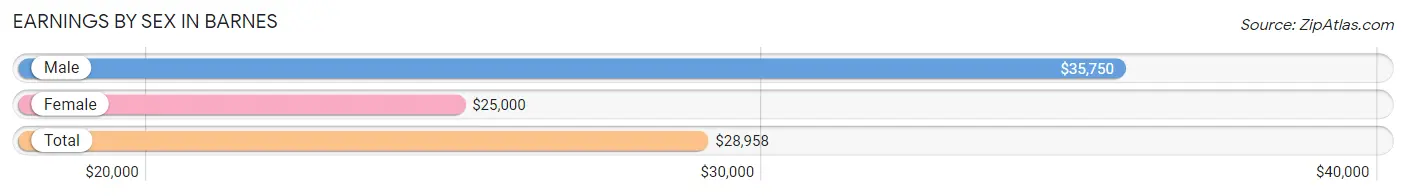
Earnings by Sex in Barnes
Average Earnings in Barnes are $28,958, $35,750 for men and $25,000 for women, a difference of 30.1%.
| Sex | Number | Average Earnings |
| Male | 49 (62.0%) | $35,750 |
| Female | 30 (38.0%) | $25,000 |
| Total | 79 (100.0%) | $28,958 |
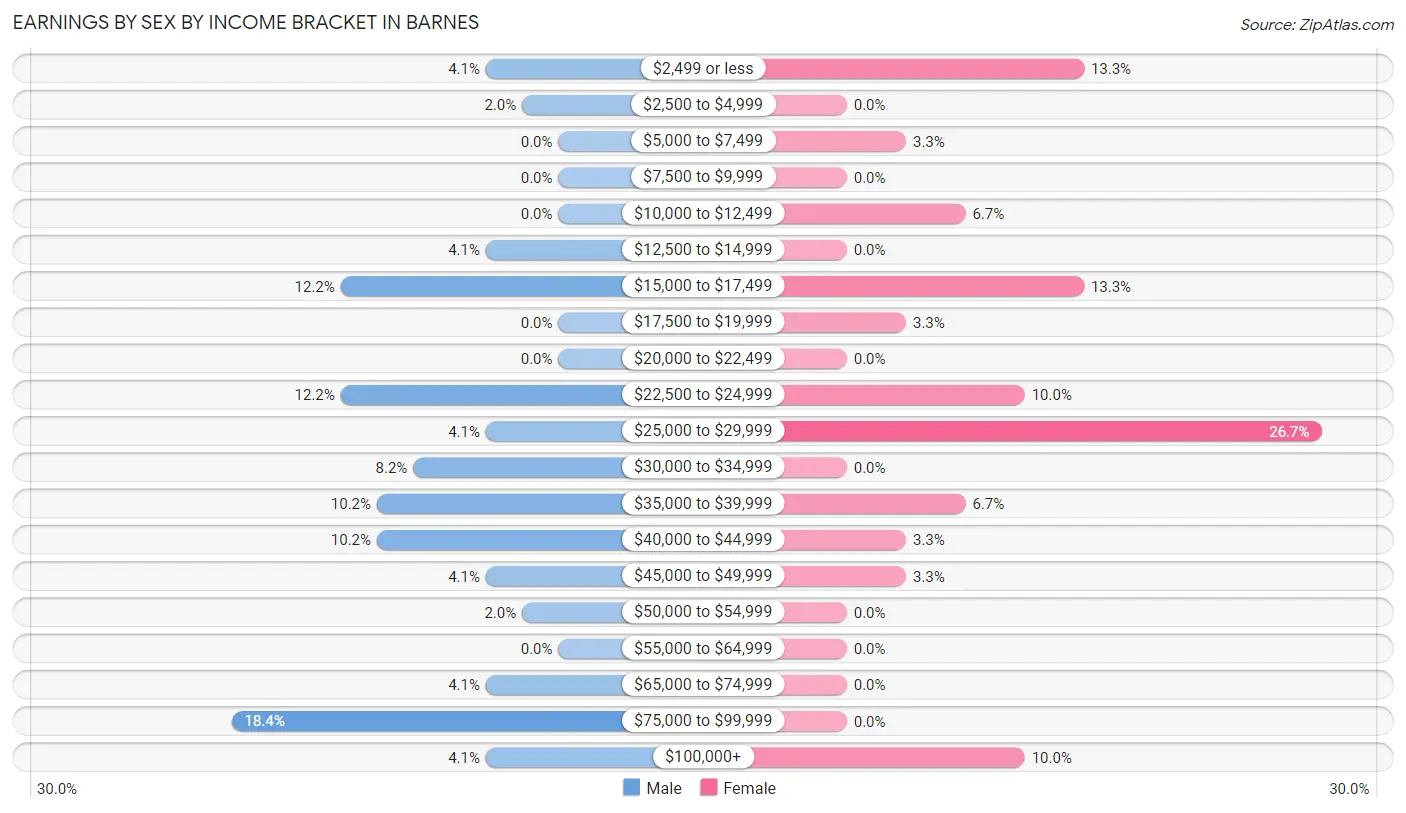
Earnings by Sex by Income Bracket in Barnes
The most common earnings brackets in Barnes are $75,000 to $99,999 for men (9 | 18.4%) and $25,000 to $29,999 for women (8 | 26.7%).
| Income | Male | Female |
| $2,499 or less | 2 (4.1%) | 4 (13.3%) |
| $2,500 to $4,999 | 1 (2.0%) | 0 (0.0%) |
| $5,000 to $7,499 | 0 (0.0%) | 1 (3.3%) |
| $7,500 to $9,999 | 0 (0.0%) | 0 (0.0%) |
| $10,000 to $12,499 | 0 (0.0%) | 2 (6.7%) |
| $12,500 to $14,999 | 2 (4.1%) | 0 (0.0%) |
| $15,000 to $17,499 | 6 (12.2%) | 4 (13.3%) |
| $17,500 to $19,999 | 0 (0.0%) | 1 (3.3%) |
| $20,000 to $22,499 | 0 (0.0%) | 0 (0.0%) |
| $22,500 to $24,999 | 6 (12.2%) | 3 (10.0%) |
| $25,000 to $29,999 | 2 (4.1%) | 8 (26.7%) |
| $30,000 to $34,999 | 4 (8.2%) | 0 (0.0%) |
| $35,000 to $39,999 | 5 (10.2%) | 2 (6.7%) |
| $40,000 to $44,999 | 5 (10.2%) | 1 (3.3%) |
| $45,000 to $49,999 | 2 (4.1%) | 1 (3.3%) |
| $50,000 to $54,999 | 1 (2.0%) | 0 (0.0%) |
| $55,000 to $64,999 | 0 (0.0%) | 0 (0.0%) |
| $65,000 to $74,999 | 2 (4.1%) | 0 (0.0%) |
| $75,000 to $99,999 | 9 (18.4%) | 0 (0.0%) |
| $100,000+ | 2 (4.1%) | 3 (10.0%) |
| Total | 49 (100.0%) | 30 (100.0%) |
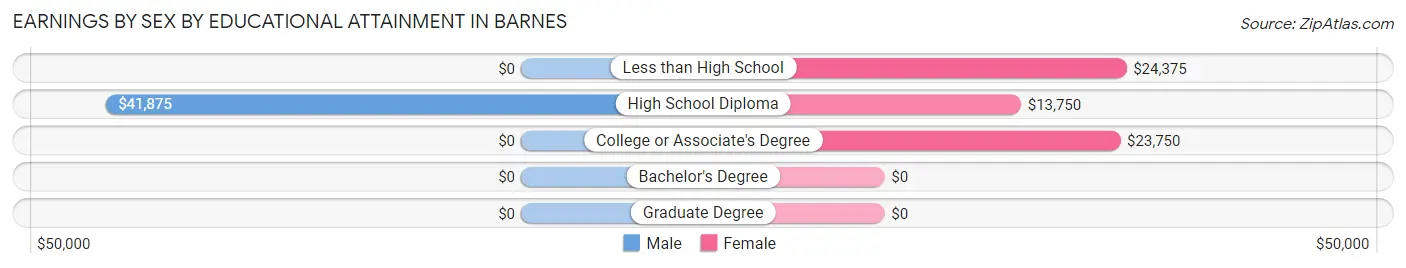
Earnings by Sex by Educational Attainment in Barnes
Average earnings in Barnes are $36,875 for men and $22,917 for women, a difference of 37.9%. Men with an educational attainment of high school diploma enjoy the highest average annual earnings of $41,875, while those with high school diploma education earn the least with $41,875. Women with an educational attainment of less than high school earn the most with the average annual earnings of $24,375, while those with high school diploma education have the smallest earnings of $13,750.
| Educational Attainment | Male Income | Female Income |
| Less than High School | - | - |
| High School Diploma | $41,875 | $13,750 |
| College or Associate's Degree | - | - |
| Bachelor's Degree | - | - |
| Graduate Degree | - | - |
| Total | $36,875 | $22,917 |
Family Income in Barnes
Family Income Brackets in Barnes
According to the Barnes family income data, there are 11 families falling into the $50,000 to $74,999 income range, which is the most common income bracket and makes up 32.4% of all families. Conversely, the $10,000 to $14,999 income bracket is the least frequent group with only 1 families (2.9%) belonging to this category.
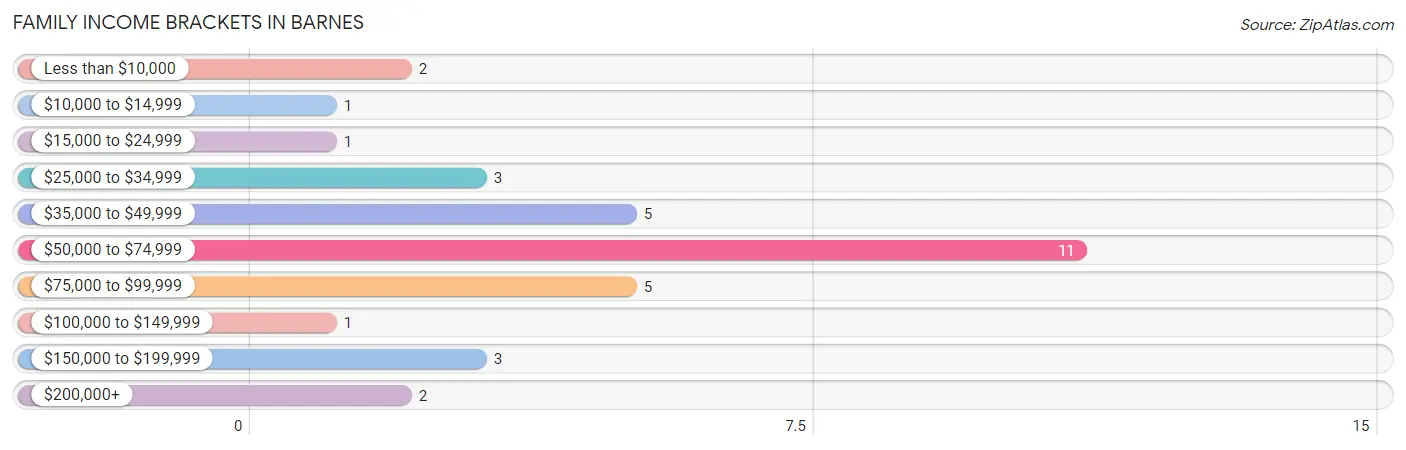
| Income Bracket | # Families | % Families |
| Less than $10,000 | 2 | 5.9% |
| $10,000 to $14,999 | 1 | 2.9% |
| $15,000 to $24,999 | 1 | 2.9% |
| $25,000 to $34,999 | 3 | 8.8% |
| $35,000 to $49,999 | 5 | 14.7% |
| $50,000 to $74,999 | 11 | 32.4% |
| $75,000 to $99,999 | 5 | 14.7% |
| $100,000 to $149,999 | 1 | 2.9% |
| $150,000 to $199,999 | 3 | 8.8% |
| $200,000+ | 2 | 5.9% |
Family Income by Famaliy Size in Barnes
2-person families (20 | 58.8%) account for the highest median family income in Barnes with $53,750 per family, while 2-person families (20 | 58.8%) have the highest median income of $26,875 per family member.
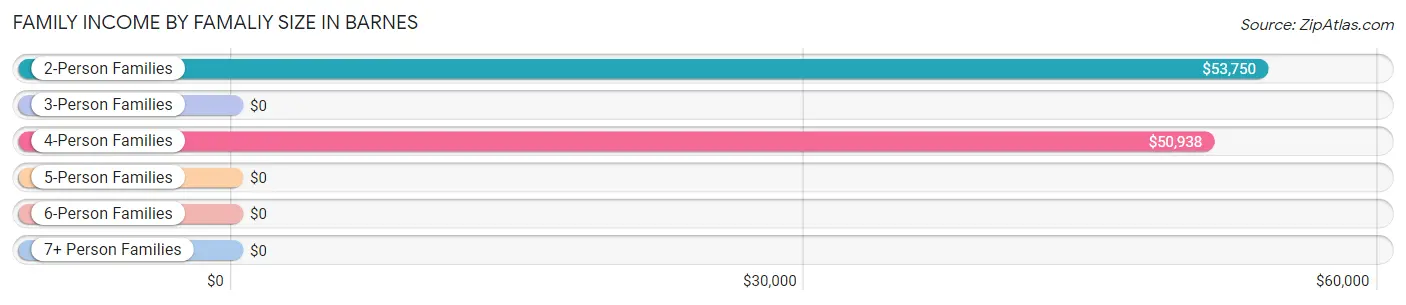
| Income Bracket | # Families | Median Income |
| 2-Person Families | 20 (58.8%) | $53,750 |
| 3-Person Families | 3 (8.8%) | $0 |
| 4-Person Families | 7 (20.6%) | $50,938 |
| 5-Person Families | 4 (11.8%) | $0 |
| 6-Person Families | 0 (0.0%) | $0 |
| 7+ Person Families | 0 (0.0%) | $0 |
| Total | 34 (100.0%) | $52,500 |
Family Income by Number of Earners in Barnes
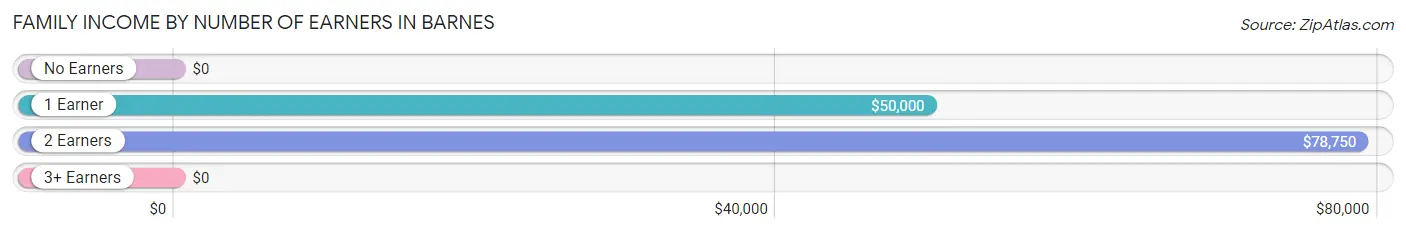
| Number of Earners | # Families | Median Income |
| No Earners | 8 (23.5%) | $0 |
| 1 Earner | 12 (35.3%) | $50,000 |
| 2 Earners | 14 (41.2%) | $78,750 |
| 3+ Earners | 0 (0.0%) | $0 |
| Total | 34 (100.0%) | $52,500 |
Household Income in Barnes
Household Income Brackets in Barnes
With 20 households falling in the category, the $15,000 to $24,999 income range is the most frequent in Barnes, accounting for 26.3% of all households. In contrast, only 2 households (2.6%) fall into the $200,000+ income bracket, making it the least populous group.
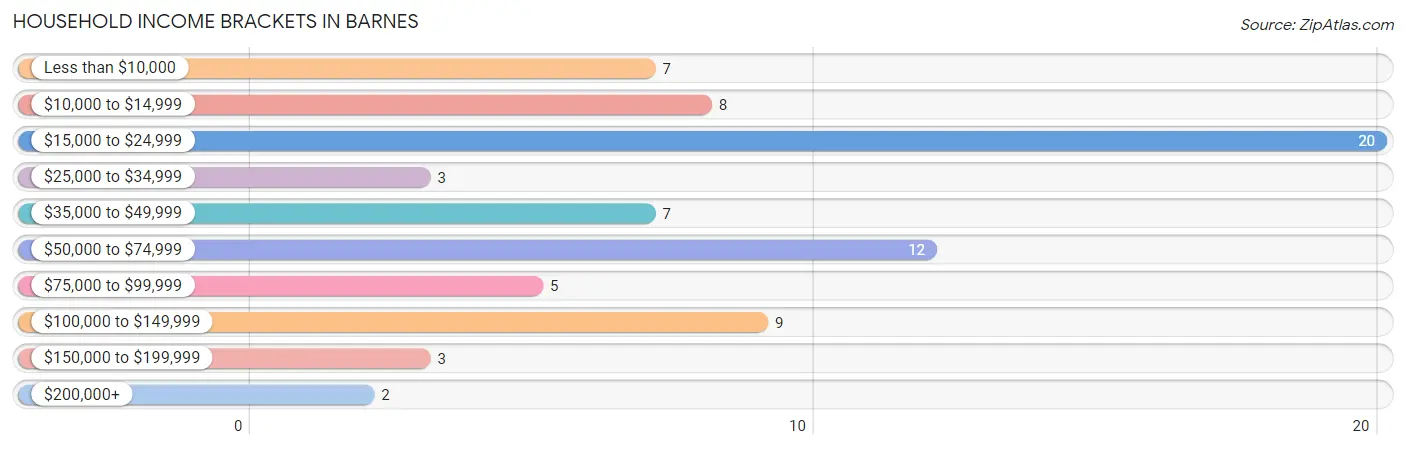
| Income Bracket | # Households | % Households |
| Less than $10,000 | 7 | 9.2% |
| $10,000 to $14,999 | 8 | 10.5% |
| $15,000 to $24,999 | 20 | 26.3% |
| $25,000 to $34,999 | 3 | 3.9% |
| $35,000 to $49,999 | 7 | 9.2% |
| $50,000 to $74,999 | 12 | 15.8% |
| $75,000 to $99,999 | 5 | 6.6% |
| $100,000 to $149,999 | 9 | 11.8% |
| $150,000 to $199,999 | 3 | 3.9% |
| $200,000+ | 2 | 2.6% |
Household Income by Householder Age in Barnes
The median household income in Barnes is $37,500, with the highest median household income of $71,250 found in the 25 to 44 years age bracket for the primary householder. A total of 12 households (15.8%) fall into this category. Meanwhile, the 15 to 24 years age bracket for the primary householder has the lowest median household income of $0, with 11 households (14.5%) in this group.
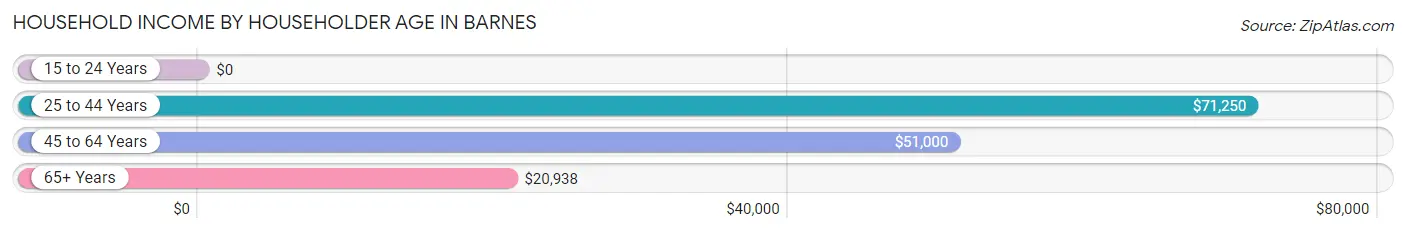
| Income Bracket | # Households | Median Income |
| 15 to 24 Years | 11 (14.5%) | $0 |
| 25 to 44 Years | 12 (15.8%) | $71,250 |
| 45 to 64 Years | 20 (26.3%) | $51,000 |
| 65+ Years | 33 (43.4%) | $20,938 |
| Total | 76 (100.0%) | $37,500 |
Poverty in Barnes
Income Below Poverty by Sex and Age in Barnes
With 3.7% poverty level for males and 17.6% for females among the residents of Barnes, 75 year old and over males and 75 year old and over females are the most vulnerable to poverty, with 2 males (40.0%) and 12 females (52.2%) in their respective age groups living below the poverty level.
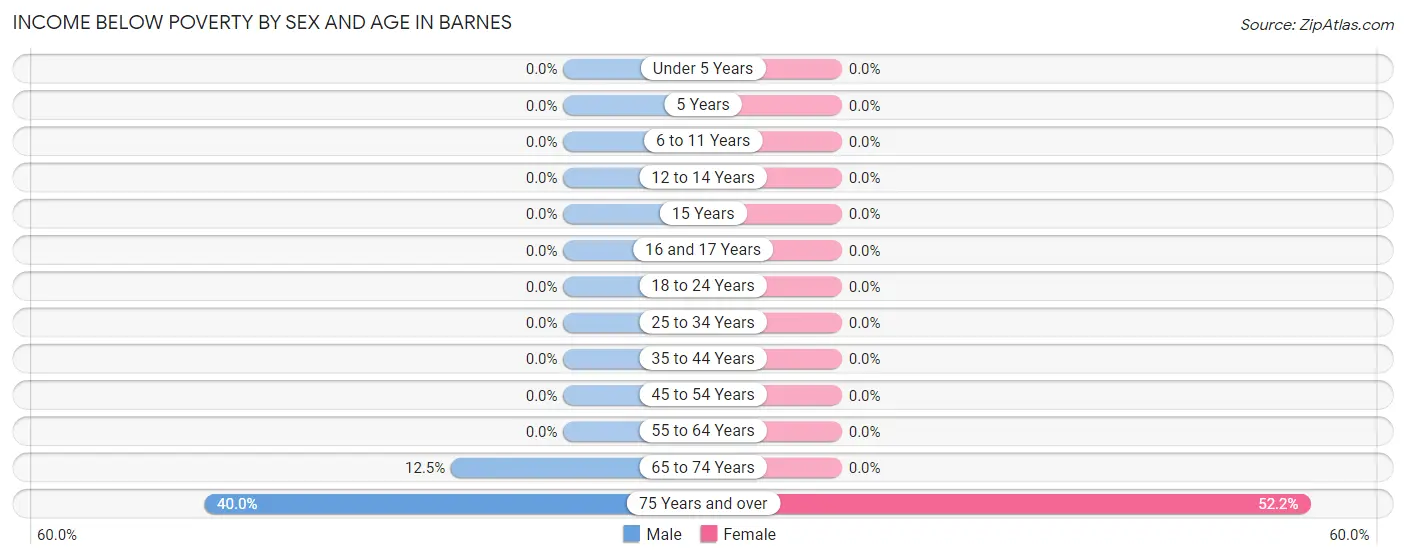
| Age Bracket | Male | Female |
| Under 5 Years | 0 (0.0%) | 0 (0.0%) |
| 5 Years | 0 (0.0%) | 0 (0.0%) |
| 6 to 11 Years | 0 (0.0%) | 0 (0.0%) |
| 12 to 14 Years | 0 (0.0%) | 0 (0.0%) |
| 15 Years | 0 (0.0%) | 0 (0.0%) |
| 16 and 17 Years | 0 (0.0%) | 0 (0.0%) |
| 18 to 24 Years | 0 (0.0%) | 0 (0.0%) |
| 25 to 34 Years | 0 (0.0%) | 0 (0.0%) |
| 35 to 44 Years | 0 (0.0%) | 0 (0.0%) |
| 45 to 54 Years | 0 (0.0%) | 0 (0.0%) |
| 55 to 64 Years | 0 (0.0%) | 0 (0.0%) |
| 65 to 74 Years | 1 (12.5%) | 0 (0.0%) |
| 75 Years and over | 2 (40.0%) | 12 (52.2%) |
| Total | 3 (3.7%) | 12 (17.6%) |
Income Above Poverty by Sex and Age in Barnes
According to the poverty statistics in Barnes, males aged under 5 years and females aged 6 to 11 years are the age groups that are most secure financially, with 100.0% of males and 100.0% of females in these age groups living above the poverty line.
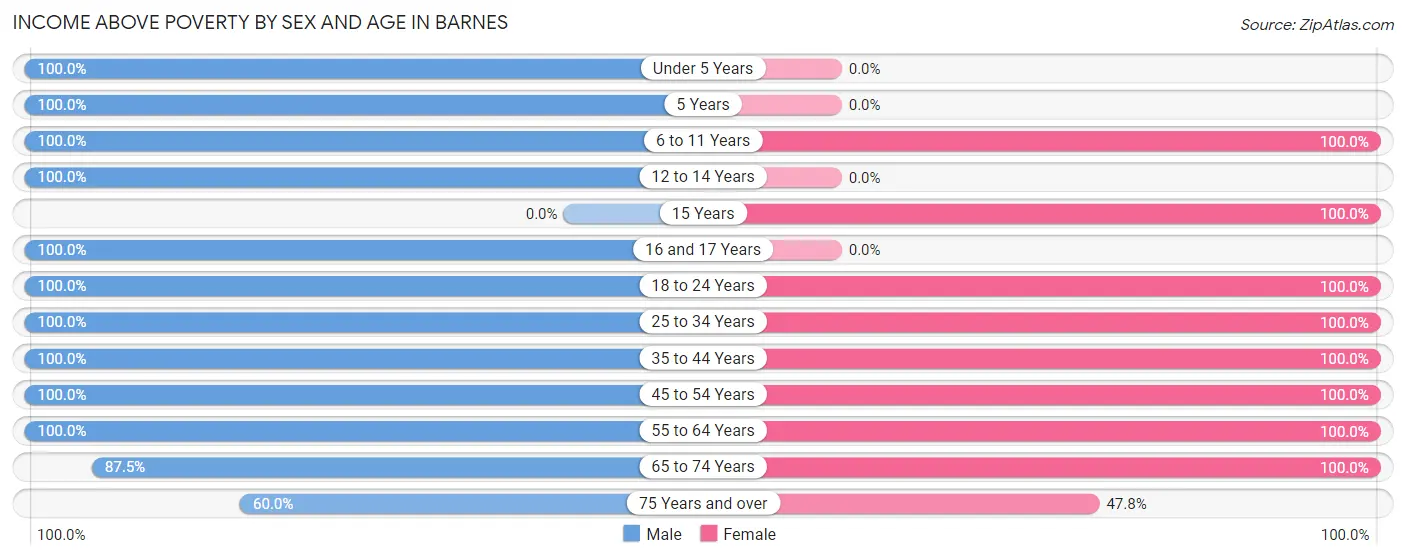
| Age Bracket | Male | Female |
| Under 5 Years | 6 (100.0%) | 0 (0.0%) |
| 5 Years | 2 (100.0%) | 0 (0.0%) |
| 6 to 11 Years | 5 (100.0%) | 2 (100.0%) |
| 12 to 14 Years | 1 (100.0%) | 0 (0.0%) |
| 15 Years | 0 (0.0%) | 1 (100.0%) |
| 16 and 17 Years | 3 (100.0%) | 0 (0.0%) |
| 18 to 24 Years | 16 (100.0%) | 7 (100.0%) |
| 25 to 34 Years | 3 (100.0%) | 5 (100.0%) |
| 35 to 44 Years | 9 (100.0%) | 5 (100.0%) |
| 45 to 54 Years | 11 (100.0%) | 8 (100.0%) |
| 55 to 64 Years | 13 (100.0%) | 8 (100.0%) |
| 65 to 74 Years | 7 (87.5%) | 9 (100.0%) |
| 75 Years and over | 3 (60.0%) | 11 (47.8%) |
| Total | 79 (96.3%) | 56 (82.4%) |
Income Below Poverty Among Married-Couple Families in Barnes
The poverty statistics for married-couple families in Barnes show that 9.4% or 3 of the total 32 families live below the poverty line. Families with no children have the highest poverty rate of 14.3%, comprising of 3 families. On the other hand, families with 1 or 2 children have the lowest poverty rate of 0.0%, which includes 0 families.
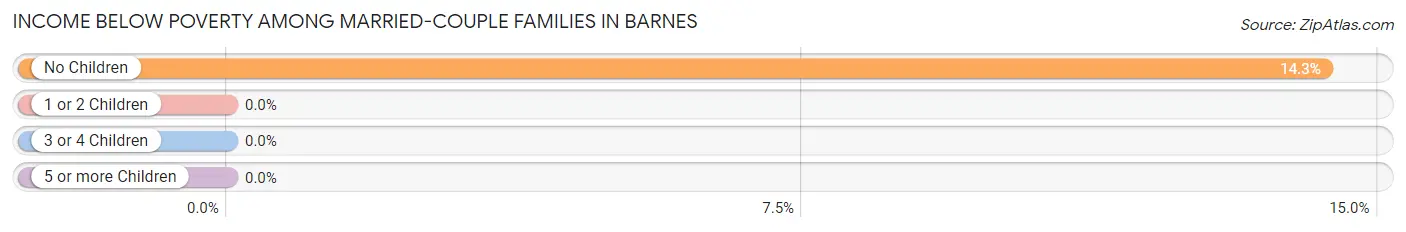
| Children | Above Poverty | Below Poverty |
| No Children | 18 (85.7%) | 3 (14.3%) |
| 1 or 2 Children | 8 (100.0%) | 0 (0.0%) |
| 3 or 4 Children | 3 (100.0%) | 0 (0.0%) |
| 5 or more Children | 0 (0.0%) | 0 (0.0%) |
| Total | 29 (90.6%) | 3 (9.4%) |
Income Below Poverty Among Single-Parent Households in Barnes
| Children | Single Father | Single Mother |
| No Children | 0 (0.0%) | 0 (0.0%) |
| 1 or 2 Children | 0 (0.0%) | 0 (0.0%) |
| 3 or 4 Children | 0 (0.0%) | 0 (0.0%) |
| 5 or more Children | 0 (0.0%) | 0 (0.0%) |
| Total | 0 (0.0%) | 0 (0.0%) |
Income Below Poverty Among Married-Couple vs Single-Parent Households in Barnes
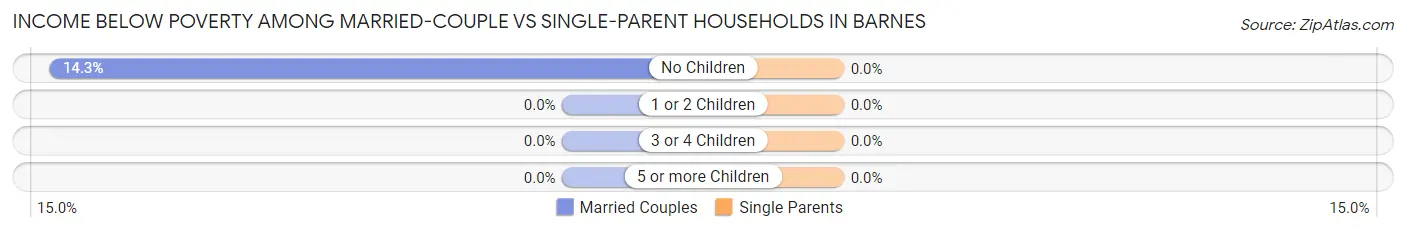
| Children | Married-Couple Families | Single-Parent Households |
| No Children | 3 (14.3%) | 0 (0.0%) |
| 1 or 2 Children | 0 (0.0%) | 0 (0.0%) |
| 3 or 4 Children | 0 (0.0%) | 0 (0.0%) |
| 5 or more Children | 0 (0.0%) | 0 (0.0%) |
| Total | 3 (9.4%) | 0 (0.0%) |
Race in Barnes
The most populous races in Barnes are White / Caucasian (144 | 96.0%), Hispanic or Latino (15 | 10.0%), and Asian (4 | 2.7%).
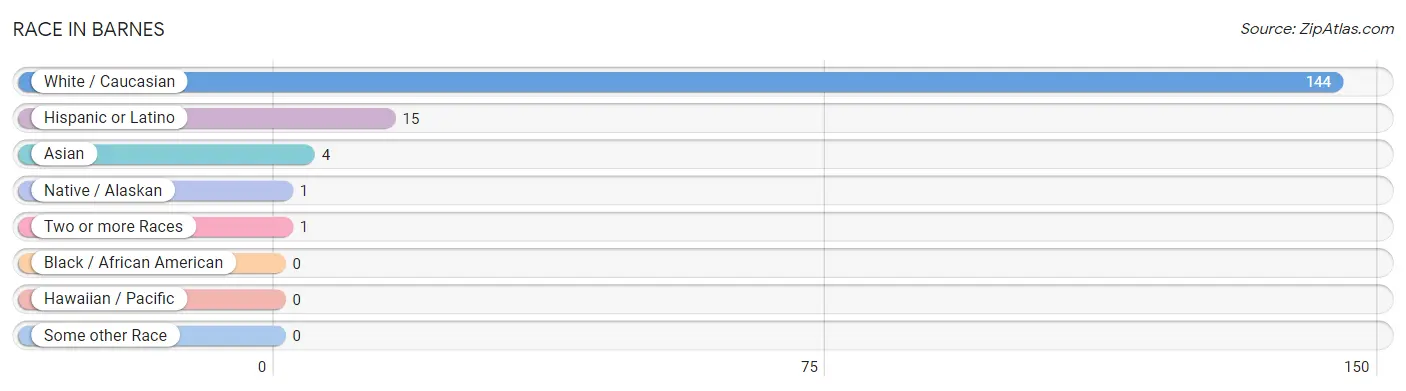
| Race | # Population | % Population |
| Asian | 4 | 2.7% |
| Black / African American | 0 | 0.0% |
| Hawaiian / Pacific | 0 | 0.0% |
| Hispanic or Latino | 15 | 10.0% |
| Native / Alaskan | 1 | 0.7% |
| White / Caucasian | 144 | 96.0% |
| Two or more Races | 1 | 0.7% |
| Some other Race | 0 | 0.0% |
| Total | 150 | 100.0% |
Ancestry in Barnes
The most populous ancestries reported in Barnes are German (51 | 34.0%), Irish (29 | 19.3%), English (20 | 13.3%), Mexican (15 | 10.0%), and Swedish (8 | 5.3%), together accounting for 82.0% of all Barnes residents.
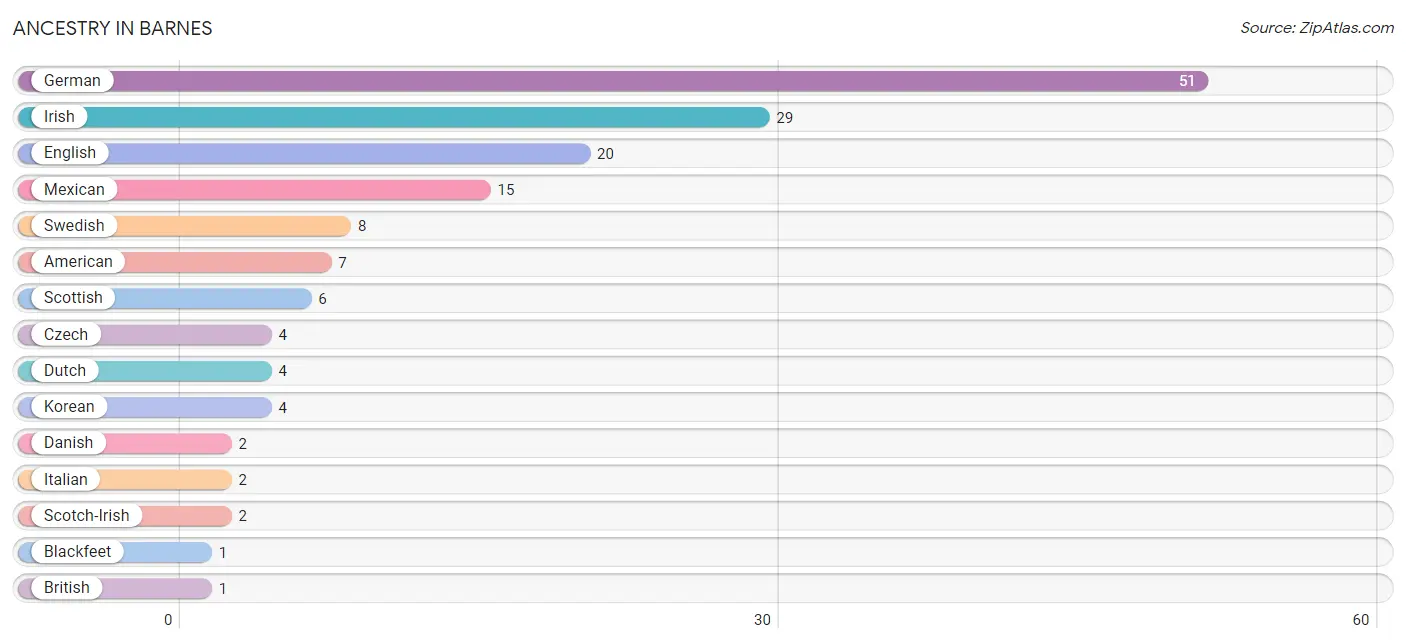
| Ancestry | # Population | % Population |
| American | 7 | 4.7% |
| Blackfeet | 1 | 0.7% |
| British | 1 | 0.7% |
| Czech | 4 | 2.7% |
| Danish | 2 | 1.3% |
| Dutch | 4 | 2.7% |
| English | 20 | 13.3% |
| German | 51 | 34.0% |
| Irish | 29 | 19.3% |
| Italian | 2 | 1.3% |
| Korean | 4 | 2.7% |
| Mexican | 15 | 10.0% |
| Mexican American Indian | 1 | 0.7% |
| Scotch-Irish | 2 | 1.3% |
| Scottish | 6 | 4.0% |
| Swedish | 8 | 5.3% |
| Swiss | 1 | 0.7% | View All 17 Rows |
Immigrants in Barnes
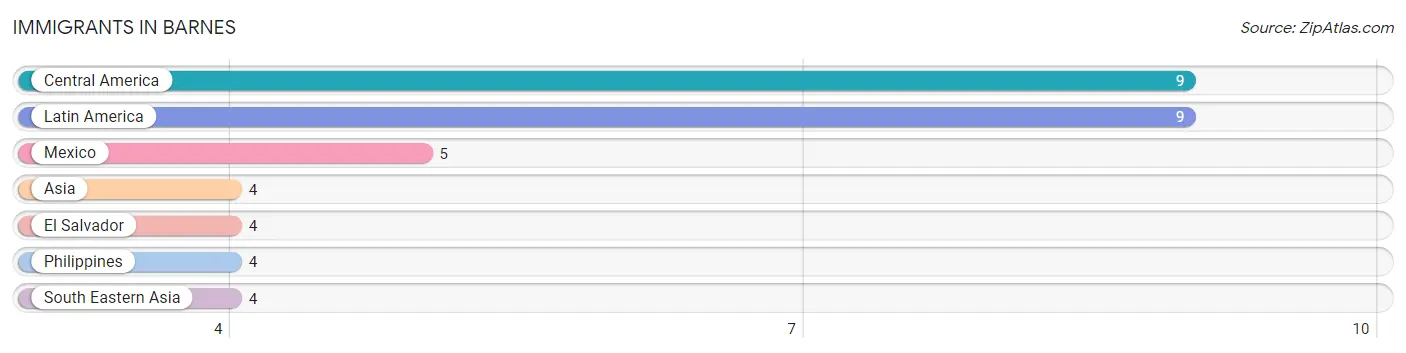
The most numerous immigrant groups reported in Barnes came from Central America (9 | 6.0%), Latin America (9 | 6.0%), Mexico (5 | 3.3%), Asia (4 | 2.7%), and El Salvador (4 | 2.7%), together accounting for 20.7% of all Barnes residents.
| Immigration Origin | # Population | % Population |
| Asia | 4 | 2.7% |
| Central America | 9 | 6.0% |
| El Salvador | 4 | 2.7% |
| Latin America | 9 | 6.0% |
| Mexico | 5 | 3.3% |
| Philippines | 4 | 2.7% |
| South Eastern Asia | 4 | 2.7% | View All 7 Rows |
Sex and Age in Barnes
Sex and Age in Barnes
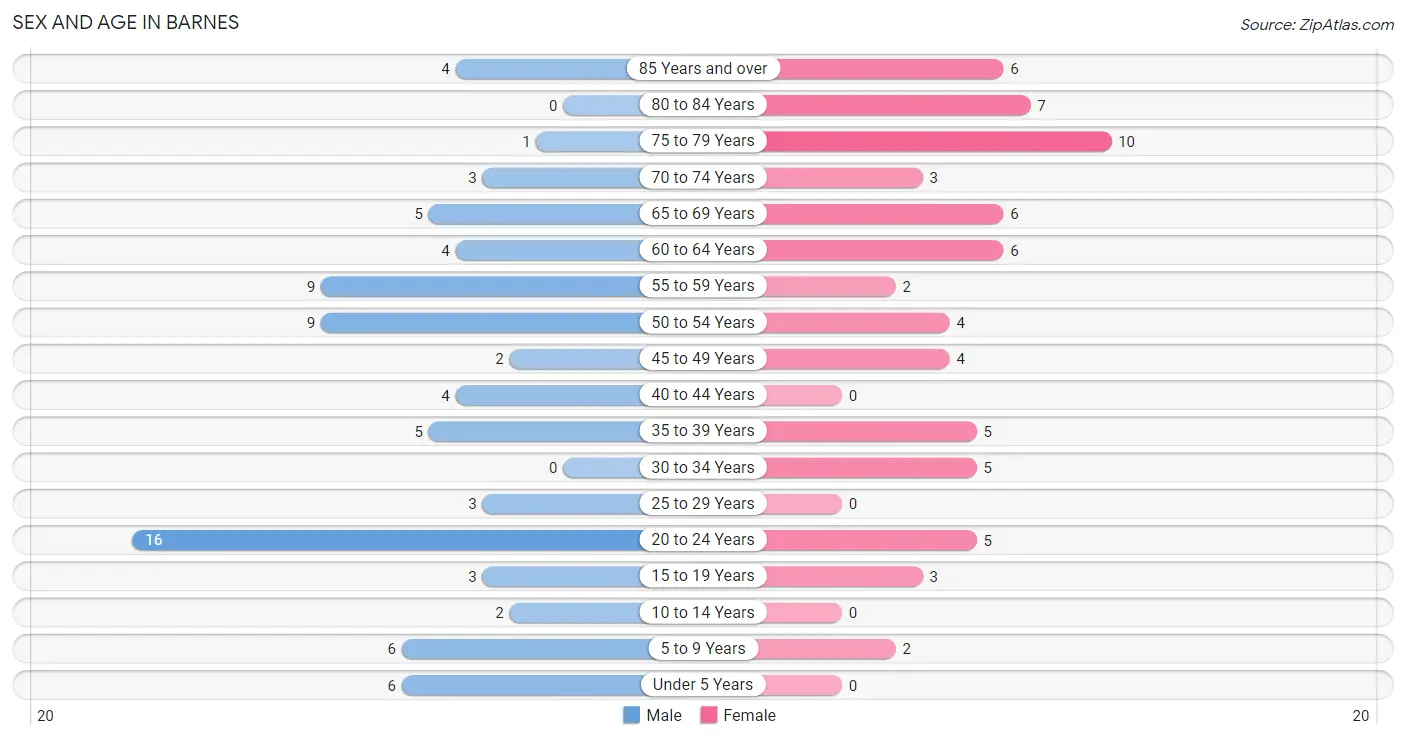
The most populous age groups in Barnes are 20 to 24 Years (16 | 19.5%) for men and 75 to 79 Years (10 | 14.7%) for women.
| Age Bracket | Male | Female |
| Under 5 Years | 6 (7.3%) | 0 (0.0%) |
| 5 to 9 Years | 6 (7.3%) | 2 (2.9%) |
| 10 to 14 Years | 2 (2.4%) | 0 (0.0%) |
| 15 to 19 Years | 3 (3.7%) | 3 (4.4%) |
| 20 to 24 Years | 16 (19.5%) | 5 (7.3%) |
| 25 to 29 Years | 3 (3.7%) | 0 (0.0%) |
| 30 to 34 Years | 0 (0.0%) | 5 (7.3%) |
| 35 to 39 Years | 5 (6.1%) | 5 (7.3%) |
| 40 to 44 Years | 4 (4.9%) | 0 (0.0%) |
| 45 to 49 Years | 2 (2.4%) | 4 (5.9%) |
| 50 to 54 Years | 9 (11.0%) | 4 (5.9%) |
| 55 to 59 Years | 9 (11.0%) | 2 (2.9%) |
| 60 to 64 Years | 4 (4.9%) | 6 (8.8%) |
| 65 to 69 Years | 5 (6.1%) | 6 (8.8%) |
| 70 to 74 Years | 3 (3.7%) | 3 (4.4%) |
| 75 to 79 Years | 1 (1.2%) | 10 (14.7%) |
| 80 to 84 Years | 0 (0.0%) | 7 (10.3%) |
| 85 Years and over | 4 (4.9%) | 6 (8.8%) |
| Total | 82 (100.0%) | 68 (100.0%) |
Families and Households in Barnes
Median Family Size in Barnes
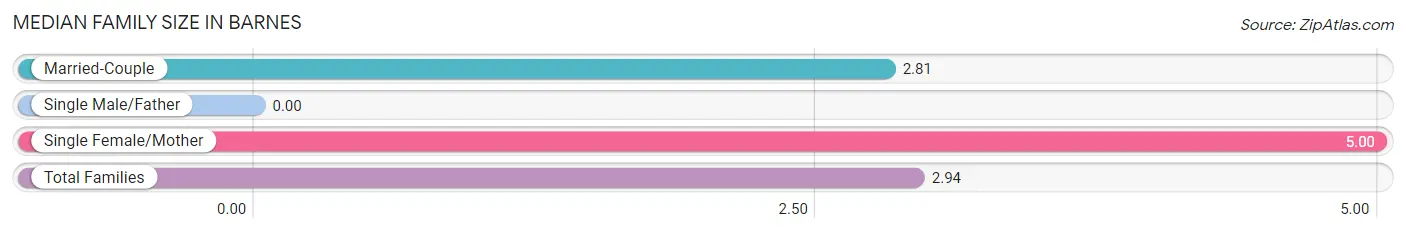
| Family Type | # Families | Family Size |
| Married-Couple | 32 (94.1%) | 2.81 |
| Single Male/Father | 0 (0.0%) | - |
| Single Female/Mother | 2 (5.9%) | 5.00 |
| Total Families | 34 (100.0%) | 2.94 |
Median Household Size in Barnes
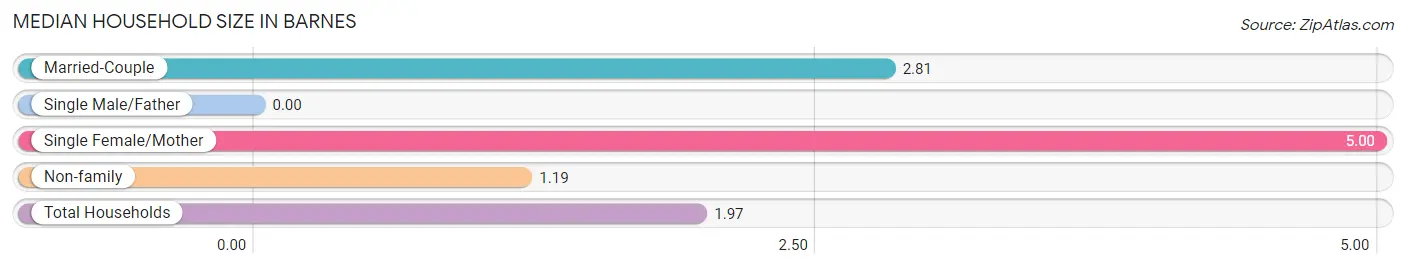
| Household Type | # Households | Household Size |
| Married-Couple | 32 (42.1%) | 2.81 |
| Single Male/Father | 0 (0.0%) | - |
| Single Female/Mother | 2 (2.6%) | 5.00 |
| Non-family | 42 (55.3%) | 1.19 |
| Total Households | 76 (100.0%) | 1.97 |
Household Size by Marriage Status in Barnes
Out of a total of 76 households in Barnes, 34 (44.7%) are family households, while 42 (55.3%) are nonfamily households. The most numerous type of family households are 2-person households, comprising 20, and the most common type of nonfamily households are 1-person households, comprising 34.
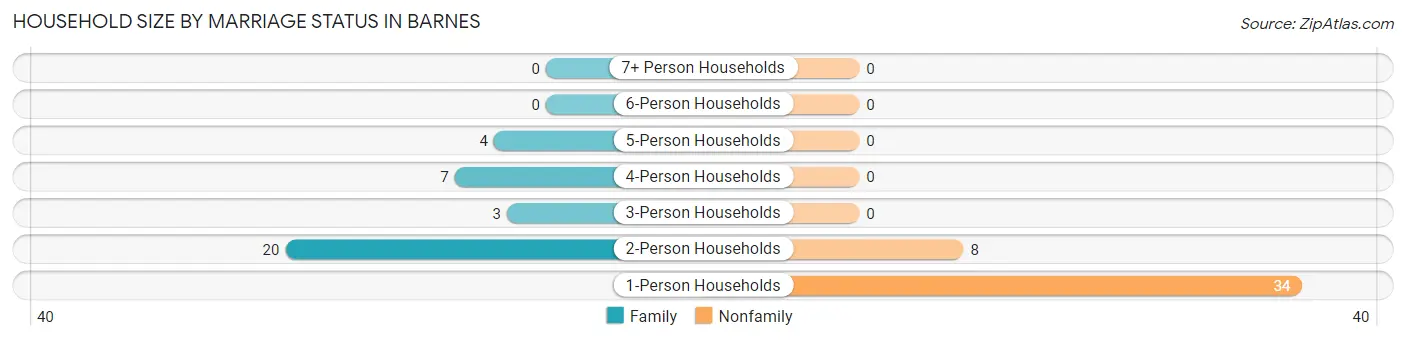
| Household Size | Family Households | Nonfamily Households |
| 1-Person Households | - | 34 (44.7%) |
| 2-Person Households | 20 (26.3%) | 8 (10.5%) |
| 3-Person Households | 3 (4.0%) | 0 (0.0%) |
| 4-Person Households | 7 (9.2%) | 0 (0.0%) |
| 5-Person Households | 4 (5.3%) | 0 (0.0%) |
| 6-Person Households | 0 (0.0%) | 0 (0.0%) |
| 7+ Person Households | 0 (0.0%) | 0 (0.0%) |
| Total | 34 (44.7%) | 42 (55.3%) |
Female Fertility in Barnes
Fertility by Age in Barnes
| Age Bracket | Women with Births | Births / 1,000 Women |
| 15 to 19 years | 0 (0.0%) | 0.0 |
| 20 to 34 years | 0 (0.0%) | 0.0 |
| 35 to 50 years | 0 (0.0%) | 0.0 |
| Total | 0 (0.0%) | 0.0 |
Fertility by Age by Marriage Status in Barnes
| Age Bracket | Married | Unmarried |
| 15 to 19 years | 0 (0.0%) | 0 (0.0%) |
| 20 to 34 years | 0 (0.0%) | 0 (0.0%) |
| 35 to 50 years | 0 (0.0%) | 0 (0.0%) |
| Total | 0 (0.0%) | 0 (0.0%) |
Fertility by Education in Barnes
| Educational Attainment | Women with Births | Births / 1,000 Women |
| Less than High School | 0 (0.0%) | 0.0 |
| High School Diploma | 0 (0.0%) | 0.0 |
| College or Associate's Degree | 0 (0.0%) | 0.0 |
| Bachelor's Degree | 0 (0.0%) | 0.0 |
| Graduate Degree | 0 (0.0%) | 0.0 |
| Total | 0 (0.0%) | 0.0 |
Fertility by Education by Marriage Status in Barnes
| Educational Attainment | Married | Unmarried |
| Less than High School | 0 (0.0%) | 0 (0.0%) |
| High School Diploma | 0 (0.0%) | 0 (0.0%) |
| College or Associate's Degree | 0 (0.0%) | 0 (0.0%) |
| Bachelor's Degree | 0 (0.0%) | 0 (0.0%) |
| Graduate Degree | 0 (0.0%) | 0 (0.0%) |
| Total | 0 (0.0%) | 0 (0.0%) |
Employment Characteristics in Barnes
Employment by Class of Employer in Barnes
Among the 72 employed individuals in Barnes, private company employees (52 | 72.2%), not-for-profit organizations (8 | 11.1%), and self-employed (not incorporated) (7 | 9.7%) make up the most common classes of employment.
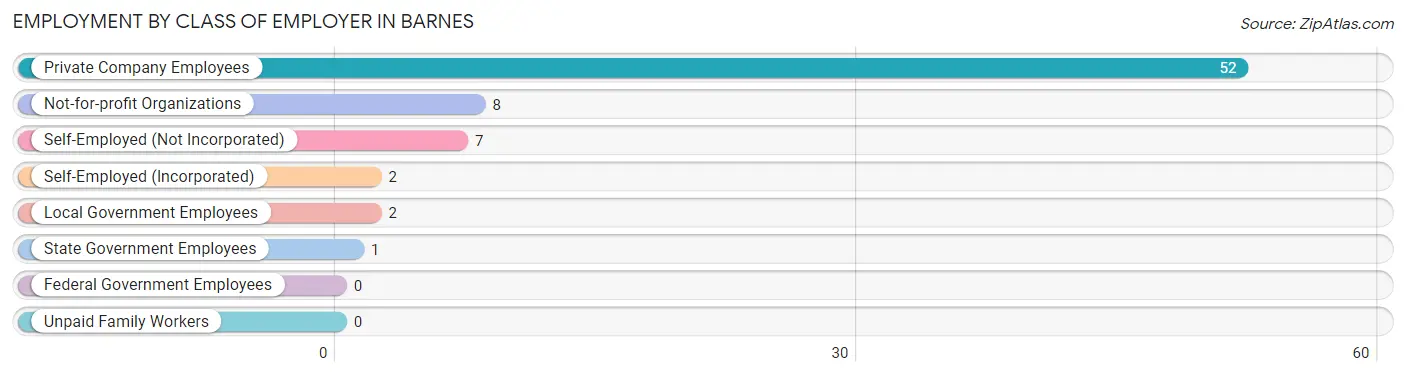
| Employer Class | # Employees | % Employees |
| Private Company Employees | 52 | 72.2% |
| Self-Employed (Incorporated) | 2 | 2.8% |
| Self-Employed (Not Incorporated) | 7 | 9.7% |
| Not-for-profit Organizations | 8 | 11.1% |
| Local Government Employees | 2 | 2.8% |
| State Government Employees | 1 | 1.4% |
| Federal Government Employees | 0 | 0.0% |
| Unpaid Family Workers | 0 | 0.0% |
| Total | 72 | 100.0% |
Employment Status by Age in Barnes
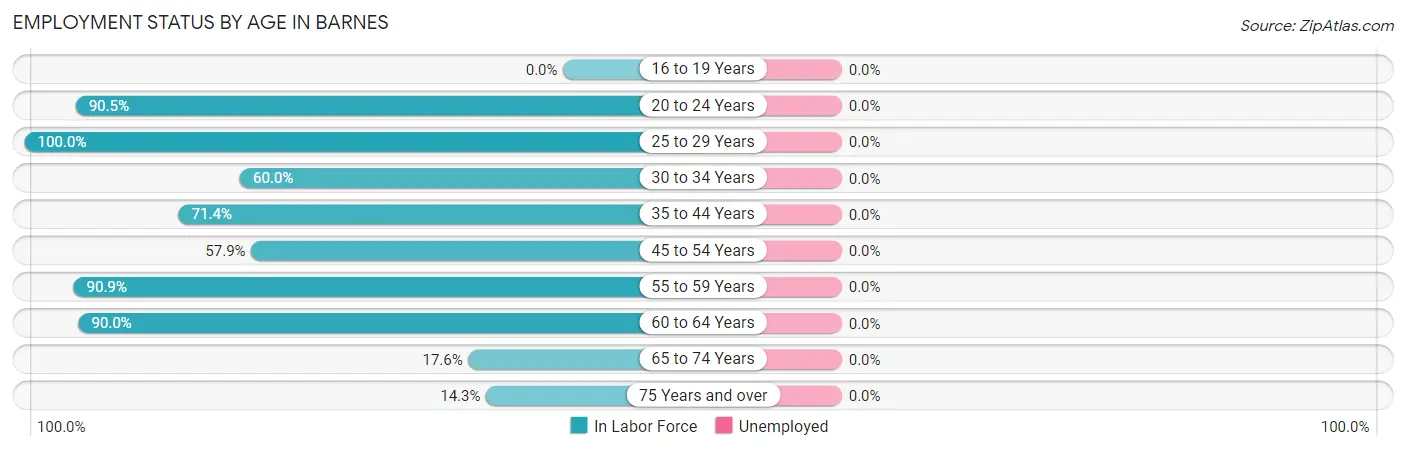
| Age Bracket | In Labor Force | Unemployed |
| 16 to 19 Years | 0 (0.0%) | 0 (0.0%) |
| 20 to 24 Years | 19 (90.5%) | 0 (0.0%) |
| 25 to 29 Years | 3 (100.0%) | 0 (0.0%) |
| 30 to 34 Years | 3 (60.0%) | 0 (0.0%) |
| 35 to 44 Years | 10 (71.4%) | 0 (0.0%) |
| 45 to 54 Years | 11 (57.9%) | 0 (0.0%) |
| 55 to 59 Years | 10 (90.9%) | 0 (0.0%) |
| 60 to 64 Years | 9 (90.0%) | 0 (0.0%) |
| 65 to 74 Years | 3 (17.6%) | 0 (0.0%) |
| 75 Years and over | 4 (14.3%) | 0 (0.0%) |
| Total | 72 (54.1%) | 0 (0.0%) |
Employment Status by Educational Attainment in Barnes
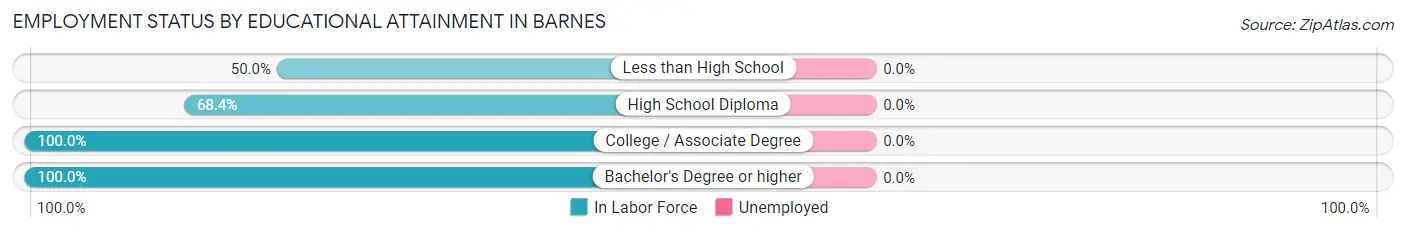
| Educational Attainment | In Labor Force | Unemployed |
| Less than High School | 10 (50.0%) | 0 (0.0%) |
| High School Diploma | 13 (68.4%) | 0 (0.0%) |
| College / Associate Degree | 20 (100.0%) | 0 (0.0%) |
| Bachelor's Degree or higher | 3 (100.0%) | 0 (0.0%) |
| Total | 46 (74.2%) | 0 (0.0%) |
Employment Occupations by Sex in Barnes
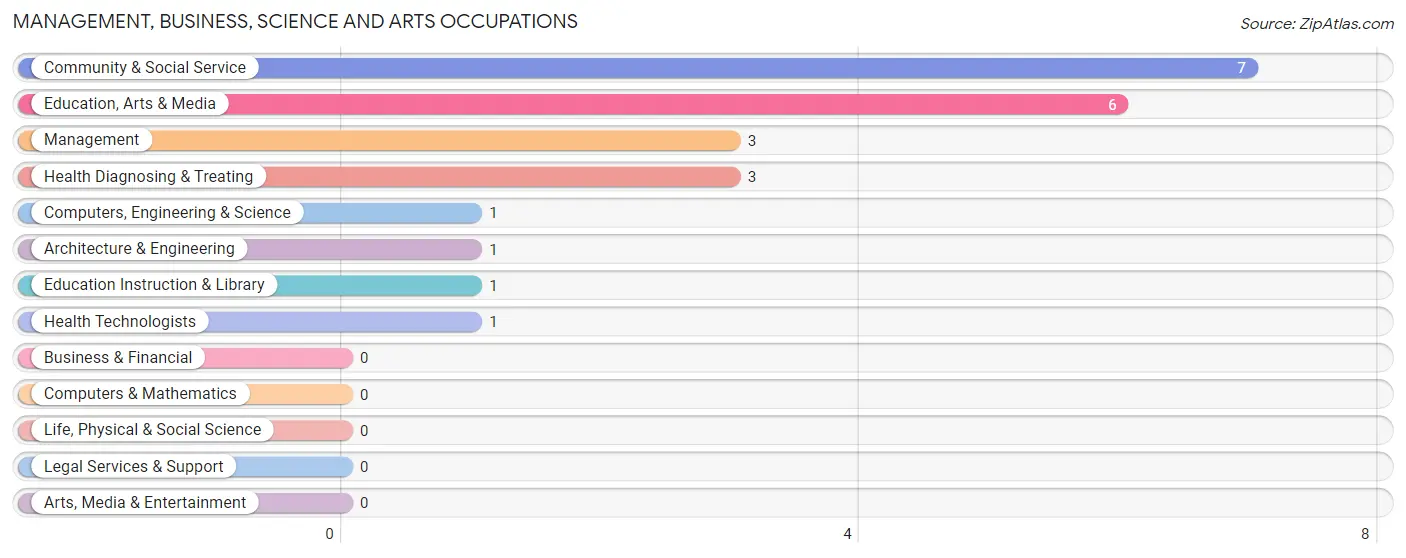
Management, Business, Science and Arts Occupations
The most common Management, Business, Science and Arts occupations in Barnes are Community & Social Service (7 | 9.7%), Education, Arts & Media (6 | 8.3%), Management (3 | 4.2%), Health Diagnosing & Treating (3 | 4.2%), and Computers, Engineering & Science (1 | 1.4%).
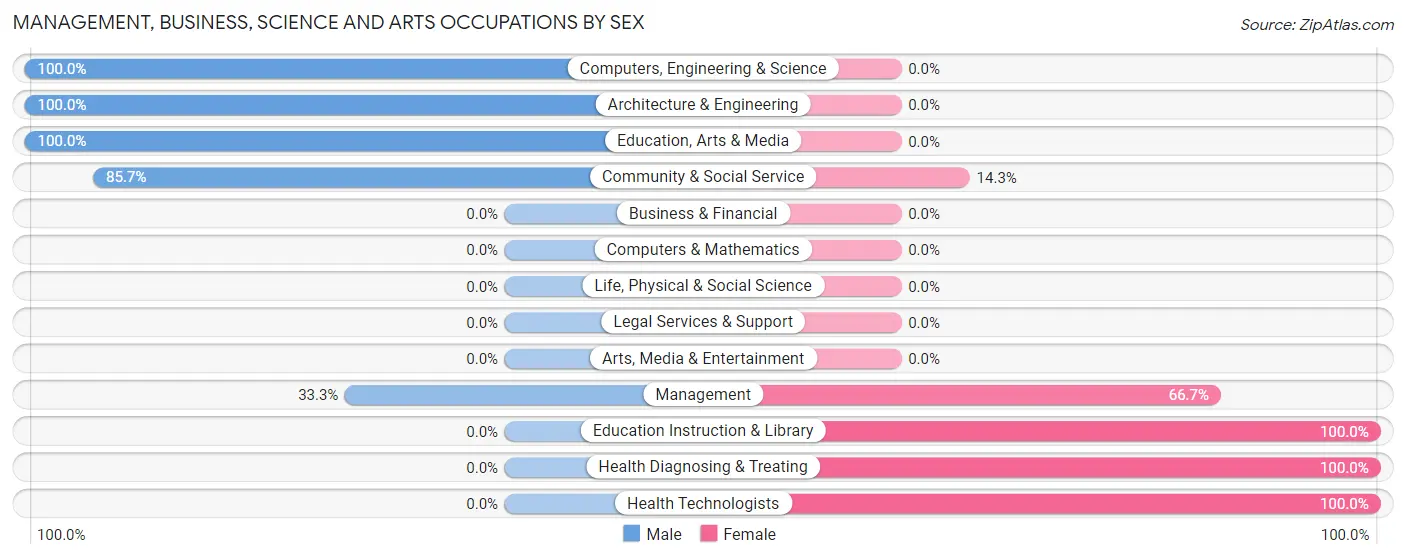
Management, Business, Science and Arts Occupations by Sex
Within the Management, Business, Science and Arts occupations in Barnes, the most male-oriented occupations are Computers, Engineering & Science (100.0%), Architecture & Engineering (100.0%), and Education, Arts & Media (100.0%), while the most female-oriented occupations are Education Instruction & Library (100.0%), Health Diagnosing & Treating (100.0%), and Health Technologists (100.0%).
| Occupation | Male | Female |
| Management | 1 (33.3%) | 2 (66.7%) |
| Business & Financial | 0 (0.0%) | 0 (0.0%) |
| Computers, Engineering & Science | 1 (100.0%) | 0 (0.0%) |
| Computers & Mathematics | 0 (0.0%) | 0 (0.0%) |
| Architecture & Engineering | 1 (100.0%) | 0 (0.0%) |
| Life, Physical & Social Science | 0 (0.0%) | 0 (0.0%) |
| Community & Social Service | 6 (85.7%) | 1 (14.3%) |
| Education, Arts & Media | 6 (100.0%) | 0 (0.0%) |
| Legal Services & Support | 0 (0.0%) | 0 (0.0%) |
| Education Instruction & Library | 0 (0.0%) | 1 (100.0%) |
| Arts, Media & Entertainment | 0 (0.0%) | 0 (0.0%) |
| Health Diagnosing & Treating | 0 (0.0%) | 3 (100.0%) |
| Health Technologists | 0 (0.0%) | 1 (100.0%) |
| Total (Category) | 8 (57.1%) | 6 (42.9%) |
| Total (Overall) | 42 (58.3%) | 30 (41.7%) |
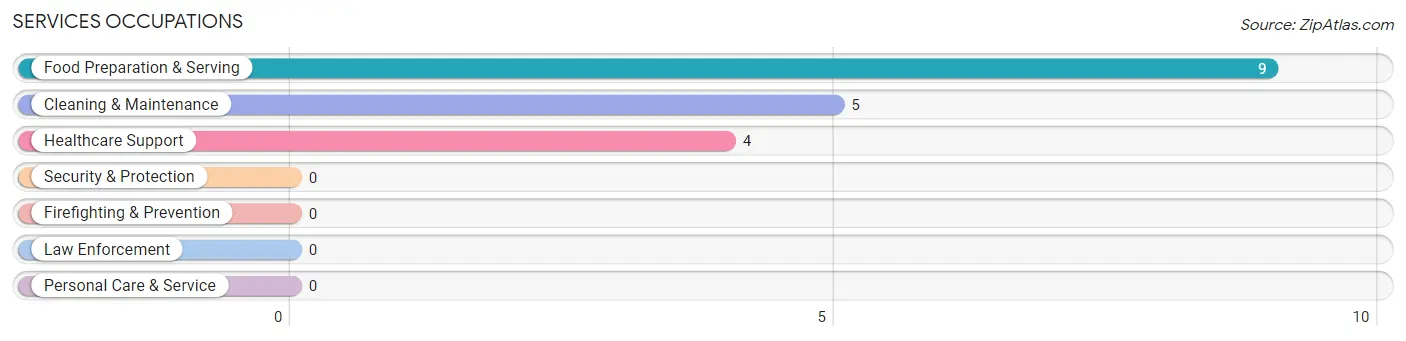
Services Occupations
The most common Services occupations in Barnes are Food Preparation & Serving (9 | 12.5%), Cleaning & Maintenance (5 | 6.9%), and Healthcare Support (4 | 5.6%).
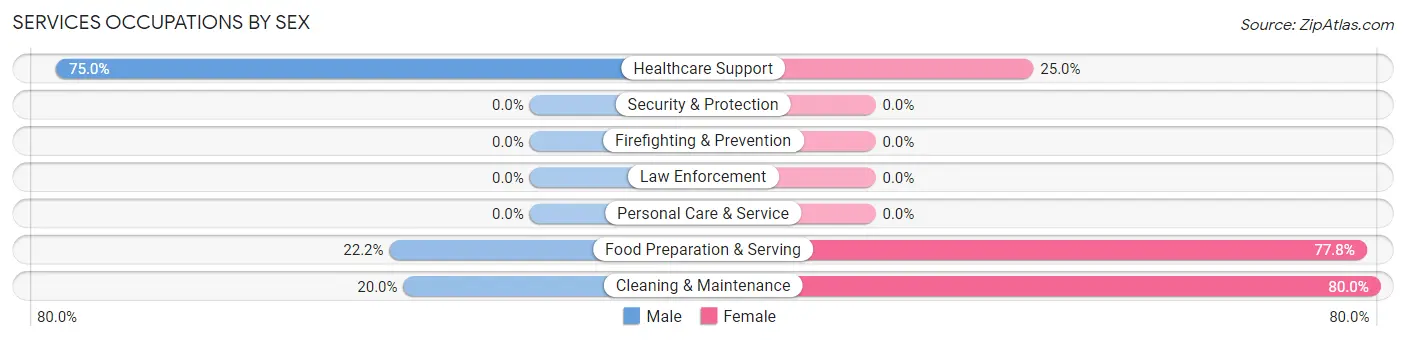
Services Occupations by Sex
Within the Services occupations in Barnes, the most male-oriented occupations are Healthcare Support (75.0%), Food Preparation & Serving (22.2%), and Cleaning & Maintenance (20.0%), while the most female-oriented occupations are Cleaning & Maintenance (80.0%), Food Preparation & Serving (77.8%), and Healthcare Support (25.0%).
| Occupation | Male | Female |
| Healthcare Support | 3 (75.0%) | 1 (25.0%) |
| Security & Protection | 0 (0.0%) | 0 (0.0%) |
| Firefighting & Prevention | 0 (0.0%) | 0 (0.0%) |
| Law Enforcement | 0 (0.0%) | 0 (0.0%) |
| Food Preparation & Serving | 2 (22.2%) | 7 (77.8%) |
| Cleaning & Maintenance | 1 (20.0%) | 4 (80.0%) |
| Personal Care & Service | 0 (0.0%) | 0 (0.0%) |
| Total (Category) | 6 (33.3%) | 12 (66.7%) |
| Total (Overall) | 42 (58.3%) | 30 (41.7%) |
Sales and Office Occupations
The most common Sales and Office occupations in Barnes are Office & Administration (11 | 15.3%), and Sales & Related (5 | 6.9%).
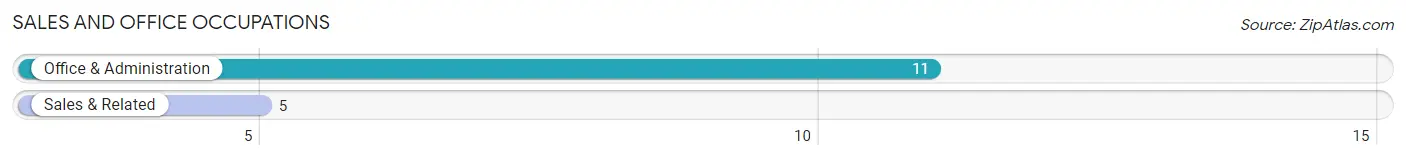
Sales and Office Occupations by Sex
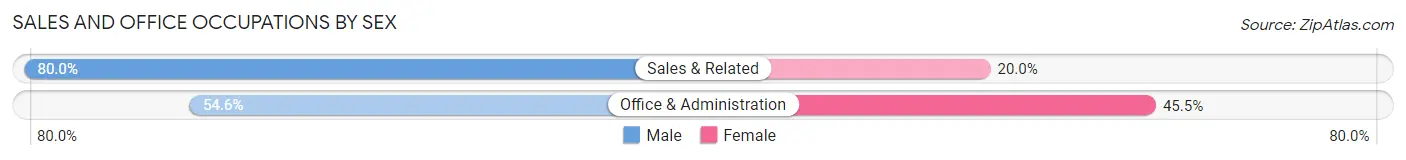
| Occupation | Male | Female |
| Sales & Related | 4 (80.0%) | 1 (20.0%) |
| Office & Administration | 6 (54.5%) | 5 (45.5%) |
| Total (Category) | 10 (62.5%) | 6 (37.5%) |
| Total (Overall) | 42 (58.3%) | 30 (41.7%) |
Natural Resources, Construction and Maintenance Occupations
The most common Natural Resources, Construction and Maintenance occupations in Barnes are Farming, Fishing & Forestry (10 | 13.9%), Construction & Extraction (2 | 2.8%), and Installation, Maintenance & Repair (1 | 1.4%).
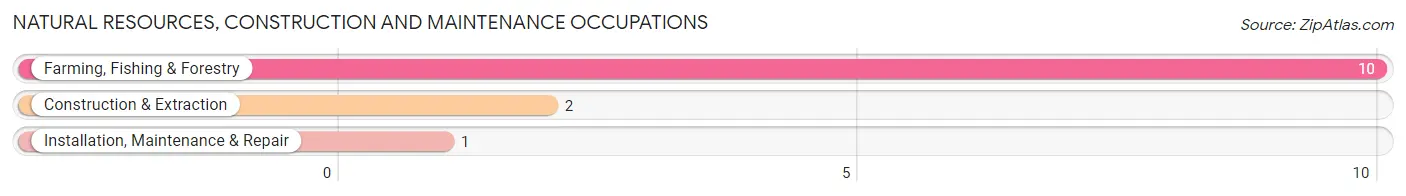
Natural Resources, Construction and Maintenance Occupations by Sex
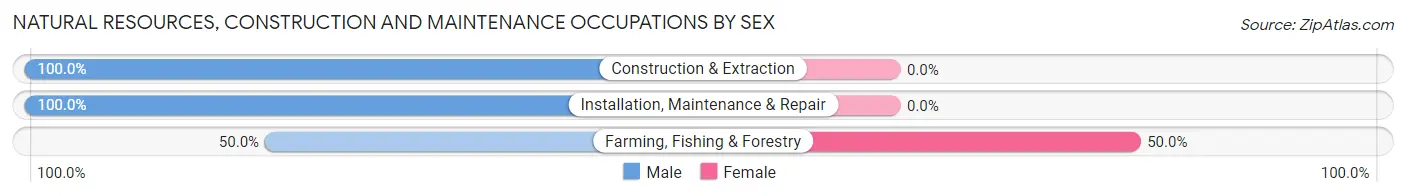
| Occupation | Male | Female |
| Farming, Fishing & Forestry | 5 (50.0%) | 5 (50.0%) |
| Construction & Extraction | 2 (100.0%) | 0 (0.0%) |
| Installation, Maintenance & Repair | 1 (100.0%) | 0 (0.0%) |
| Total (Category) | 8 (61.5%) | 5 (38.5%) |
| Total (Overall) | 42 (58.3%) | 30 (41.7%) |
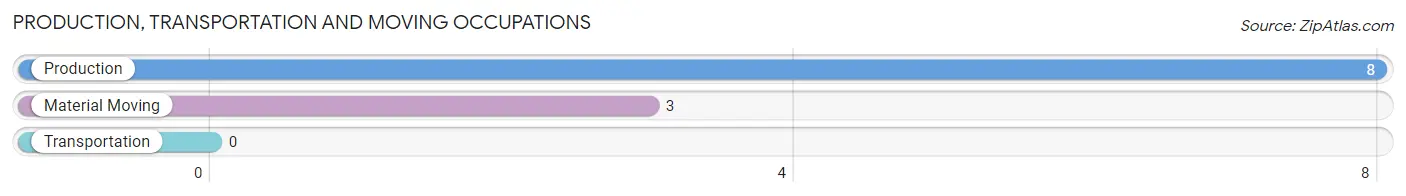
Production, Transportation and Moving Occupations
The most common Production, Transportation and Moving occupations in Barnes are Production (8 | 11.1%), and Material Moving (3 | 4.2%).
Production, Transportation and Moving Occupations by Sex
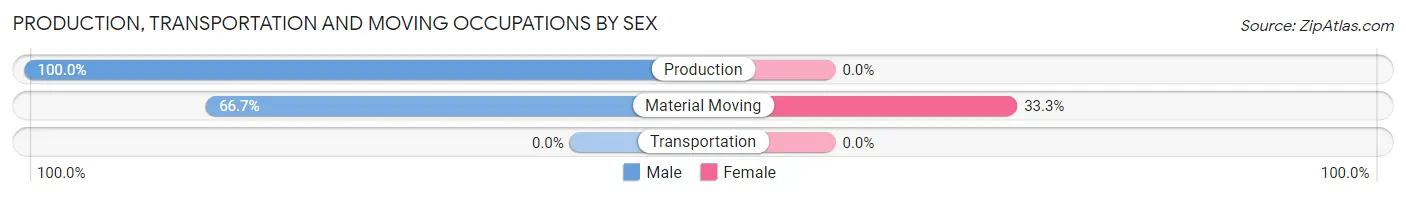
| Occupation | Male | Female |
| Production | 8 (100.0%) | 0 (0.0%) |
| Transportation | 0 (0.0%) | 0 (0.0%) |
| Material Moving | 2 (66.7%) | 1 (33.3%) |
| Total (Category) | 10 (90.9%) | 1 (9.1%) |
| Total (Overall) | 42 (58.3%) | 30 (41.7%) |
Employment Industries by Sex in Barnes
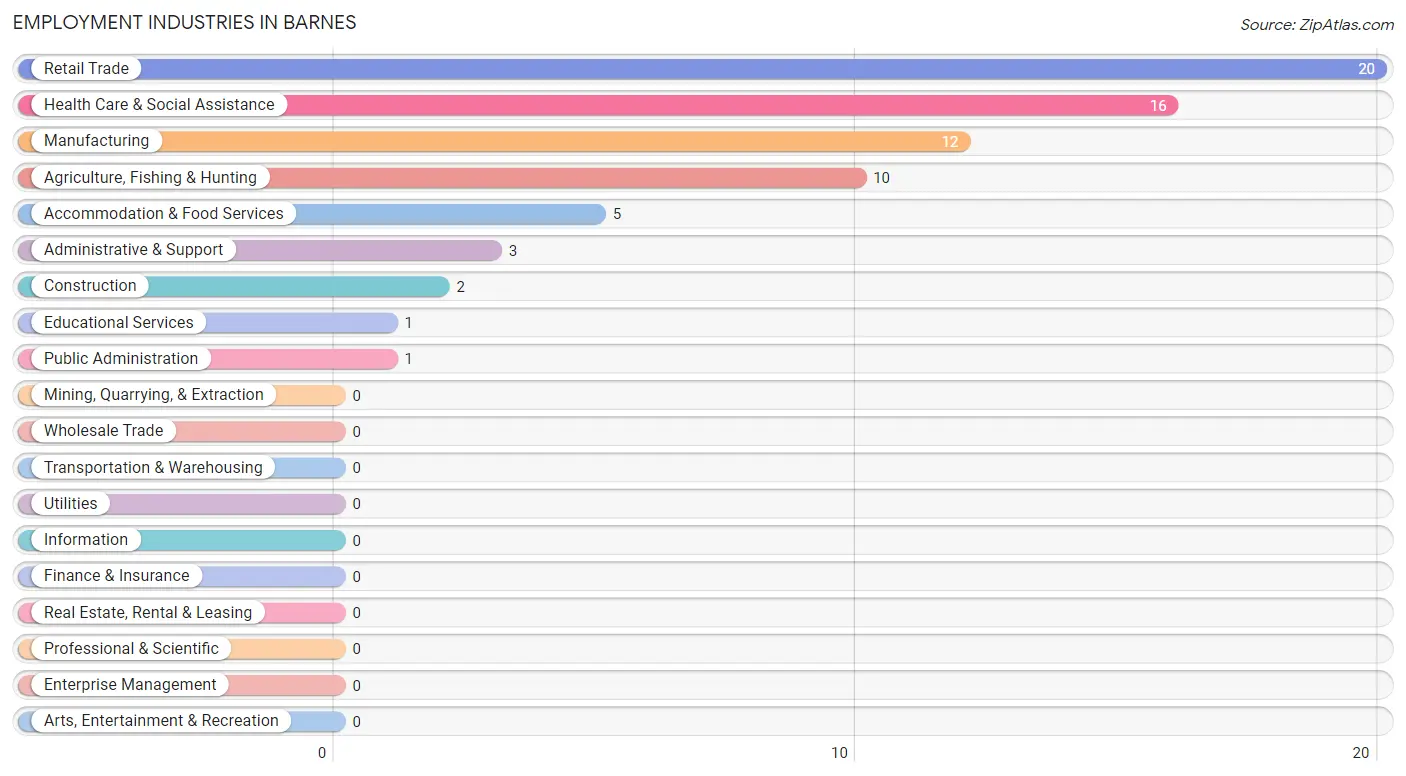
Employment Industries in Barnes
The major employment industries in Barnes include Retail Trade (20 | 27.8%), Health Care & Social Assistance (16 | 22.2%), Manufacturing (12 | 16.7%), Agriculture, Fishing & Hunting (10 | 13.9%), and Accommodation & Food Services (5 | 6.9%).
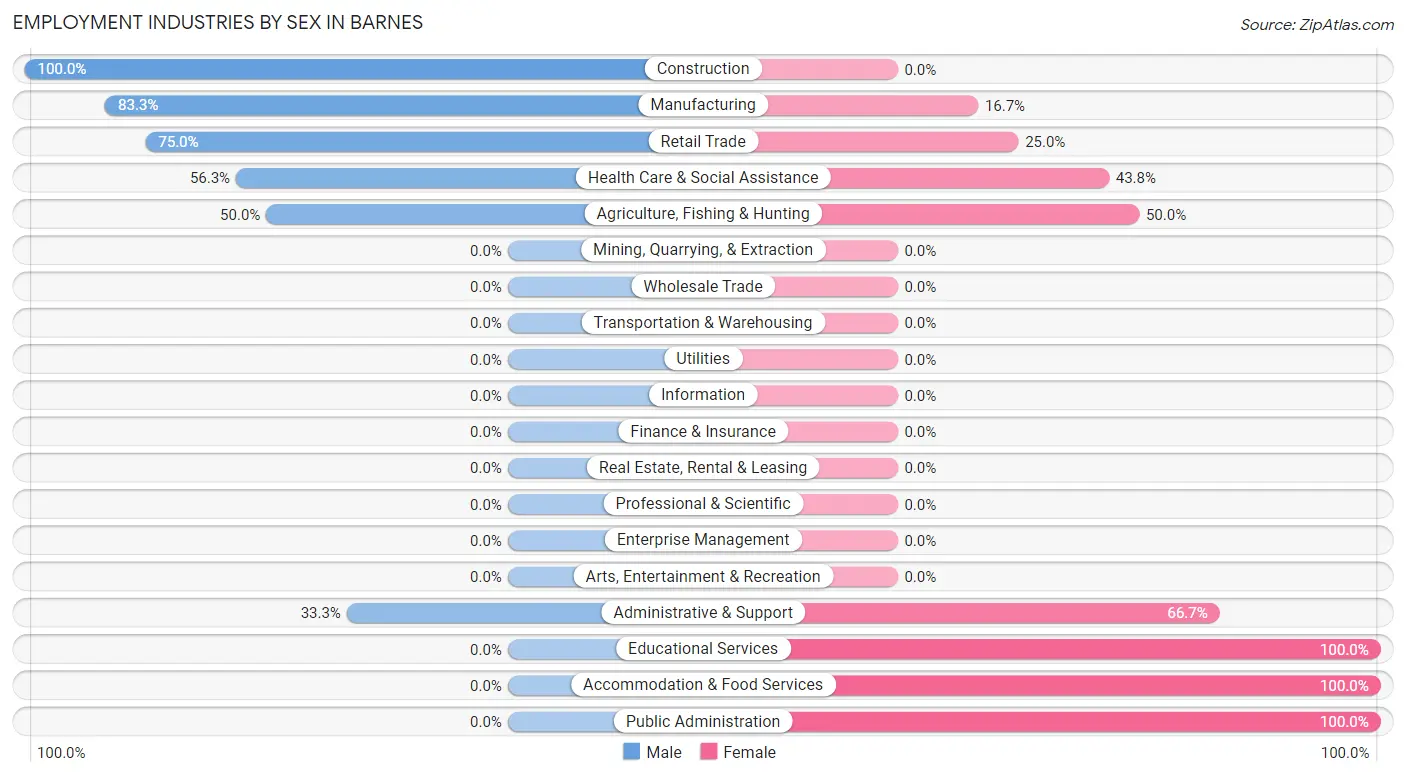
Employment Industries by Sex in Barnes
The Barnes industries that see more men than women are Construction (100.0%), Manufacturing (83.3%), and Retail Trade (75.0%), whereas the industries that tend to have a higher number of women are Educational Services (100.0%), Accommodation & Food Services (100.0%), and Public Administration (100.0%).
| Industry | Male | Female |
| Agriculture, Fishing & Hunting | 5 (50.0%) | 5 (50.0%) |
| Mining, Quarrying, & Extraction | 0 (0.0%) | 0 (0.0%) |
| Construction | 2 (100.0%) | 0 (0.0%) |
| Manufacturing | 10 (83.3%) | 2 (16.7%) |
| Wholesale Trade | 0 (0.0%) | 0 (0.0%) |
| Retail Trade | 15 (75.0%) | 5 (25.0%) |
| Transportation & Warehousing | 0 (0.0%) | 0 (0.0%) |
| Utilities | 0 (0.0%) | 0 (0.0%) |
| Information | 0 (0.0%) | 0 (0.0%) |
| Finance & Insurance | 0 (0.0%) | 0 (0.0%) |
| Real Estate, Rental & Leasing | 0 (0.0%) | 0 (0.0%) |
| Professional & Scientific | 0 (0.0%) | 0 (0.0%) |
| Enterprise Management | 0 (0.0%) | 0 (0.0%) |
| Administrative & Support | 1 (33.3%) | 2 (66.7%) |
| Educational Services | 0 (0.0%) | 1 (100.0%) |
| Health Care & Social Assistance | 9 (56.2%) | 7 (43.8%) |
| Arts, Entertainment & Recreation | 0 (0.0%) | 0 (0.0%) |
| Accommodation & Food Services | 0 (0.0%) | 5 (100.0%) |
| Public Administration | 0 (0.0%) | 1 (100.0%) |
| Total | 42 (58.3%) | 30 (41.7%) |
Education in Barnes
School Enrollment in Barnes
The most common levels of schooling among the 17 students in Barnes are elementary school (6 | 35.3%), high school (6 | 35.3%), and kindergarten (3 | 17.6%).
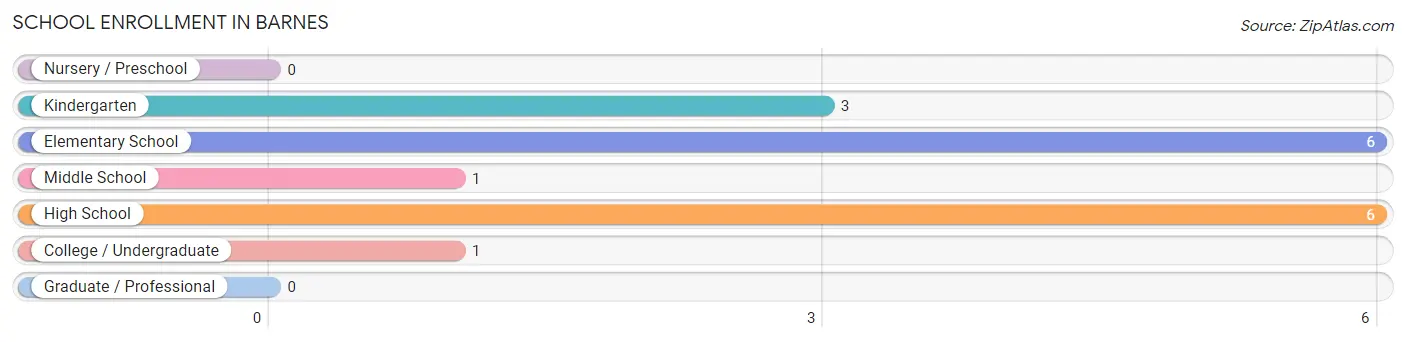
| School Level | # Students | % Students |
| Nursery / Preschool | 0 | 0.0% |
| Kindergarten | 3 | 17.6% |
| Elementary School | 6 | 35.3% |
| Middle School | 1 | 5.9% |
| High School | 6 | 35.3% |
| College / Undergraduate | 1 | 5.9% |
| Graduate / Professional | 0 | 0.0% |
| Total | 17 | 100.0% |
School Enrollment by Age by Funding Source in Barnes
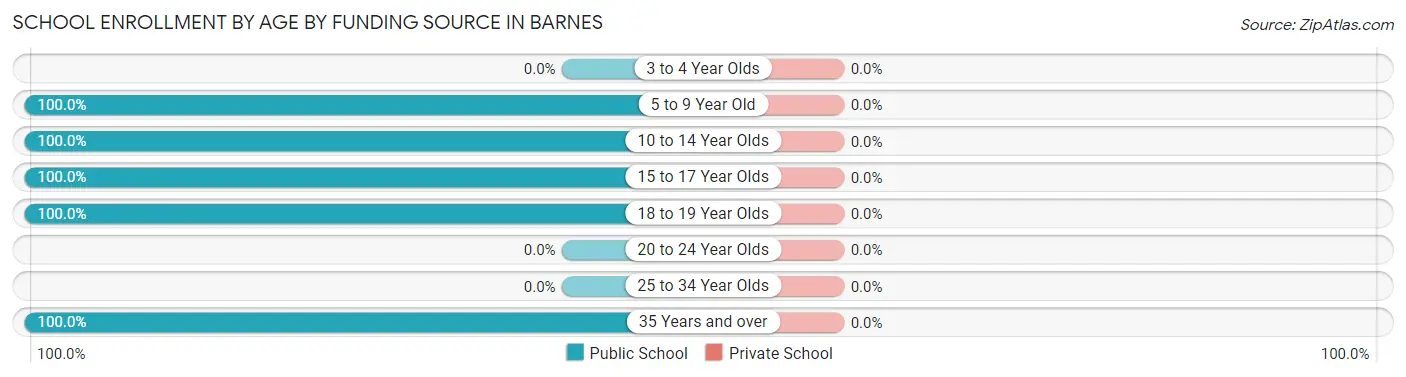
| Age Bracket | Public School | Private School |
| 3 to 4 Year Olds | 0 (0.0%) | 0 (0.0%) |
| 5 to 9 Year Old | 8 (100.0%) | 0 (0.0%) |
| 10 to 14 Year Olds | 2 (100.0%) | 0 (0.0%) |
| 15 to 17 Year Olds | 4 (100.0%) | 0 (0.0%) |
| 18 to 19 Year Olds | 2 (100.0%) | 0 (0.0%) |
| 20 to 24 Year Olds | 0 (0.0%) | 0 (0.0%) |
| 25 to 34 Year Olds | 0 (0.0%) | 0 (0.0%) |
| 35 Years and over | 1 (100.0%) | 0 (0.0%) |
| Total | 17 (100.0%) | 0 (0.0%) |
Educational Attainment by Field of Study in Barnes
Multidisciplinary studies (5 | 62.5%), bio, nature & agricultural (2 | 25.0%), and science & technology (1 | 12.5%) are the most common fields of study among 8 individuals in Barnes who have obtained a bachelor's degree or higher.
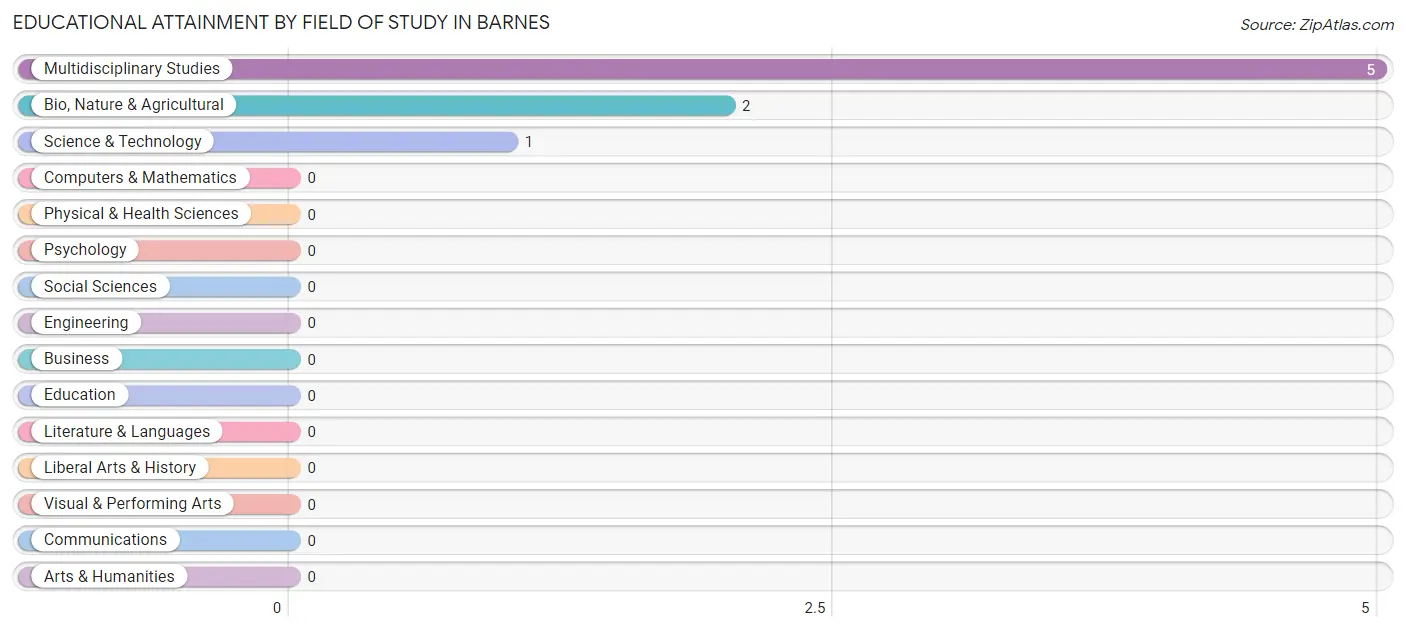
| Field of Study | # Graduates | % Graduates |
| Computers & Mathematics | 0 | 0.0% |
| Bio, Nature & Agricultural | 2 | 25.0% |
| Physical & Health Sciences | 0 | 0.0% |
| Psychology | 0 | 0.0% |
| Social Sciences | 0 | 0.0% |
| Engineering | 0 | 0.0% |
| Multidisciplinary Studies | 5 | 62.5% |
| Science & Technology | 1 | 12.5% |
| Business | 0 | 0.0% |
| Education | 0 | 0.0% |
| Literature & Languages | 0 | 0.0% |
| Liberal Arts & History | 0 | 0.0% |
| Visual & Performing Arts | 0 | 0.0% |
| Communications | 0 | 0.0% |
| Arts & Humanities | 0 | 0.0% |
| Total | 8 | 100.0% |
Transportation & Commute in Barnes
Vehicle Availability by Sex in Barnes
The most prevalent vehicle ownership categories in Barnes are males with 2 vehicles (21, accounting for 50.0%) and females with 2 vehicles (18, making up 70.0%).
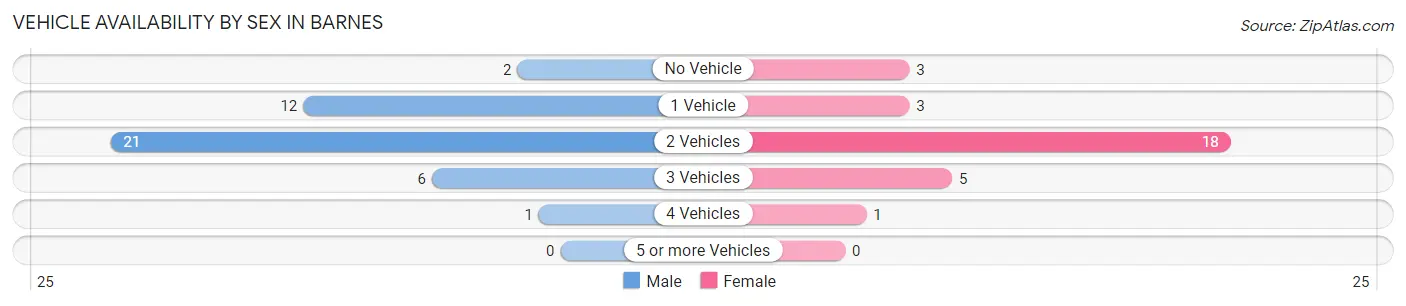
| Vehicles Available | Male | Female |
| No Vehicle | 2 (4.8%) | 3 (10.0%) |
| 1 Vehicle | 12 (28.6%) | 3 (10.0%) |
| 2 Vehicles | 21 (50.0%) | 18 (60.0%) |
| 3 Vehicles | 6 (14.3%) | 5 (16.7%) |
| 4 Vehicles | 1 (2.4%) | 1 (3.3%) |
| 5 or more Vehicles | 0 (0.0%) | 0 (0.0%) |
| Total | 42 (100.0%) | 30 (100.0%) |
Commute Time in Barnes
The most frequently occuring commute durations in Barnes are 30 to 34 minutes (21 commuters, 29.2%), 15 to 19 minutes (12 commuters, 16.7%), and less than 5 minutes (10 commuters, 13.9%).
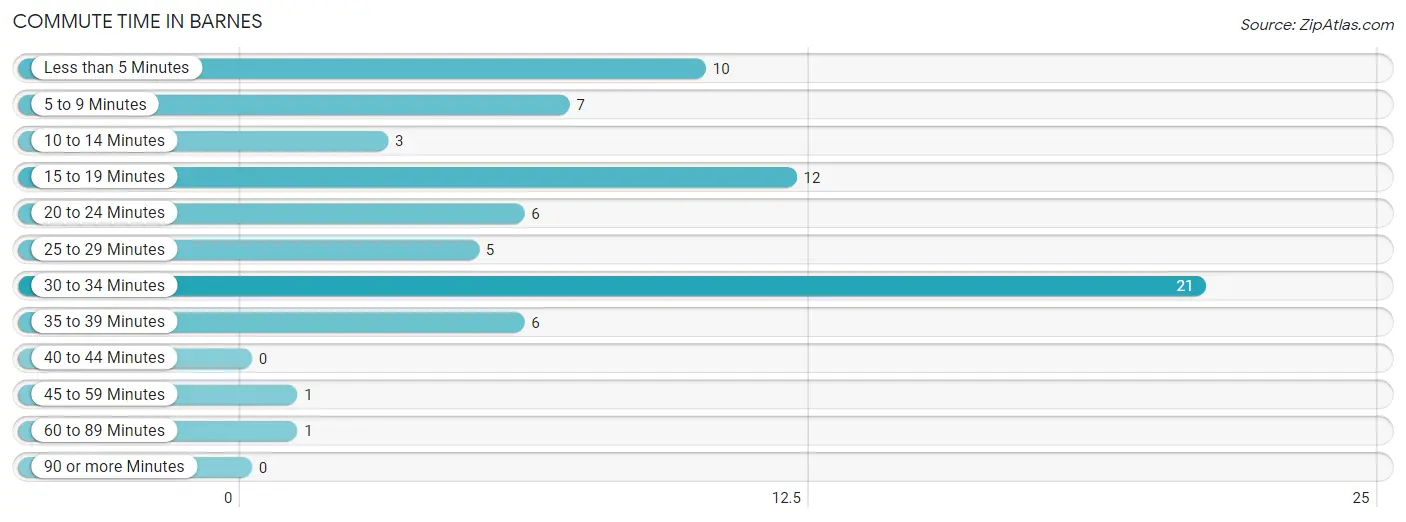
| Commute Time | # Commuters | % Commuters |
| Less than 5 Minutes | 10 | 13.9% |
| 5 to 9 Minutes | 7 | 9.7% |
| 10 to 14 Minutes | 3 | 4.2% |
| 15 to 19 Minutes | 12 | 16.7% |
| 20 to 24 Minutes | 6 | 8.3% |
| 25 to 29 Minutes | 5 | 6.9% |
| 30 to 34 Minutes | 21 | 29.2% |
| 35 to 39 Minutes | 6 | 8.3% |
| 40 to 44 Minutes | 0 | 0.0% |
| 45 to 59 Minutes | 1 | 1.4% |
| 60 to 89 Minutes | 1 | 1.4% |
| 90 or more Minutes | 0 | 0.0% |
Commute Time by Sex in Barnes
The most common commute times in Barnes are 30 to 34 minutes (12 commuters, 28.6%) for males and 30 to 34 minutes (9 commuters, 30.0%) for females.
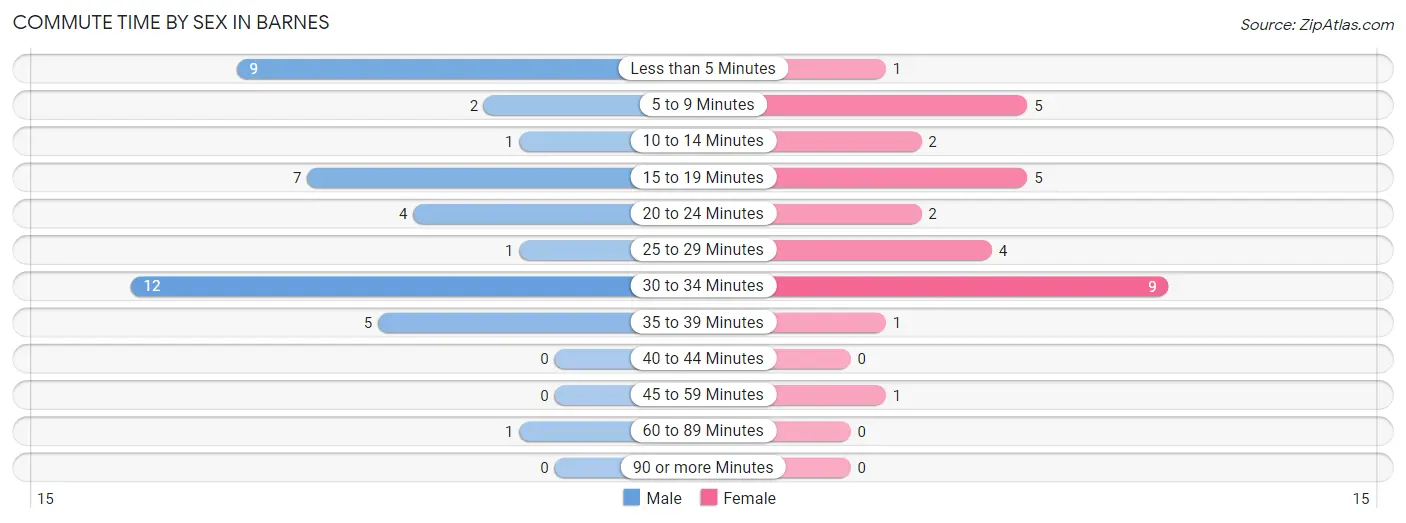
| Commute Time | Male | Female |
| Less than 5 Minutes | 9 (21.4%) | 1 (3.3%) |
| 5 to 9 Minutes | 2 (4.8%) | 5 (16.7%) |
| 10 to 14 Minutes | 1 (2.4%) | 2 (6.7%) |
| 15 to 19 Minutes | 7 (16.7%) | 5 (16.7%) |
| 20 to 24 Minutes | 4 (9.5%) | 2 (6.7%) |
| 25 to 29 Minutes | 1 (2.4%) | 4 (13.3%) |
| 30 to 34 Minutes | 12 (28.6%) | 9 (30.0%) |
| 35 to 39 Minutes | 5 (11.9%) | 1 (3.3%) |
| 40 to 44 Minutes | 0 (0.0%) | 0 (0.0%) |
| 45 to 59 Minutes | 0 (0.0%) | 1 (3.3%) |
| 60 to 89 Minutes | 1 (2.4%) | 0 (0.0%) |
| 90 or more Minutes | 0 (0.0%) | 0 (0.0%) |
Time of Departure to Work by Sex in Barnes
The most frequent times of departure to work in Barnes are 6:30 AM to 6:59 AM (14, 33.3%) for males and 7:00 AM to 7:29 AM (11, 36.7%) for females.
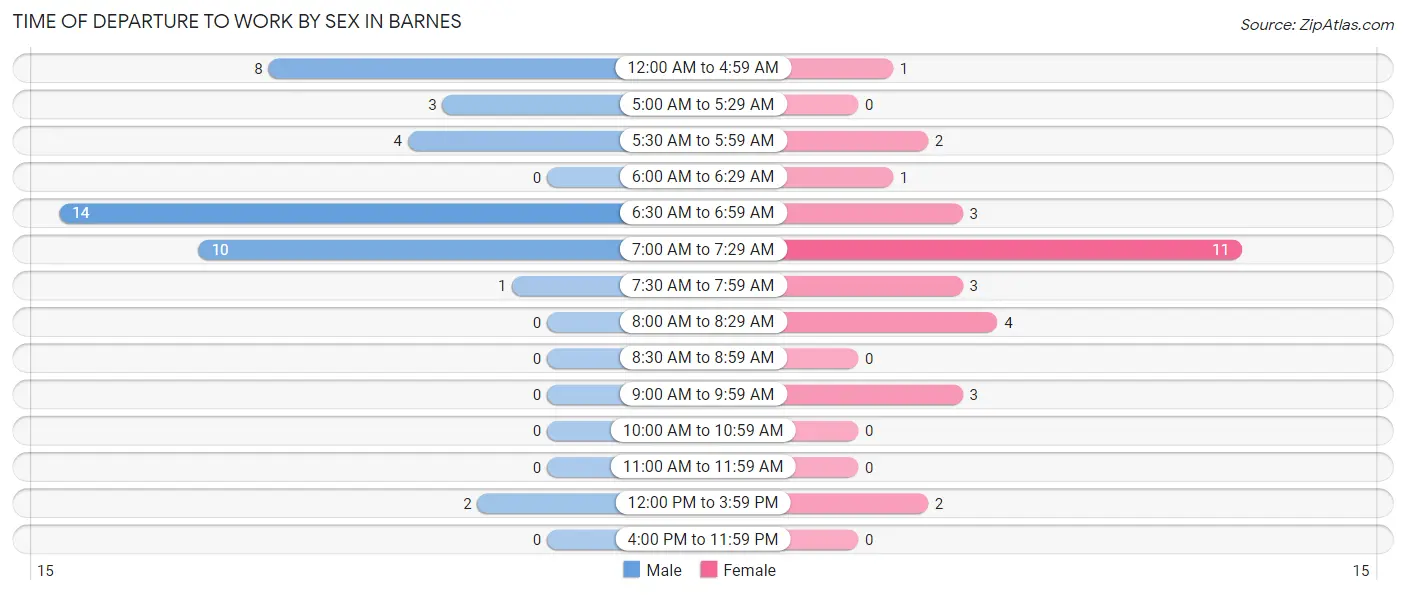
| Time of Departure | Male | Female |
| 12:00 AM to 4:59 AM | 8 (19.1%) | 1 (3.3%) |
| 5:00 AM to 5:29 AM | 3 (7.1%) | 0 (0.0%) |
| 5:30 AM to 5:59 AM | 4 (9.5%) | 2 (6.7%) |
| 6:00 AM to 6:29 AM | 0 (0.0%) | 1 (3.3%) |
| 6:30 AM to 6:59 AM | 14 (33.3%) | 3 (10.0%) |
| 7:00 AM to 7:29 AM | 10 (23.8%) | 11 (36.7%) |
| 7:30 AM to 7:59 AM | 1 (2.4%) | 3 (10.0%) |
| 8:00 AM to 8:29 AM | 0 (0.0%) | 4 (13.3%) |
| 8:30 AM to 8:59 AM | 0 (0.0%) | 0 (0.0%) |
| 9:00 AM to 9:59 AM | 0 (0.0%) | 3 (10.0%) |
| 10:00 AM to 10:59 AM | 0 (0.0%) | 0 (0.0%) |
| 11:00 AM to 11:59 AM | 0 (0.0%) | 0 (0.0%) |
| 12:00 PM to 3:59 PM | 2 (4.8%) | 2 (6.7%) |
| 4:00 PM to 11:59 PM | 0 (0.0%) | 0 (0.0%) |
| Total | 42 (100.0%) | 30 (100.0%) |
Housing Occupancy in Barnes
Occupancy by Ownership in Barnes
Of the total 76 dwellings in Barnes, owner-occupied units account for 57 (75.0%), while renter-occupied units make up 19 (25.0%).
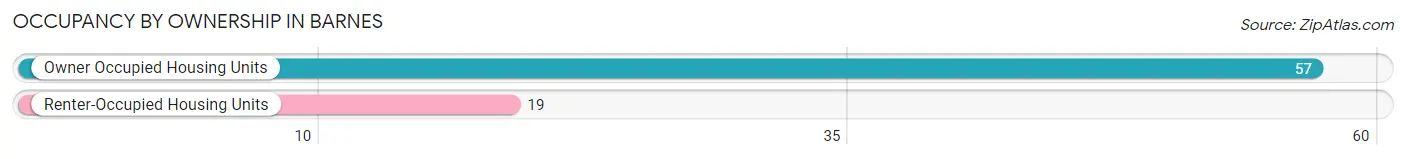
| Occupancy | # Housing Units | % Housing Units |
| Owner Occupied Housing Units | 57 | 75.0% |
| Renter-Occupied Housing Units | 19 | 25.0% |
| Total Occupied Housing Units | 76 | 100.0% |
Occupancy by Household Size in Barnes
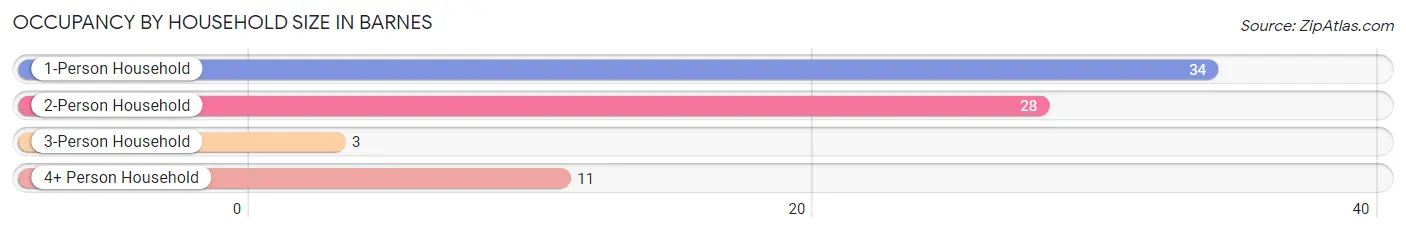
| Household Size | # Housing Units | % Housing Units |
| 1-Person Household | 34 | 44.7% |
| 2-Person Household | 28 | 36.8% |
| 3-Person Household | 3 | 4.0% |
| 4+ Person Household | 11 | 14.5% |
| Total Housing Units | 76 | 100.0% |
Occupancy by Ownership by Household Size in Barnes
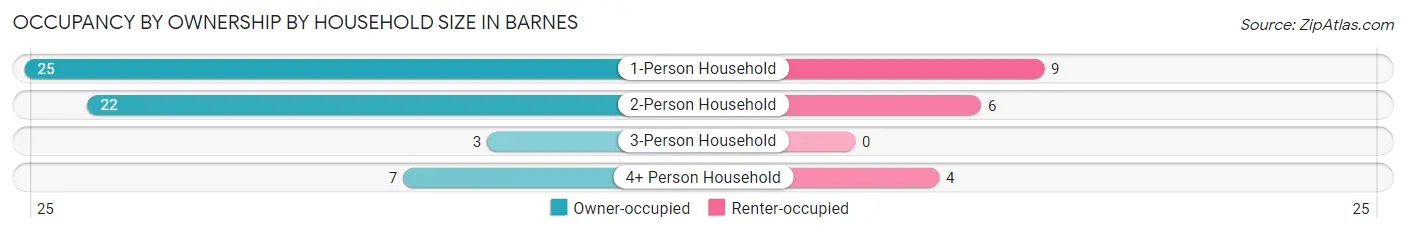
| Household Size | Owner-occupied | Renter-occupied |
| 1-Person Household | 25 (73.5%) | 9 (26.5%) |
| 2-Person Household | 22 (78.6%) | 6 (21.4%) |
| 3-Person Household | 3 (100.0%) | 0 (0.0%) |
| 4+ Person Household | 7 (63.6%) | 4 (36.4%) |
| Total Housing Units | 57 (75.0%) | 19 (25.0%) |
Occupancy by Educational Attainment in Barnes
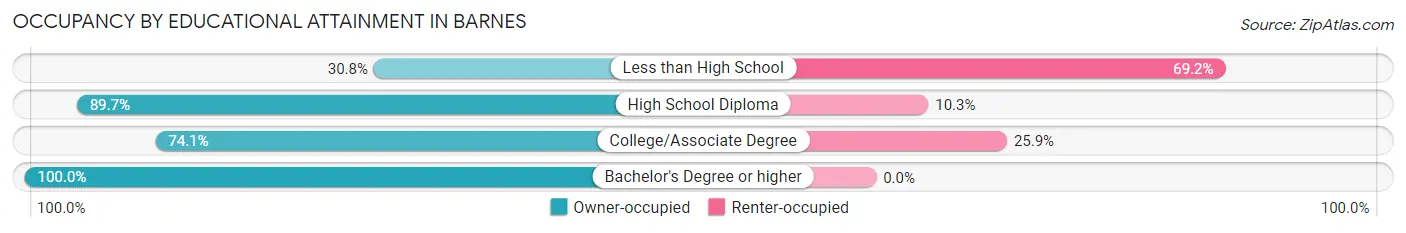
| Household Size | Owner-occupied | Renter-occupied |
| Less than High School | 4 (30.8%) | 9 (69.2%) |
| High School Diploma | 26 (89.7%) | 3 (10.3%) |
| College/Associate Degree | 20 (74.1%) | 7 (25.9%) |
| Bachelor's Degree or higher | 7 (100.0%) | 0 (0.0%) |
Occupancy by Age of Householder in Barnes
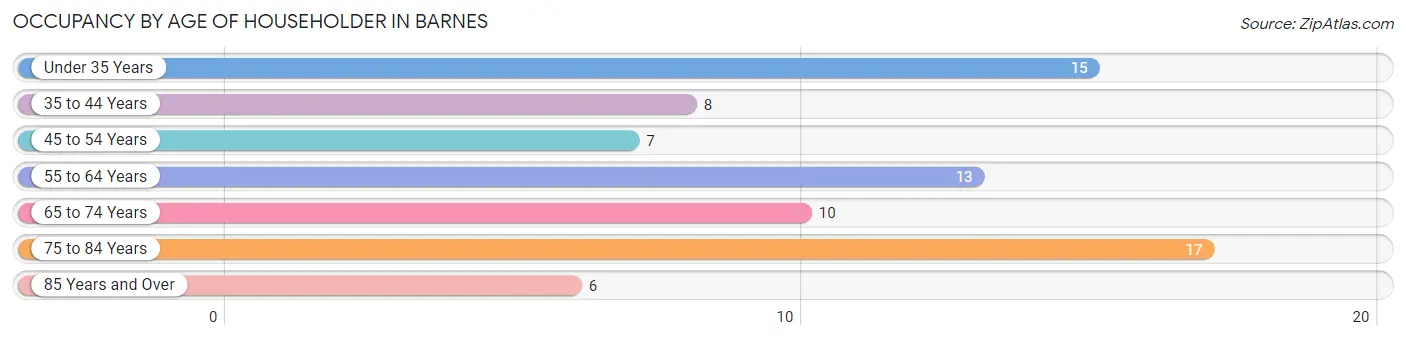
| Age Bracket | # Households | % Households |
| Under 35 Years | 15 | 19.7% |
| 35 to 44 Years | 8 | 10.5% |
| 45 to 54 Years | 7 | 9.2% |
| 55 to 64 Years | 13 | 17.1% |
| 65 to 74 Years | 10 | 13.2% |
| 75 to 84 Years | 17 | 22.4% |
| 85 Years and Over | 6 | 7.9% |
| Total | 76 | 100.0% |
Housing Finances in Barnes
Median Income by Occupancy in Barnes
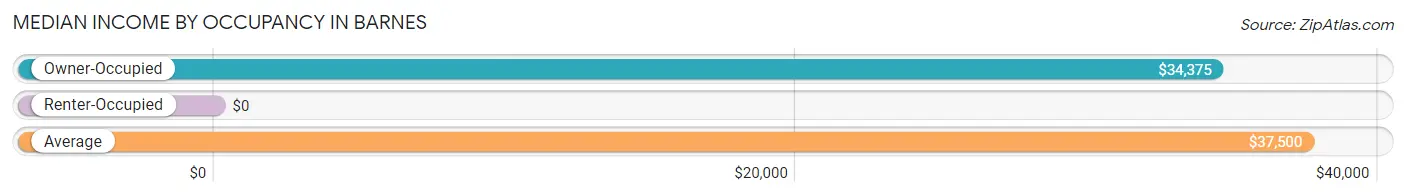
| Occupancy Type | # Households | Median Income |
| Owner-Occupied | 57 (75.0%) | $34,375 |
| Renter-Occupied | 19 (25.0%) | $0 |
| Average | 76 (100.0%) | $37,500 |
Occupancy by Householder Income Bracket in Barnes
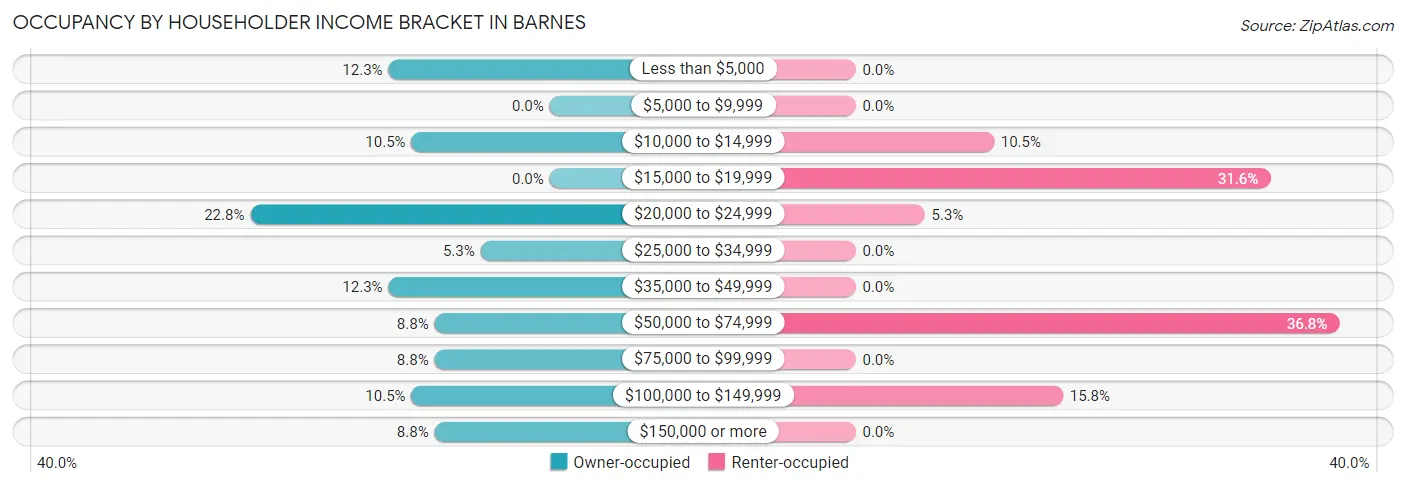
| Income Bracket | Owner-occupied | Renter-occupied |
| Less than $5,000 | 7 (12.3%) | 0 (0.0%) |
| $5,000 to $9,999 | 0 (0.0%) | 0 (0.0%) |
| $10,000 to $14,999 | 6 (10.5%) | 2 (10.5%) |
| $15,000 to $19,999 | 0 (0.0%) | 6 (31.6%) |
| $20,000 to $24,999 | 13 (22.8%) | 1 (5.3%) |
| $25,000 to $34,999 | 3 (5.3%) | 0 (0.0%) |
| $35,000 to $49,999 | 7 (12.3%) | 0 (0.0%) |
| $50,000 to $74,999 | 5 (8.8%) | 7 (36.8%) |
| $75,000 to $99,999 | 5 (8.8%) | 0 (0.0%) |
| $100,000 to $149,999 | 6 (10.5%) | 3 (15.8%) |
| $150,000 or more | 5 (8.8%) | 0 (0.0%) |
| Total | 57 (100.0%) | 19 (100.0%) |
Monthly Housing Cost Tiers in Barnes
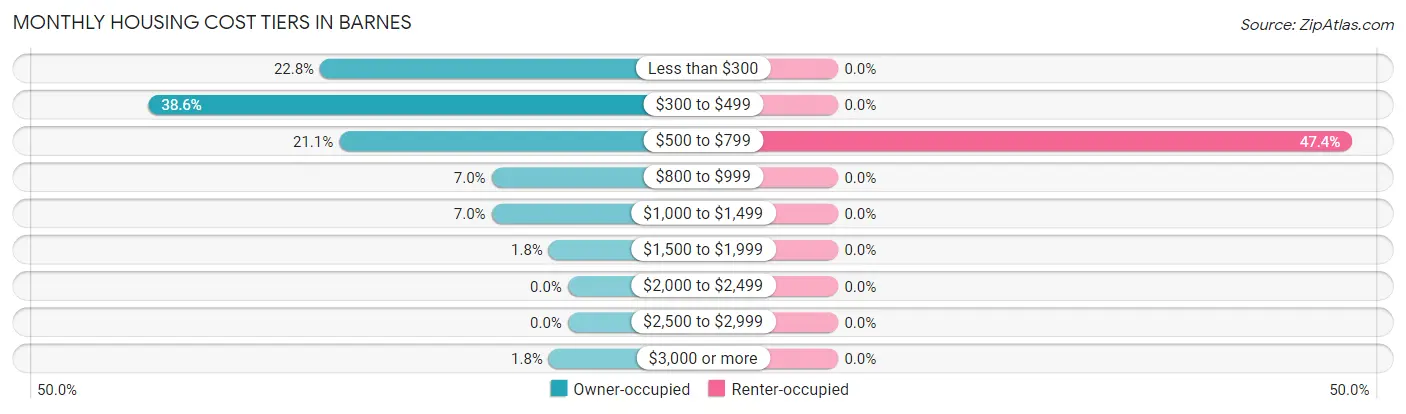
| Monthly Cost | Owner-occupied | Renter-occupied |
| Less than $300 | 13 (22.8%) | 0 (0.0%) |
| $300 to $499 | 22 (38.6%) | 0 (0.0%) |
| $500 to $799 | 12 (21.0%) | 9 (47.4%) |
| $800 to $999 | 4 (7.0%) | 0 (0.0%) |
| $1,000 to $1,499 | 4 (7.0%) | 0 (0.0%) |
| $1,500 to $1,999 | 1 (1.8%) | 0 (0.0%) |
| $2,000 to $2,499 | 0 (0.0%) | 0 (0.0%) |
| $2,500 to $2,999 | 0 (0.0%) | 0 (0.0%) |
| $3,000 or more | 1 (1.8%) | 0 (0.0%) |
| Total | 57 (100.0%) | 19 (100.0%) |
Physical Housing Characteristics in Barnes
Housing Structures in Barnes
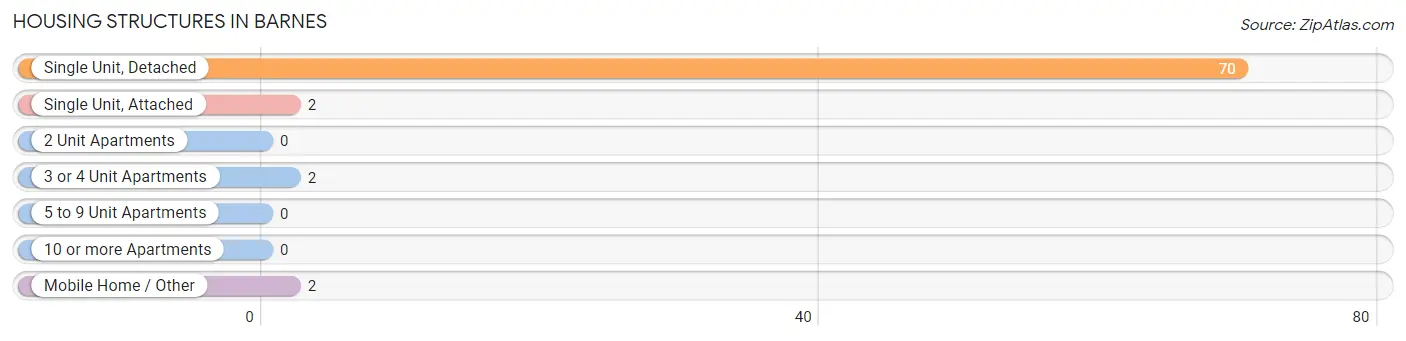
| Structure Type | # Housing Units | % Housing Units |
| Single Unit, Detached | 70 | 92.1% |
| Single Unit, Attached | 2 | 2.6% |
| 2 Unit Apartments | 0 | 0.0% |
| 3 or 4 Unit Apartments | 2 | 2.6% |
| 5 to 9 Unit Apartments | 0 | 0.0% |
| 10 or more Apartments | 0 | 0.0% |
| Mobile Home / Other | 2 | 2.6% |
| Total | 76 | 100.0% |
Housing Structures by Occupancy in Barnes
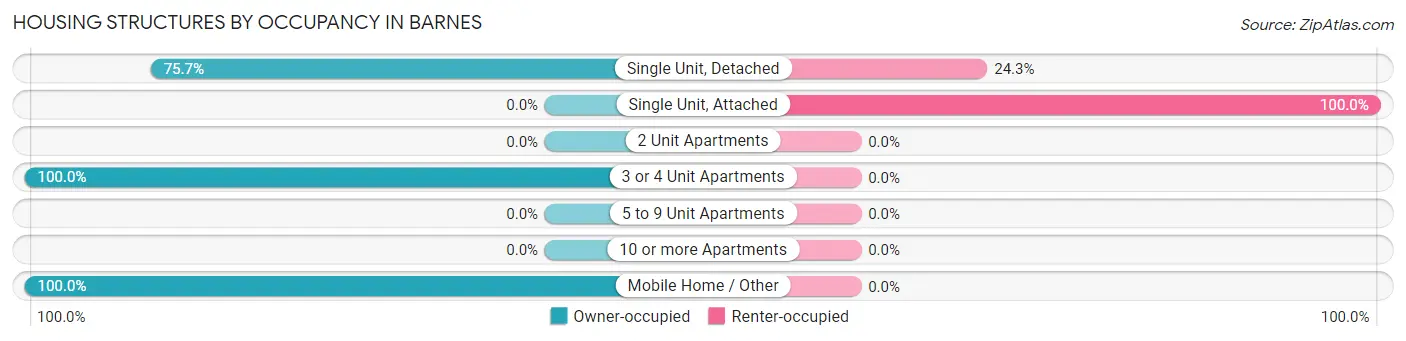
| Structure Type | Owner-occupied | Renter-occupied |
| Single Unit, Detached | 53 (75.7%) | 17 (24.3%) |
| Single Unit, Attached | 0 (0.0%) | 2 (100.0%) |
| 2 Unit Apartments | 0 (0.0%) | 0 (0.0%) |
| 3 or 4 Unit Apartments | 2 (100.0%) | 0 (0.0%) |
| 5 to 9 Unit Apartments | 0 (0.0%) | 0 (0.0%) |
| 10 or more Apartments | 0 (0.0%) | 0 (0.0%) |
| Mobile Home / Other | 2 (100.0%) | 0 (0.0%) |
| Total | 57 (75.0%) | 19 (25.0%) |
Housing Structures by Number of Rooms in Barnes
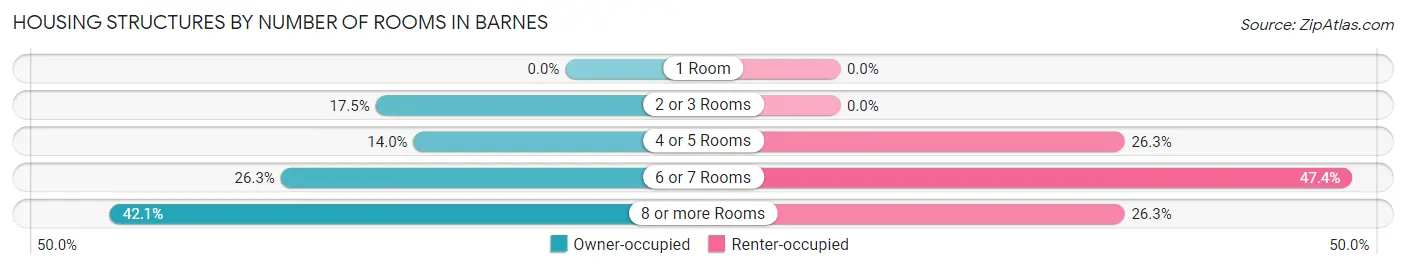
| Number of Rooms | Owner-occupied | Renter-occupied |
| 1 Room | 0 (0.0%) | 0 (0.0%) |
| 2 or 3 Rooms | 10 (17.5%) | 0 (0.0%) |
| 4 or 5 Rooms | 8 (14.0%) | 5 (26.3%) |
| 6 or 7 Rooms | 15 (26.3%) | 9 (47.4%) |
| 8 or more Rooms | 24 (42.1%) | 5 (26.3%) |
| Total | 57 (100.0%) | 19 (100.0%) |
Housing Structure by Heating Type in Barnes
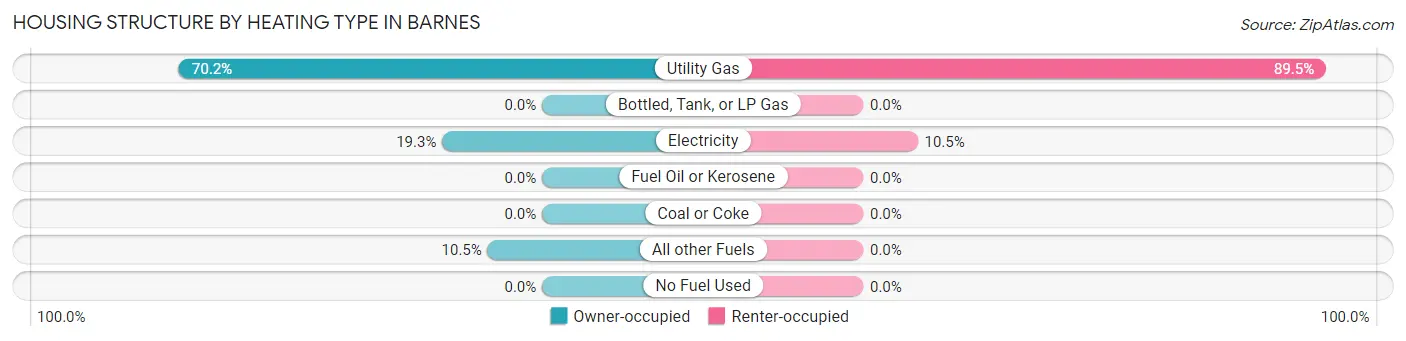
| Heating Type | Owner-occupied | Renter-occupied |
| Utility Gas | 40 (70.2%) | 17 (89.5%) |
| Bottled, Tank, or LP Gas | 0 (0.0%) | 0 (0.0%) |
| Electricity | 11 (19.3%) | 2 (10.5%) |
| Fuel Oil or Kerosene | 0 (0.0%) | 0 (0.0%) |
| Coal or Coke | 0 (0.0%) | 0 (0.0%) |
| All other Fuels | 6 (10.5%) | 0 (0.0%) |
| No Fuel Used | 0 (0.0%) | 0 (0.0%) |
| Total | 57 (100.0%) | 19 (100.0%) |
Household Vehicle Usage in Barnes
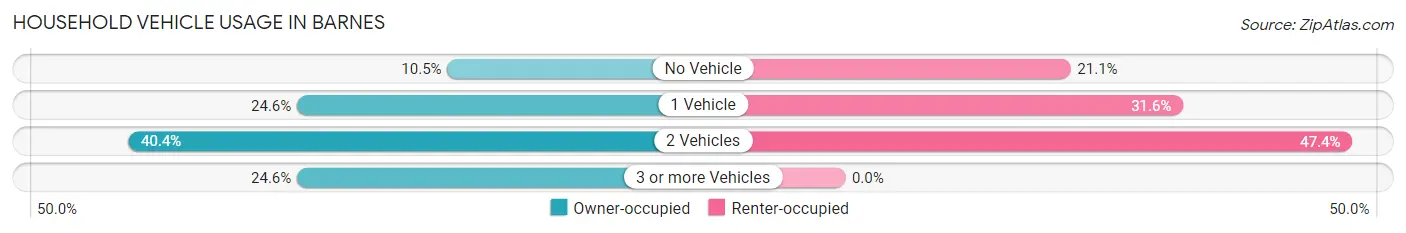
| Vehicles per Household | Owner-occupied | Renter-occupied |
| No Vehicle | 6 (10.5%) | 4 (21.0%) |
| 1 Vehicle | 14 (24.6%) | 6 (31.6%) |
| 2 Vehicles | 23 (40.4%) | 9 (47.4%) |
| 3 or more Vehicles | 14 (24.6%) | 0 (0.0%) |
| Total | 57 (100.0%) | 19 (100.0%) |
Real Estate & Mortgages in Barnes
Real Estate and Mortgage Overview in Barnes
| Characteristic | Without Mortgage | With Mortgage |
| Housing Units | 38 | 19 |
| Median Property Value | $50,000 | $44,200 |
| Median Household Income | $24,167 | $3 |
| Monthly Housing Costs | $423 | $0 |
| Real Estate Taxes | $733 | $0 |
Property Value by Mortgage Status in Barnes
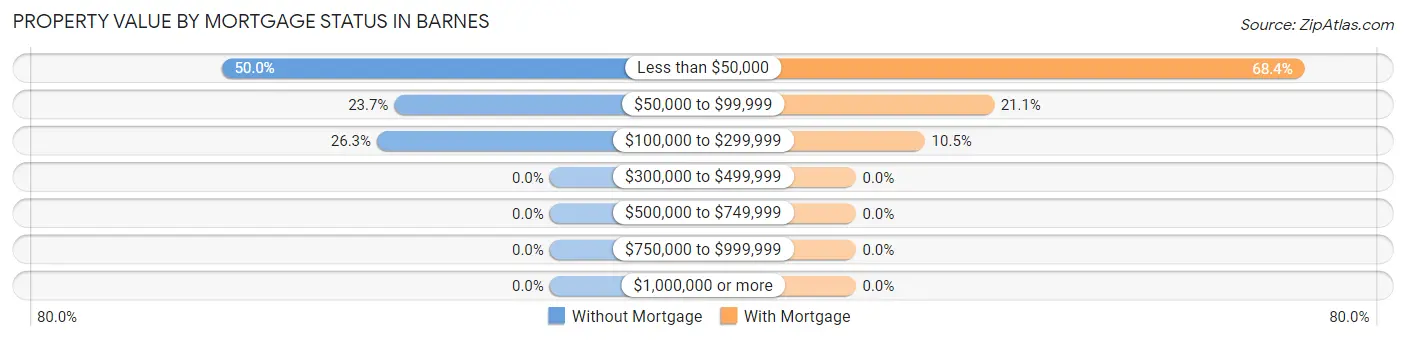
| Property Value | Without Mortgage | With Mortgage |
| Less than $50,000 | 19 (50.0%) | 13 (68.4%) |
| $50,000 to $99,999 | 9 (23.7%) | 4 (21.0%) |
| $100,000 to $299,999 | 10 (26.3%) | 2 (10.5%) |
| $300,000 to $499,999 | 0 (0.0%) | 0 (0.0%) |
| $500,000 to $749,999 | 0 (0.0%) | 0 (0.0%) |
| $750,000 to $999,999 | 0 (0.0%) | 0 (0.0%) |
| $1,000,000 or more | 0 (0.0%) | 0 (0.0%) |
| Total | 38 (100.0%) | 19 (100.0%) |
Household Income by Mortgage Status in Barnes
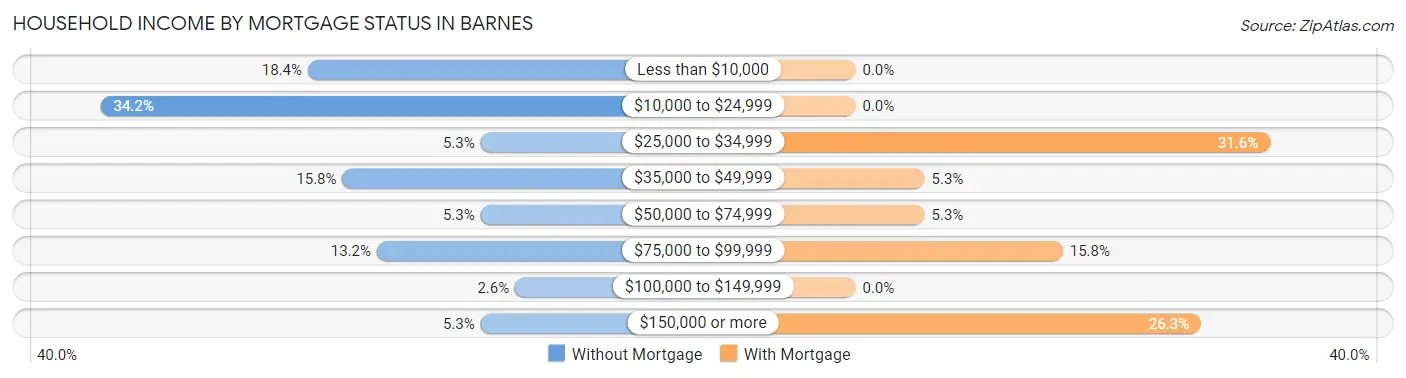
| Household Income | Without Mortgage | With Mortgage |
| Less than $10,000 | 7 (18.4%) | 0 (0.0%) |
| $10,000 to $24,999 | 13 (34.2%) | 0 (0.0%) |
| $25,000 to $34,999 | 2 (5.3%) | 6 (31.6%) |
| $35,000 to $49,999 | 6 (15.8%) | 1 (5.3%) |
| $50,000 to $74,999 | 2 (5.3%) | 1 (5.3%) |
| $75,000 to $99,999 | 5 (13.2%) | 3 (15.8%) |
| $100,000 to $149,999 | 1 (2.6%) | 0 (0.0%) |
| $150,000 or more | 2 (5.3%) | 5 (26.3%) |
| Total | 38 (100.0%) | 19 (100.0%) |
Property Value to Household Income Ratio in Barnes
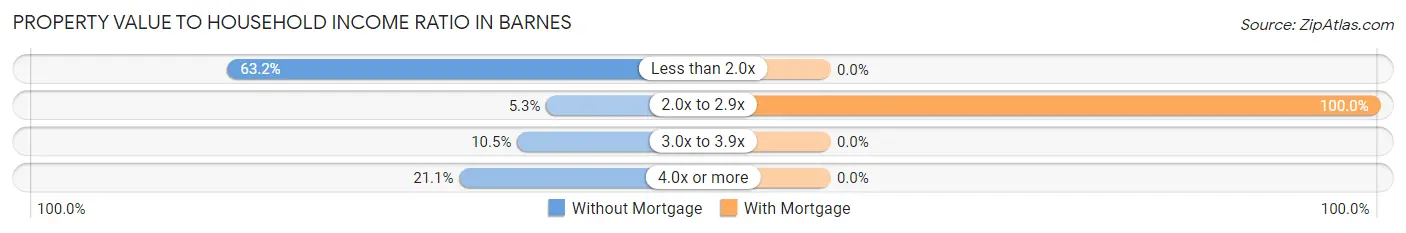
| Value-to-Income Ratio | Without Mortgage | With Mortgage |
| Less than 2.0x | 24 (63.2%) | 0 (0.0%) |
| 2.0x to 2.9x | 2 (5.3%) | 19 (100.0%) |
| 3.0x to 3.9x | 4 (10.5%) | 0 (0.0%) |
| 4.0x or more | 8 (21.0%) | 0 (0.0%) |
| Total | 38 (100.0%) | 19 (100.0%) |
Real Estate Taxes by Mortgage Status in Barnes
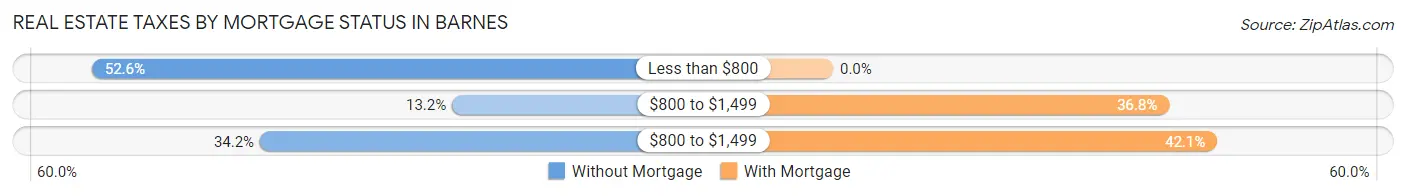
| Property Taxes | Without Mortgage | With Mortgage |
| Less than $800 | 20 (52.6%) | 0 (0.0%) |
| $800 to $1,499 | 5 (13.2%) | 7 (36.8%) |
| $800 to $1,499 | 13 (34.2%) | 8 (42.1%) |
| Total | 38 (100.0%) | 19 (100.0%) |
Health & Disability in Barnes
Health Insurance Coverage by Age in Barnes
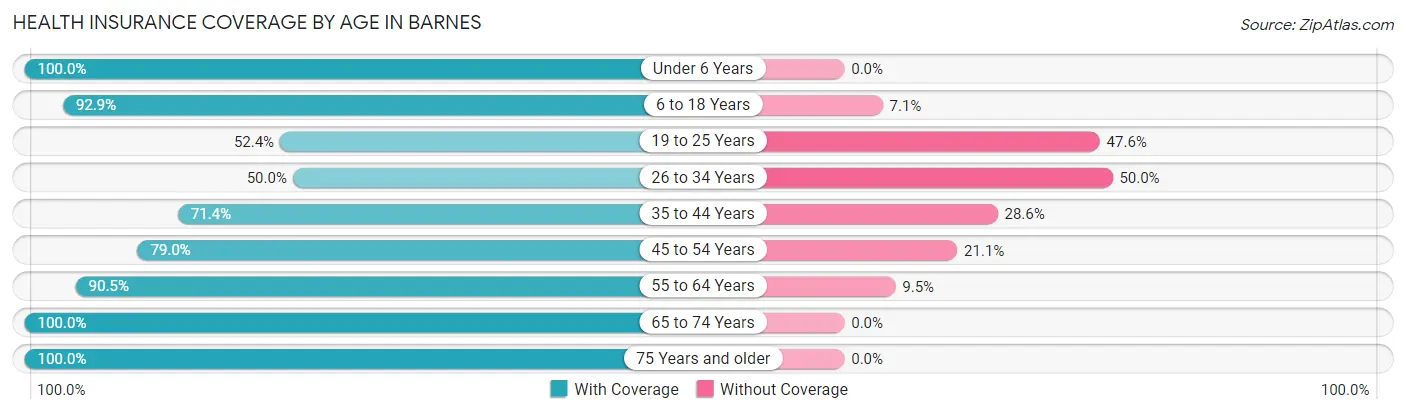
| Age Bracket | With Coverage | Without Coverage |
| Under 6 Years | 8 (100.0%) | 0 (0.0%) |
| 6 to 18 Years | 13 (92.9%) | 1 (7.1%) |
| 19 to 25 Years | 11 (52.4%) | 10 (47.6%) |
| 26 to 34 Years | 4 (50.0%) | 4 (50.0%) |
| 35 to 44 Years | 10 (71.4%) | 4 (28.6%) |
| 45 to 54 Years | 15 (78.9%) | 4 (21.0%) |
| 55 to 64 Years | 19 (90.5%) | 2 (9.5%) |
| 65 to 74 Years | 17 (100.0%) | 0 (0.0%) |
| 75 Years and older | 28 (100.0%) | 0 (0.0%) |
| Total | 125 (83.3%) | 25 (16.7%) |
Health Insurance Coverage by Citizenship Status in Barnes
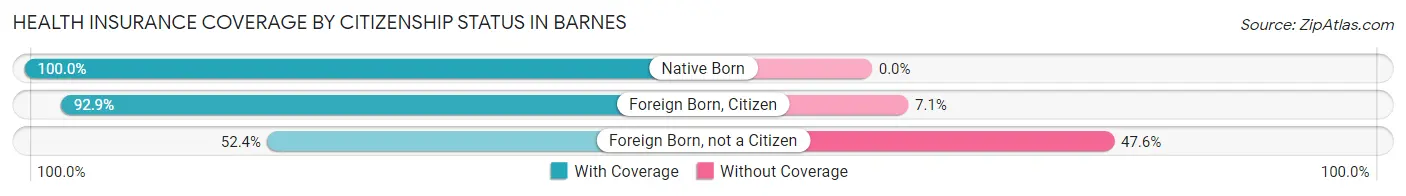
| Citizenship Status | With Coverage | Without Coverage |
| Native Born | 8 (100.0%) | 0 (0.0%) |
| Foreign Born, Citizen | 13 (92.9%) | 1 (7.1%) |
| Foreign Born, not a Citizen | 11 (52.4%) | 10 (47.6%) |
Health Insurance Coverage by Household Income in Barnes
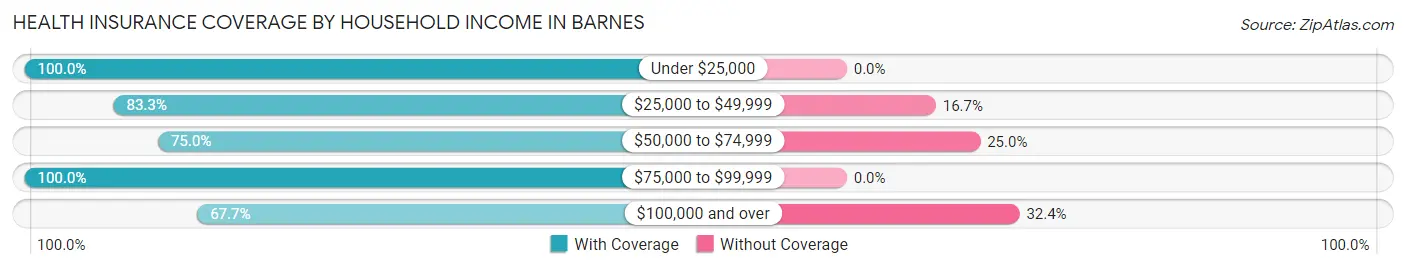
| Household Income | With Coverage | Without Coverage |
| Under $25,000 | 39 (100.0%) | 0 (0.0%) |
| $25,000 to $49,999 | 20 (83.3%) | 4 (16.7%) |
| $50,000 to $74,999 | 30 (75.0%) | 10 (25.0%) |
| $75,000 to $99,999 | 13 (100.0%) | 0 (0.0%) |
| $100,000 and over | 23 (67.6%) | 11 (32.4%) |
Public vs Private Health Insurance Coverage by Age in Barnes
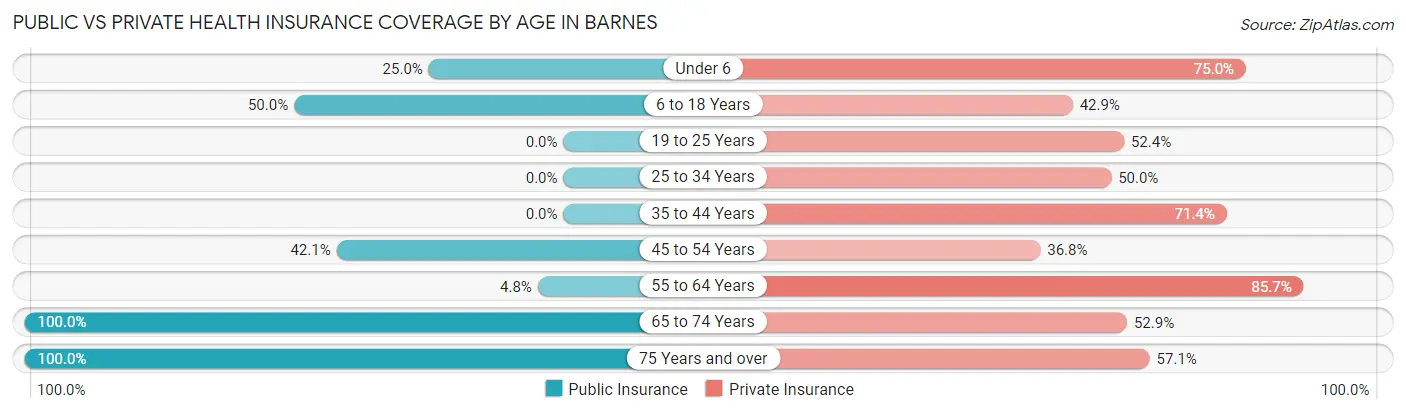
| Age Bracket | Public Insurance | Private Insurance |
| Under 6 | 2 (25.0%) | 6 (75.0%) |
| 6 to 18 Years | 7 (50.0%) | 6 (42.9%) |
| 19 to 25 Years | 0 (0.0%) | 11 (52.4%) |
| 25 to 34 Years | 0 (0.0%) | 4 (50.0%) |
| 35 to 44 Years | 0 (0.0%) | 10 (71.4%) |
| 45 to 54 Years | 8 (42.1%) | 7 (36.8%) |
| 55 to 64 Years | 1 (4.8%) | 18 (85.7%) |
| 65 to 74 Years | 17 (100.0%) | 9 (52.9%) |
| 75 Years and over | 28 (100.0%) | 16 (57.1%) |
| Total | 63 (42.0%) | 87 (58.0%) |
Disability Status by Sex by Age in Barnes
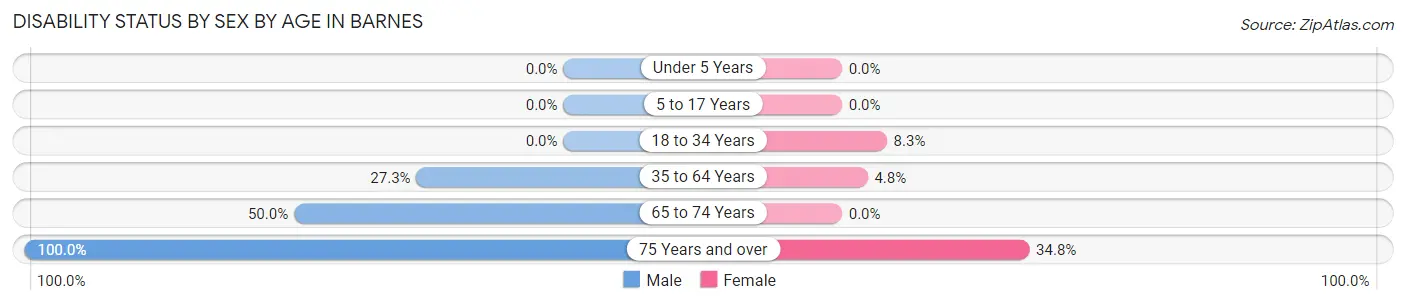
| Age Bracket | Male | Female |
| Under 5 Years | 0 (0.0%) | 0 (0.0%) |
| 5 to 17 Years | 0 (0.0%) | 0 (0.0%) |
| 18 to 34 Years | 0 (0.0%) | 1 (8.3%) |
| 35 to 64 Years | 9 (27.3%) | 1 (4.8%) |
| 65 to 74 Years | 4 (50.0%) | 0 (0.0%) |
| 75 Years and over | 5 (100.0%) | 8 (34.8%) |
Disability Class by Sex by Age in Barnes
Disability Class: Hearing Difficulty
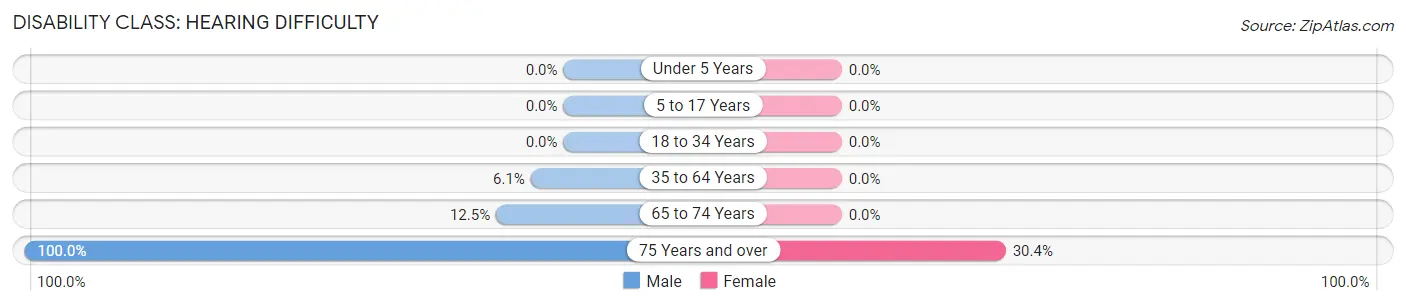
| Age Bracket | Male | Female |
| Under 5 Years | 0 (0.0%) | 0 (0.0%) |
| 5 to 17 Years | 0 (0.0%) | 0 (0.0%) |
| 18 to 34 Years | 0 (0.0%) | 0 (0.0%) |
| 35 to 64 Years | 2 (6.1%) | 0 (0.0%) |
| 65 to 74 Years | 1 (12.5%) | 0 (0.0%) |
| 75 Years and over | 5 (100.0%) | 7 (30.4%) |
Disability Class: Vision Difficulty
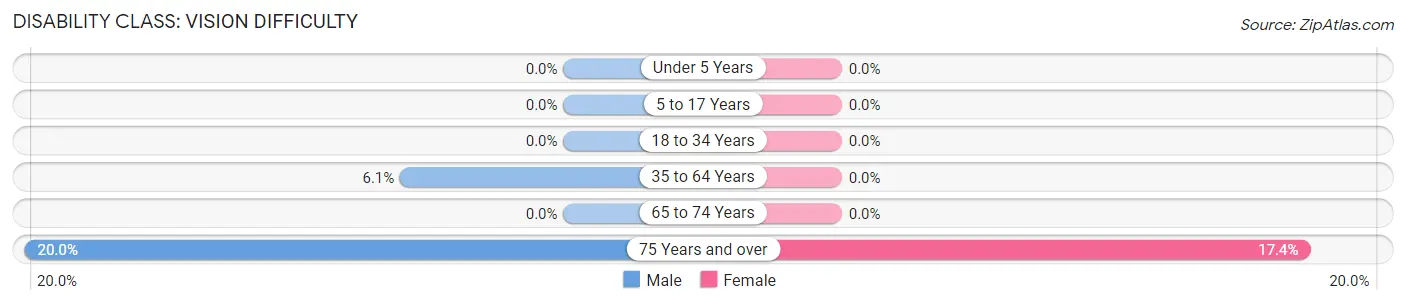
| Age Bracket | Male | Female |
| Under 5 Years | 0 (0.0%) | 0 (0.0%) |
| 5 to 17 Years | 0 (0.0%) | 0 (0.0%) |
| 18 to 34 Years | 0 (0.0%) | 0 (0.0%) |
| 35 to 64 Years | 2 (6.1%) | 0 (0.0%) |
| 65 to 74 Years | 0 (0.0%) | 0 (0.0%) |
| 75 Years and over | 1 (20.0%) | 4 (17.4%) |
Disability Class: Cognitive Difficulty
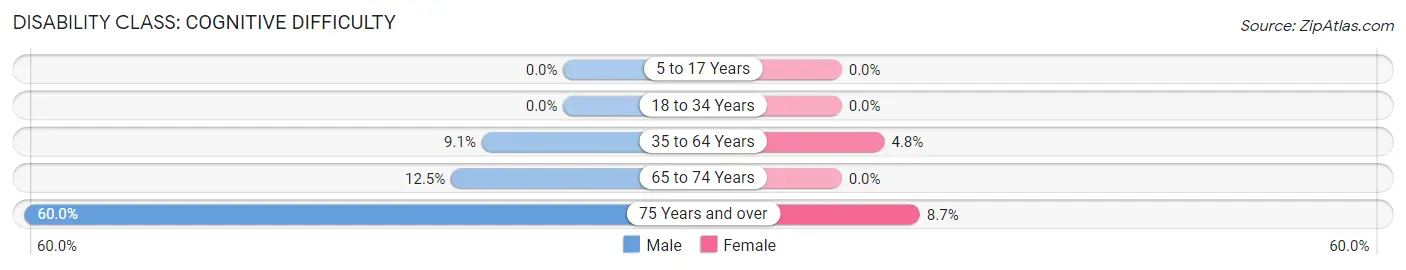
| Age Bracket | Male | Female |
| 5 to 17 Years | 0 (0.0%) | 0 (0.0%) |
| 18 to 34 Years | 0 (0.0%) | 0 (0.0%) |
| 35 to 64 Years | 3 (9.1%) | 1 (4.8%) |
| 65 to 74 Years | 1 (12.5%) | 0 (0.0%) |
| 75 Years and over | 3 (60.0%) | 2 (8.7%) |
Disability Class: Ambulatory Difficulty
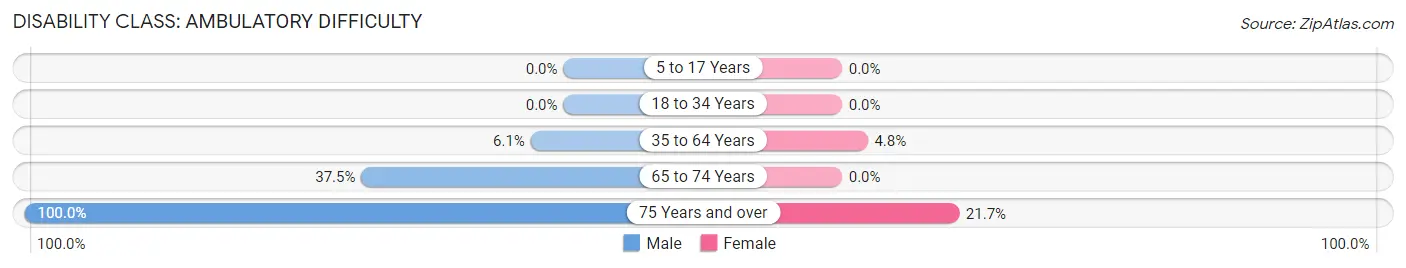
| Age Bracket | Male | Female |
| 5 to 17 Years | 0 (0.0%) | 0 (0.0%) |
| 18 to 34 Years | 0 (0.0%) | 0 (0.0%) |
| 35 to 64 Years | 2 (6.1%) | 1 (4.8%) |
| 65 to 74 Years | 3 (37.5%) | 0 (0.0%) |
| 75 Years and over | 5 (100.0%) | 5 (21.7%) |
Disability Class: Self-Care Difficulty
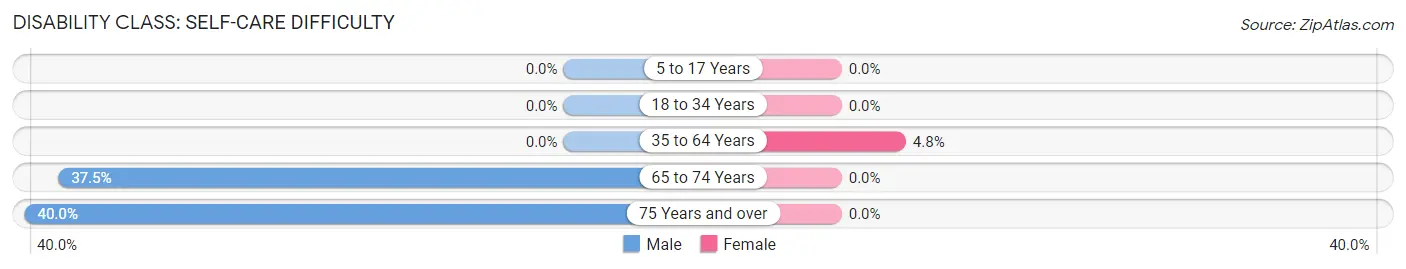
| Age Bracket | Male | Female |
| 5 to 17 Years | 0 (0.0%) | 0 (0.0%) |
| 18 to 34 Years | 0 (0.0%) | 0 (0.0%) |
| 35 to 64 Years | 0 (0.0%) | 1 (4.8%) |
| 65 to 74 Years | 3 (37.5%) | 0 (0.0%) |
| 75 Years and over | 2 (40.0%) | 0 (0.0%) |
Technology Access in Barnes
Computing Device Access in Barnes
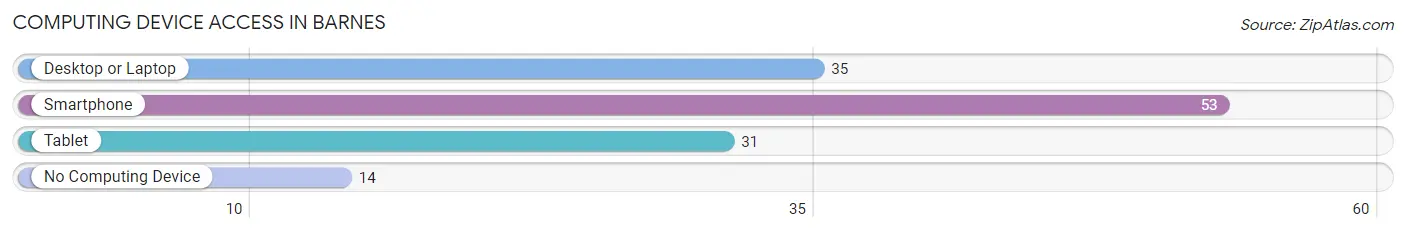
| Device Type | # Households | % Households |
| Desktop or Laptop | 35 | 46.1% |
| Smartphone | 53 | 69.7% |
| Tablet | 31 | 40.8% |
| No Computing Device | 14 | 18.4% |
| Total | 76 | 100.0% |
Internet Access in Barnes
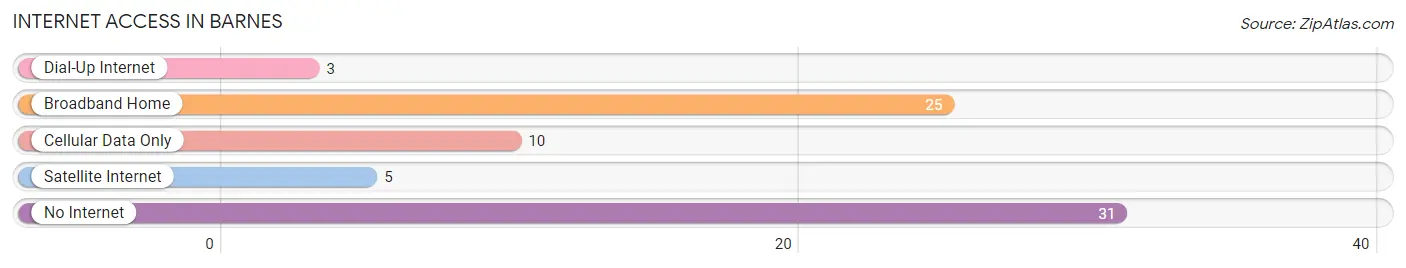
| Internet Type | # Households | % Households |
| Dial-Up Internet | 3 | 4.0% |
| Broadband Home | 25 | 32.9% |
| Cellular Data Only | 10 | 13.2% |
| Satellite Internet | 5 | 6.6% |
| No Internet | 31 | 40.8% |
| Total | 76 | 100.0% |
Barnes Summary
Barnes is a small town located in the state of Kansas, in the United States of America. It is situated in the northwest corner of the state, in the county of Phillips. The town has a population of approximately 200 people, and is located on the banks of the Republican River.
History
Barnes was founded in 1887 by a group of settlers from the nearby town of Phillipsburg. The town was named after the first settler, William Barnes, who had purchased the land from the government. The town was originally a farming community, and the main crops grown were wheat, corn, and oats. The town also had a small sawmill, which provided lumber for the construction of homes and other buildings.
In the early 1900s, the town began to grow and prosper. The railroad was extended to Barnes in 1906, and this allowed for the transportation of goods and people to and from the town. The railroad also allowed for the development of a small business district, which included a general store, a post office, and a bank.
Geography
Barnes is located in the northwest corner of Kansas, in Phillips County. The town is situated on the banks of the Republican River, and is surrounded by rolling hills and prairies. The town is located approximately 30 miles from the state capital of Topeka, and is about an hour and a half drive from the larger city of Kansas City.
The climate in Barnes is typical of the Midwest, with hot summers and cold winters. The average temperature in the summer is around 80 degrees Fahrenheit, and the average temperature in the winter is around 20 degrees Fahrenheit. The town receives an average of 30 inches of precipitation each year, with most of it falling in the spring and summer months.
Economy
The economy of Barnes is largely based on agriculture. The town is home to several farms, which produce a variety of crops, including wheat, corn, and oats. The town also has a small business district, which includes a general store, a post office, and a bank.
In recent years, the town has seen an increase in tourism. The town is home to several historic sites, including the old railroad depot and the original town hall. The town also has several parks and recreational areas, which attract visitors from all over the state.
Demographics
As of the 2010 census, the population of Barnes was approximately 200 people. The town is predominantly white, with a small percentage of African Americans and Hispanics. The median household income in the town is around $35,000, and the median age is around 40 years old.
Conclusion
Barnes is a small town located in the northwest corner of Kansas. The town has a population of approximately 200 people, and is largely based on agriculture. The town has a small business district, and is home to several historic sites and recreational areas. The town is predominantly white, with a small percentage of African Americans and Hispanics. The median household income in the town is around $35,000, and the median age is around 40 years old.
Common Questions
What is Per Capita Income in Barnes?
Per Capita income in Barnes is $30,941.
What is the Median Family Income in Barnes?
Median Family Income in Barnes is $52,500.
What is the Median Household income in Barnes?
Median Household Income in Barnes is $37,500.
What is Income or Wage Gap in Barnes?
Income or Wage Gap in Barnes is 30.1%.
Women in Barnes earn 69.9 cents for every dollar earned by a man.
What is Inequality or Gini Index in Barnes?
Inequality or Gini Index in Barnes is 0.54.
What is the Total Population of Barnes?
Total Population of Barnes is 150.
What is the Total Male Population of Barnes?
Total Male Population of Barnes is 82.
What is the Total Female Population of Barnes?
Total Female Population of Barnes is 68.
What is the Ratio of Males per 100 Females in Barnes?
There are 120.59 Males per 100 Females in Barnes.
What is the Ratio of Females per 100 Males in Barnes?
There are 82.93 Females per 100 Males in Barnes.
What is the Median Population Age in Barnes?
Median Population Age in Barnes is 54.1 Years.
What is the Average Family Size in Barnes
Average Family Size in Barnes is 2.9 People.
What is the Average Household Size in Barnes
Average Household Size in Barnes is 2.0 People.
How Large is the Labor Force in Barnes?
There are 72 People in the Labor Forcein in Barnes.
What is the Percentage of People in the Labor Force in Barnes?
54.1% of People are in the Labor Force in Barnes.