Belpre, KS Map & Demographics
Belpre Map
Belpre Overview
$21,755
PER CAPITA INCOME
$40,938
AVG FAMILY INCOME
$29,063
AVG HOUSEHOLD INCOME
0.27
INEQUALITY / GINI INDEX
38
TOTAL POPULATION
15
MALE POPULATION
23
FEMALE POPULATION
65.22
MALES / 100 FEMALES
153.33
FEMALES / 100 MALES
54.5
MEDIAN AGE
2.9
AVG FAMILY SIZE
1.5
AVG HOUSEHOLD SIZE
24
LABOR FORCE [ PEOPLE ]
72.7%
PERCENT IN LABOR FORCE
8.3%
UNEMPLOYMENT RATE
Belpre Zip Codes
Belpre Area Codes
Income in Belpre
Income Overview in Belpre
Per Capita Income in Belpre is $21,755, while median incomes of families and households are $40,938 and $29,063 respectively.
| Characteristic | Number | Measure |
| Per Capita Income | 38 | $21,755 |
| Median Family Income | 7 | $40,938 |
| Mean Family Income | 7 | $38,500 |
| Median Household Income | 25 | $29,063 |
| Mean Household Income | 25 | $31,916 |
| Income Deficit | 7 | $0 |
| Wage / Income Gap (%) | 38 | 0.00% |
| Wage / Income Gap ($) | 38 | 100.00¢ per $1 |
| Gini / Inequality Index | 38 | 0.27 |
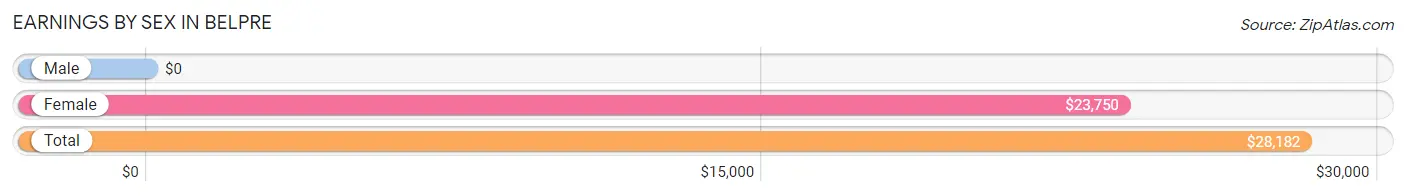
Earnings by Sex in Belpre
| Sex | Number | Average Earnings |
| Male | 6 (25.0%) | $0 |
| Female | 18 (75.0%) | $23,750 |
| Total | 24 (100.0%) | $28,182 |
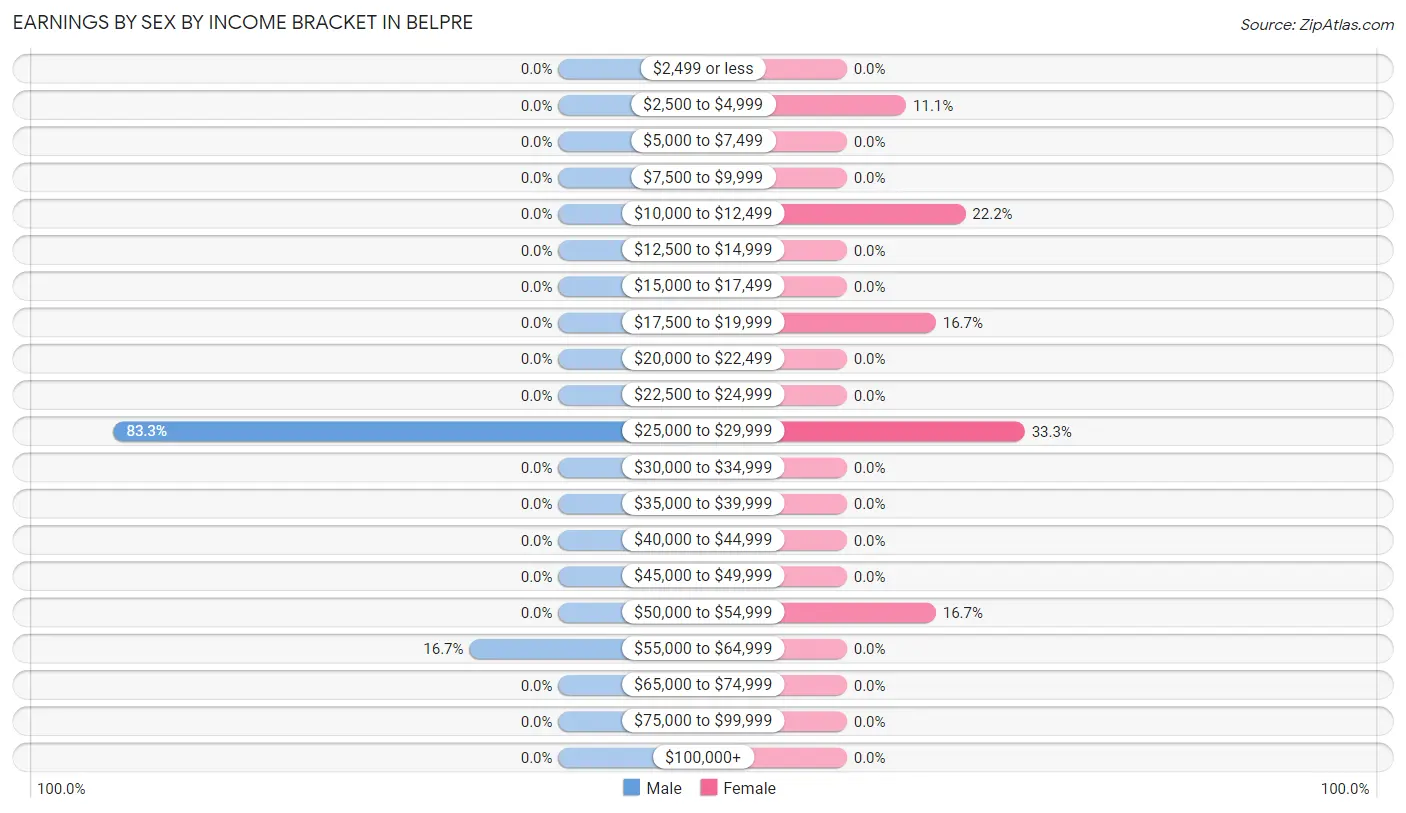
Earnings by Sex by Income Bracket in Belpre
The most common earnings brackets in Belpre are $25,000 to $29,999 for men (5 | 83.3%) and $25,000 to $29,999 for women (6 | 33.3%).
| Income | Male | Female |
| $2,499 or less | 0 (0.0%) | 0 (0.0%) |
| $2,500 to $4,999 | 0 (0.0%) | 2 (11.1%) |
| $5,000 to $7,499 | 0 (0.0%) | 0 (0.0%) |
| $7,500 to $9,999 | 0 (0.0%) | 0 (0.0%) |
| $10,000 to $12,499 | 0 (0.0%) | 4 (22.2%) |
| $12,500 to $14,999 | 0 (0.0%) | 0 (0.0%) |
| $15,000 to $17,499 | 0 (0.0%) | 0 (0.0%) |
| $17,500 to $19,999 | 0 (0.0%) | 3 (16.7%) |
| $20,000 to $22,499 | 0 (0.0%) | 0 (0.0%) |
| $22,500 to $24,999 | 0 (0.0%) | 0 (0.0%) |
| $25,000 to $29,999 | 5 (83.3%) | 6 (33.3%) |
| $30,000 to $34,999 | 0 (0.0%) | 0 (0.0%) |
| $35,000 to $39,999 | 0 (0.0%) | 0 (0.0%) |
| $40,000 to $44,999 | 0 (0.0%) | 0 (0.0%) |
| $45,000 to $49,999 | 0 (0.0%) | 0 (0.0%) |
| $50,000 to $54,999 | 0 (0.0%) | 3 (16.7%) |
| $55,000 to $64,999 | 1 (16.7%) | 0 (0.0%) |
| $65,000 to $74,999 | 0 (0.0%) | 0 (0.0%) |
| $75,000 to $99,999 | 0 (0.0%) | 0 (0.0%) |
| $100,000+ | 0 (0.0%) | 0 (0.0%) |
| Total | 6 (100.0%) | 18 (100.0%) |
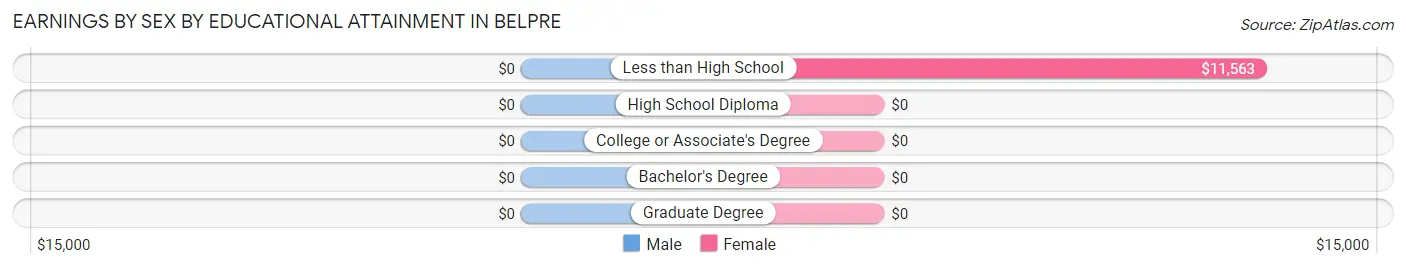
Earnings by Sex by Educational Attainment in Belpre
| Educational Attainment | Male Income | Female Income |
| Less than High School | - | - |
| High School Diploma | - | - |
| College or Associate's Degree | - | - |
| Bachelor's Degree | - | - |
| Graduate Degree | - | - |
| Total | - | - |
Family Income in Belpre
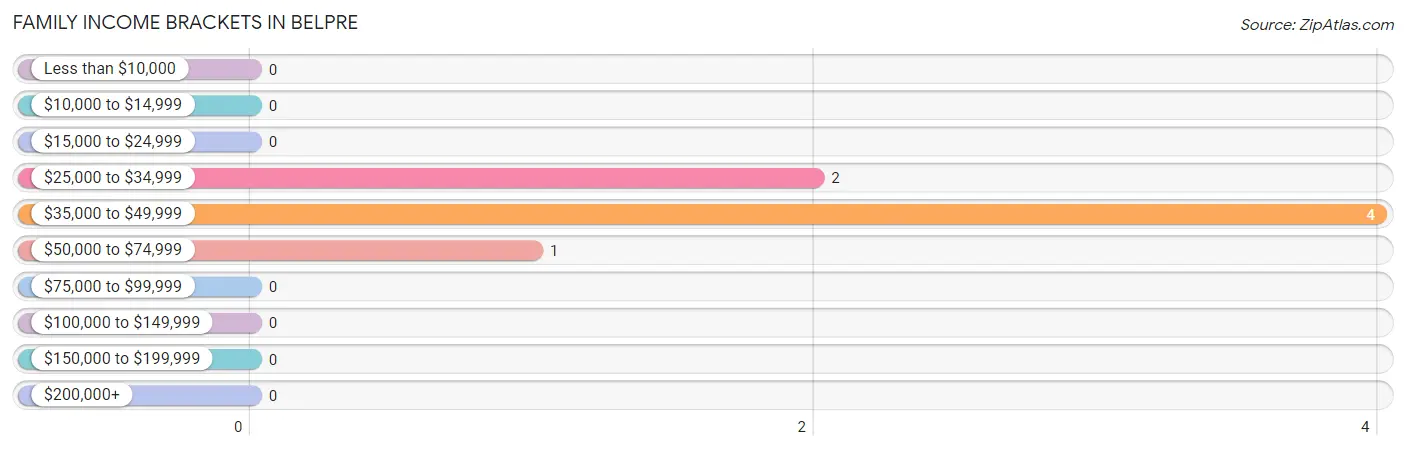
Family Income Brackets in Belpre
According to the Belpre family income data, there are 4 families falling into the $35,000 to $49,999 income range, which is the most common income bracket and makes up 57.1% of all families.
| Income Bracket | # Families | % Families |
| Less than $10,000 | 0 | 0.0% |
| $10,000 to $14,999 | 0 | 0.0% |
| $15,000 to $24,999 | 0 | 0.0% |
| $25,000 to $34,999 | 2 | 28.6% |
| $35,000 to $49,999 | 4 | 57.1% |
| $50,000 to $74,999 | 1 | 14.3% |
| $75,000 to $99,999 | 0 | 0.0% |
| $100,000 to $149,999 | 0 | 0.0% |
| $150,000 to $199,999 | 0 | 0.0% |
| $200,000+ | 0 | 0.0% |
Family Income by Famaliy Size in Belpre
| Income Bracket | # Families | Median Income |
| 2-Person Families | 3 (42.9%) | $0 |
| 3-Person Families | 4 (57.1%) | $0 |
| 4-Person Families | 0 (0.0%) | $0 |
| 5-Person Families | 0 (0.0%) | $0 |
| 6-Person Families | 0 (0.0%) | $0 |
| 7+ Person Families | 0 (0.0%) | $0 |
| Total | 7 (100.0%) | $40,938 |
Family Income by Number of Earners in Belpre
| Number of Earners | # Families | Median Income |
| No Earners | 2 (28.6%) | $0 |
| 1 Earner | 1 (14.3%) | $0 |
| 2 Earners | 4 (57.1%) | $0 |
| 3+ Earners | 0 (0.0%) | $0 |
| Total | 7 (100.0%) | $40,938 |
Household Income in Belpre
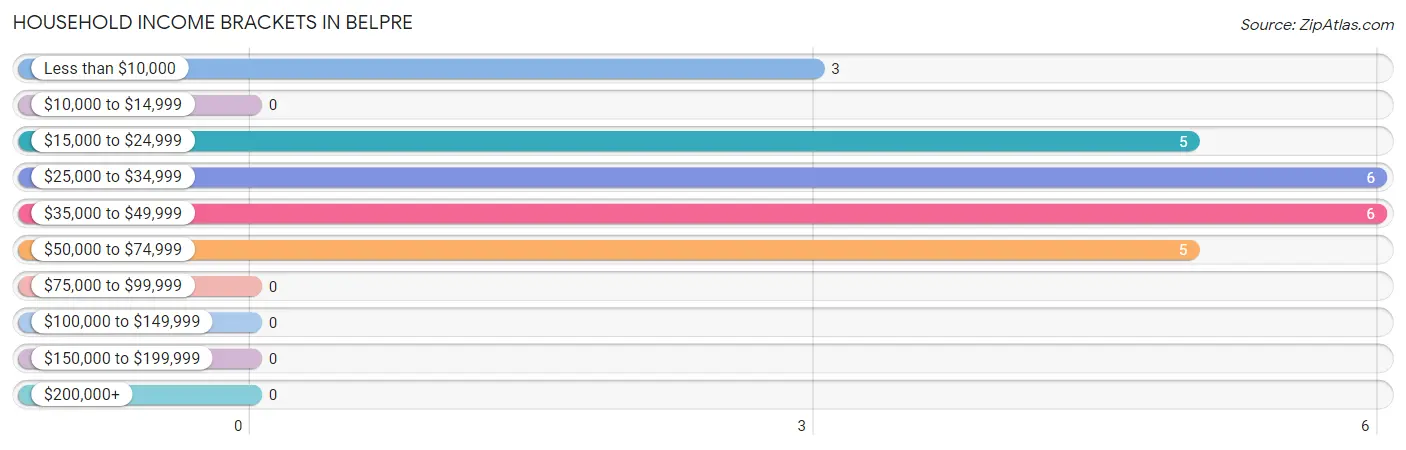
Household Income Brackets in Belpre
With 6 households falling in the category, the $25,000 to $34,999 income range is the most frequent in Belpre, accounting for 24.0% of all households.
| Income Bracket | # Households | % Households |
| Less than $10,000 | 3 | 12.0% |
| $10,000 to $14,999 | 0 | 0.0% |
| $15,000 to $24,999 | 5 | 20.0% |
| $25,000 to $34,999 | 6 | 24.0% |
| $35,000 to $49,999 | 6 | 24.0% |
| $50,000 to $74,999 | 5 | 20.0% |
| $75,000 to $99,999 | 0 | 0.0% |
| $100,000 to $149,999 | 0 | 0.0% |
| $150,000 to $199,999 | 0 | 0.0% |
| $200,000+ | 0 | 0.0% |
Household Income by Householder Age in Belpre
The median household income in Belpre is $29,063, with the highest median household income of $45,625 found in the 65+ years age bracket for the primary householder. A total of 11 households (44.0%) fall into this category.
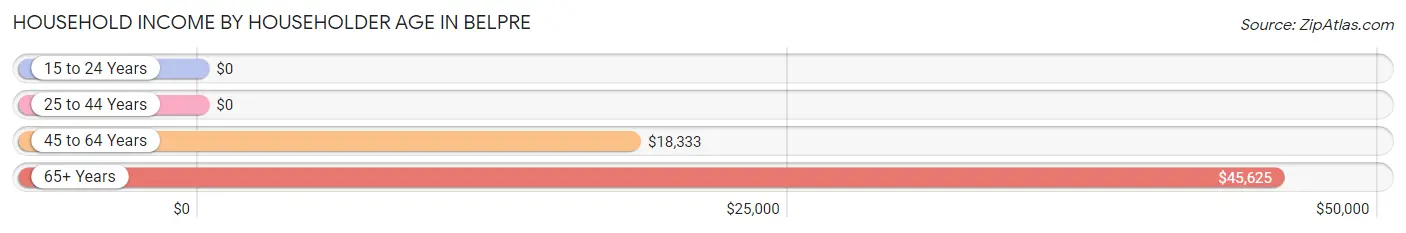
| Income Bracket | # Households | Median Income |
| 15 to 24 Years | 0 (0.0%) | $0 |
| 25 to 44 Years | 8 (32.0%) | $0 |
| 45 to 64 Years | 6 (24.0%) | $18,333 |
| 65+ Years | 11 (44.0%) | $45,625 |
| Total | 25 (100.0%) | $29,063 |
Poverty in Belpre
Income Below Poverty by Sex and Age in Belpre
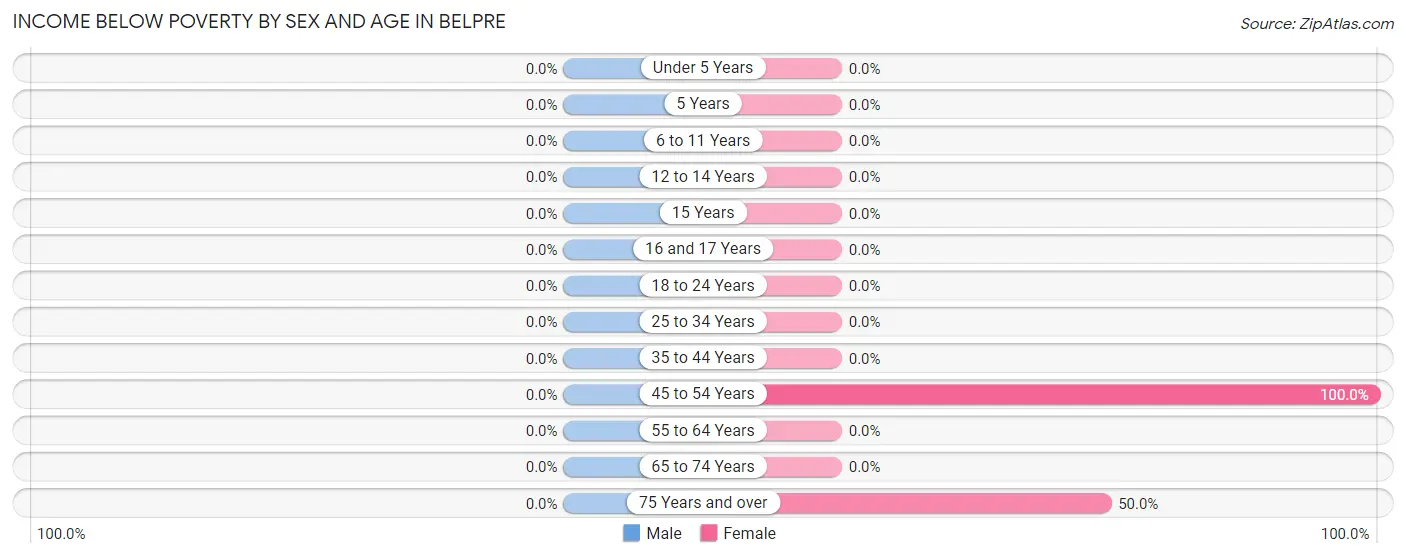
| Age Bracket | Male | Female |
| Under 5 Years | 0 (0.0%) | 0 (0.0%) |
| 5 Years | 0 (0.0%) | 0 (0.0%) |
| 6 to 11 Years | 0 (0.0%) | 0 (0.0%) |
| 12 to 14 Years | 0 (0.0%) | 0 (0.0%) |
| 15 Years | 0 (0.0%) | 0 (0.0%) |
| 16 and 17 Years | 0 (0.0%) | 0 (0.0%) |
| 18 to 24 Years | 0 (0.0%) | 0 (0.0%) |
| 25 to 34 Years | 0 (0.0%) | 0 (0.0%) |
| 35 to 44 Years | 0 (0.0%) | 0 (0.0%) |
| 45 to 54 Years | 0 (0.0%) | 2 (100.0%) |
| 55 to 64 Years | 0 (0.0%) | 0 (0.0%) |
| 65 to 74 Years | 0 (0.0%) | 0 (0.0%) |
| 75 Years and over | 0 (0.0%) | 1 (50.0%) |
| Total | 0 (0.0%) | 3 (13.0%) |
Income Above Poverty by Sex and Age in Belpre
According to the poverty statistics in Belpre, males aged 12 to 14 years and females aged 25 to 34 years are the age groups that are most secure financially, with 100.0% of males and 100.0% of females in these age groups living above the poverty line.
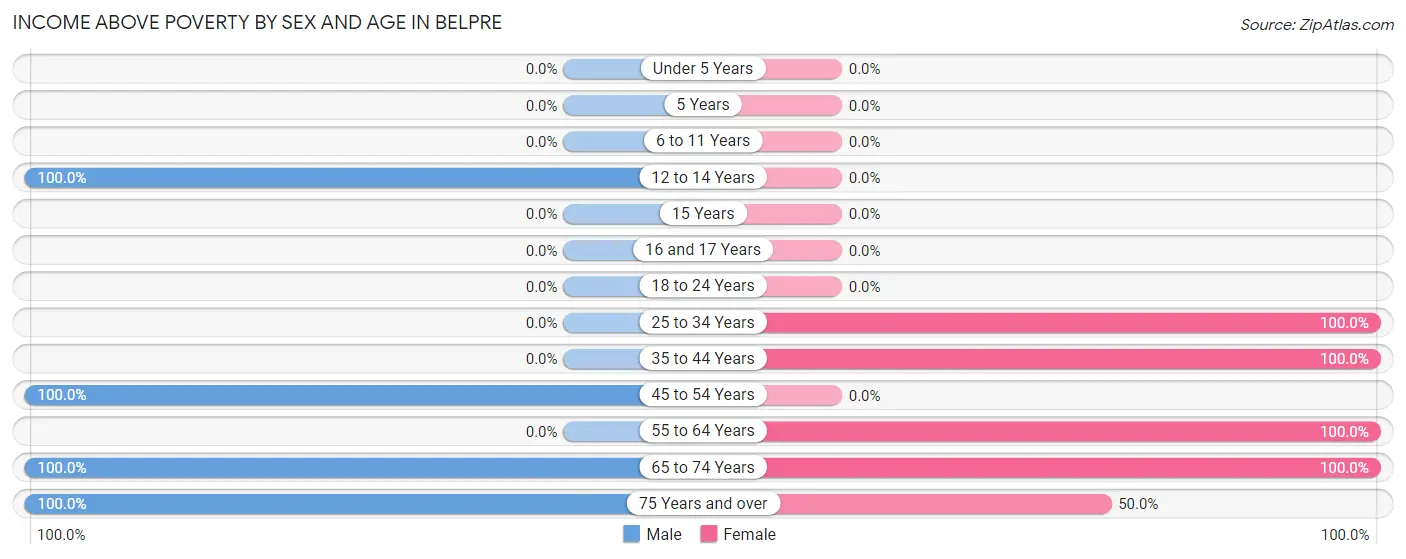
| Age Bracket | Male | Female |
| Under 5 Years | 0 (0.0%) | 0 (0.0%) |
| 5 Years | 0 (0.0%) | 0 (0.0%) |
| 6 to 11 Years | 0 (0.0%) | 0 (0.0%) |
| 12 to 14 Years | 5 (100.0%) | 0 (0.0%) |
| 15 Years | 0 (0.0%) | 0 (0.0%) |
| 16 and 17 Years | 0 (0.0%) | 0 (0.0%) |
| 18 to 24 Years | 0 (0.0%) | 0 (0.0%) |
| 25 to 34 Years | 0 (0.0%) | 4 (100.0%) |
| 35 to 44 Years | 0 (0.0%) | 4 (100.0%) |
| 45 to 54 Years | 5 (100.0%) | 0 (0.0%) |
| 55 to 64 Years | 0 (0.0%) | 4 (100.0%) |
| 65 to 74 Years | 3 (100.0%) | 7 (100.0%) |
| 75 Years and over | 2 (100.0%) | 1 (50.0%) |
| Total | 15 (100.0%) | 20 (87.0%) |
Income Below Poverty Among Married-Couple Families in Belpre
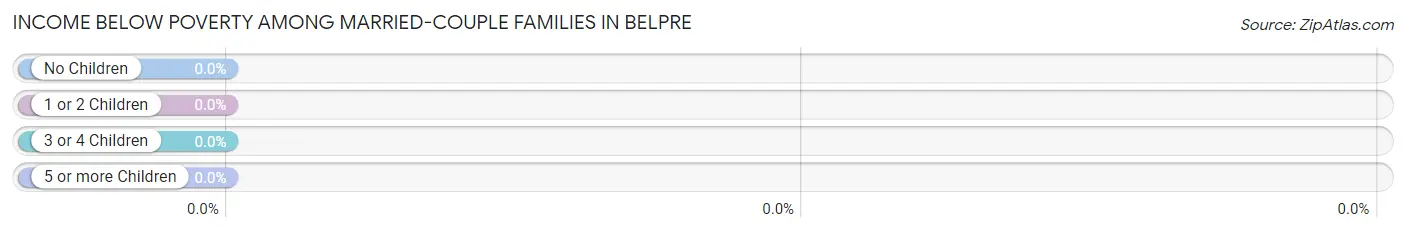
| Children | Above Poverty | Below Poverty |
| No Children | 3 (100.0%) | 0 (0.0%) |
| 1 or 2 Children | 4 (100.0%) | 0 (0.0%) |
| 3 or 4 Children | 0 (0.0%) | 0 (0.0%) |
| 5 or more Children | 0 (0.0%) | 0 (0.0%) |
| Total | 7 (100.0%) | 0 (0.0%) |
Income Below Poverty Among Single-Parent Households in Belpre
| Children | Single Father | Single Mother |
| No Children | 0 (0.0%) | 0 (0.0%) |
| 1 or 2 Children | 0 (0.0%) | 0 (0.0%) |
| 3 or 4 Children | 0 (0.0%) | 0 (0.0%) |
| 5 or more Children | 0 (0.0%) | 0 (0.0%) |
| Total | 0 (0.0%) | 0 (0.0%) |
Income Below Poverty Among Married-Couple vs Single-Parent Households in Belpre
| Children | Married-Couple Families | Single-Parent Households |
| No Children | 0 (0.0%) | 0 (0.0%) |
| 1 or 2 Children | 0 (0.0%) | 0 (0.0%) |
| 3 or 4 Children | 0 (0.0%) | 0 (0.0%) |
| 5 or more Children | 0 (0.0%) | 0 (0.0%) |
| Total | 0 (0.0%) | 0 (0.0%) |
Race in Belpre
The most populous races in Belpre are White / Caucasian (35 | 92.1%), Hispanic or Latino (17 | 44.7%), and Some other Race (3 | 7.9%).
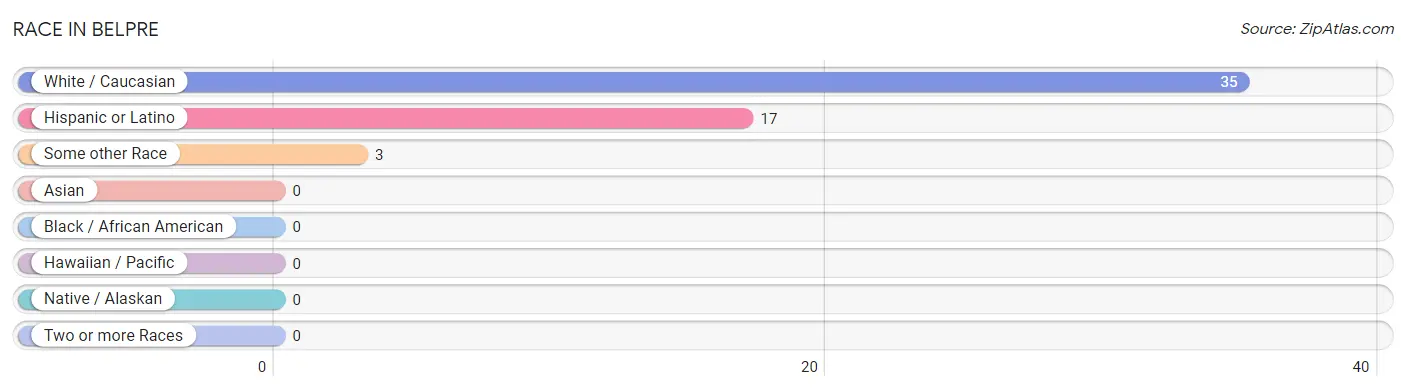
| Race | # Population | % Population |
| Asian | 0 | 0.0% |
| Black / African American | 0 | 0.0% |
| Hawaiian / Pacific | 0 | 0.0% |
| Hispanic or Latino | 17 | 44.7% |
| Native / Alaskan | 0 | 0.0% |
| White / Caucasian | 35 | 92.1% |
| Two or more Races | 0 | 0.0% |
| Some other Race | 3 | 7.9% |
| Total | 38 | 100.0% |
Ancestry in Belpre
The most populous ancestries reported in Belpre are Mexican (17 | 44.7%), English (4 | 10.5%), German (4 | 10.5%), and Czech (2 | 5.3%), together accounting for 71.1% of all Belpre residents.
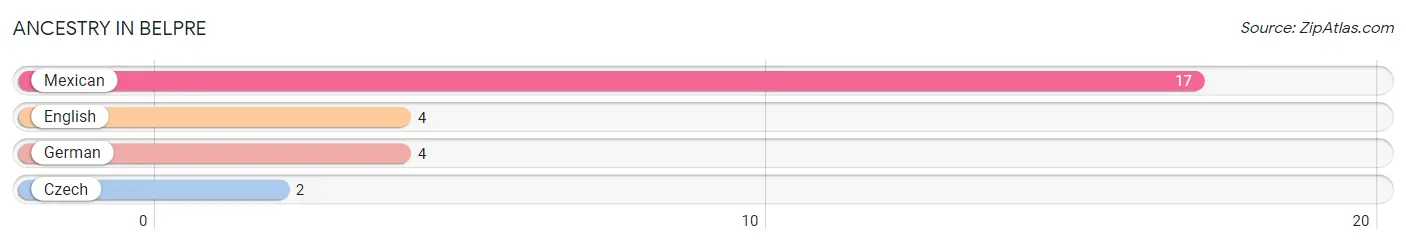
| Ancestry | # Population | % Population |
| Czech | 2 | 5.3% |
| English | 4 | 10.5% |
| German | 4 | 10.5% |
| Mexican | 17 | 44.7% | View All 4 Rows |
Immigrants in Belpre
The most numerous immigrant groups reported in Belpre came from Central America (9 | 23.7%), Latin America (9 | 23.7%), and Mexico (9 | 23.7%), together accounting for 71.0% of all Belpre residents.
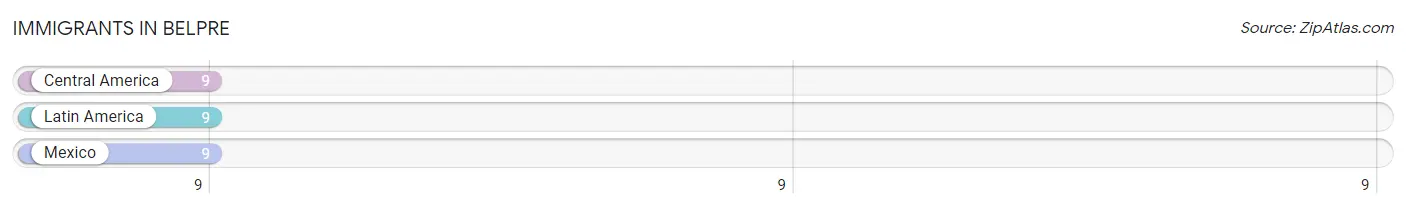
| Immigration Origin | # Population | % Population |
| Central America | 9 | 23.7% |
| Latin America | 9 | 23.7% |
| Mexico | 9 | 23.7% | View All 3 Rows |
Sex and Age in Belpre
Sex and Age in Belpre
The most populous age groups in Belpre are 10 to 14 Years (5 | 33.3%) for men and 30 to 34 Years (4 | 17.4%) for women.
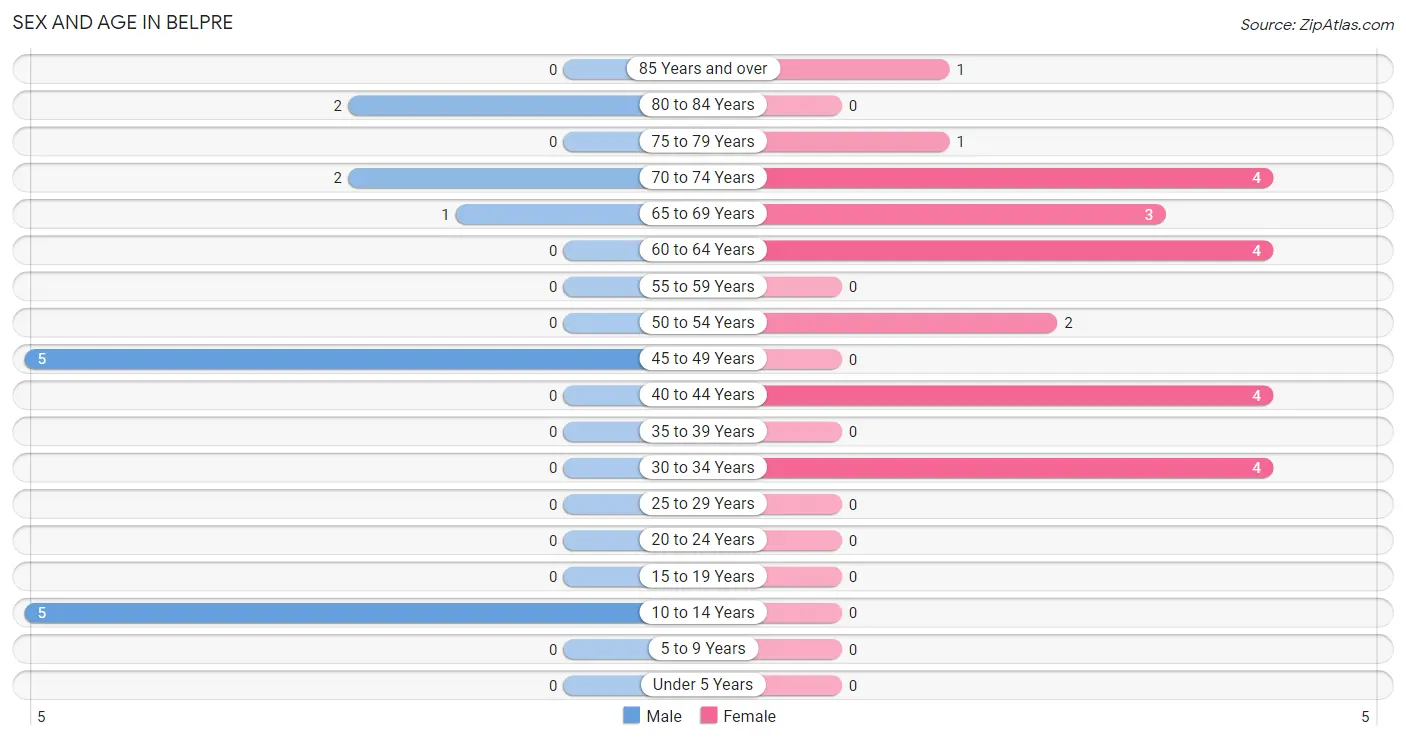
| Age Bracket | Male | Female |
| Under 5 Years | 0 (0.0%) | 0 (0.0%) |
| 5 to 9 Years | 0 (0.0%) | 0 (0.0%) |
| 10 to 14 Years | 5 (33.3%) | 0 (0.0%) |
| 15 to 19 Years | 0 (0.0%) | 0 (0.0%) |
| 20 to 24 Years | 0 (0.0%) | 0 (0.0%) |
| 25 to 29 Years | 0 (0.0%) | 0 (0.0%) |
| 30 to 34 Years | 0 (0.0%) | 4 (17.4%) |
| 35 to 39 Years | 0 (0.0%) | 0 (0.0%) |
| 40 to 44 Years | 0 (0.0%) | 4 (17.4%) |
| 45 to 49 Years | 5 (33.3%) | 0 (0.0%) |
| 50 to 54 Years | 0 (0.0%) | 2 (8.7%) |
| 55 to 59 Years | 0 (0.0%) | 0 (0.0%) |
| 60 to 64 Years | 0 (0.0%) | 4 (17.4%) |
| 65 to 69 Years | 1 (6.7%) | 3 (13.0%) |
| 70 to 74 Years | 2 (13.3%) | 4 (17.4%) |
| 75 to 79 Years | 0 (0.0%) | 1 (4.3%) |
| 80 to 84 Years | 2 (13.3%) | 0 (0.0%) |
| 85 Years and over | 0 (0.0%) | 1 (4.3%) |
| Total | 15 (100.0%) | 23 (100.0%) |
Families and Households in Belpre
Median Family Size in Belpre
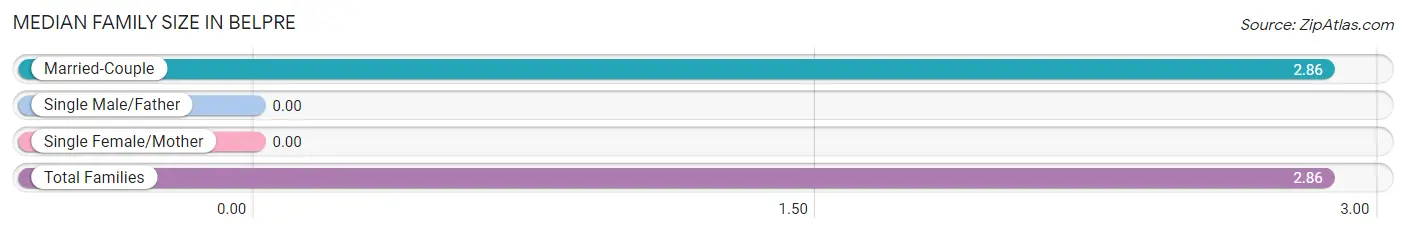
| Family Type | # Families | Family Size |
| Married-Couple | 7 (100.0%) | 2.86 |
| Single Male/Father | 0 (0.0%) | - |
| Single Female/Mother | 0 (0.0%) | - |
| Total Families | 7 (100.0%) | 2.86 |
Median Household Size in Belpre
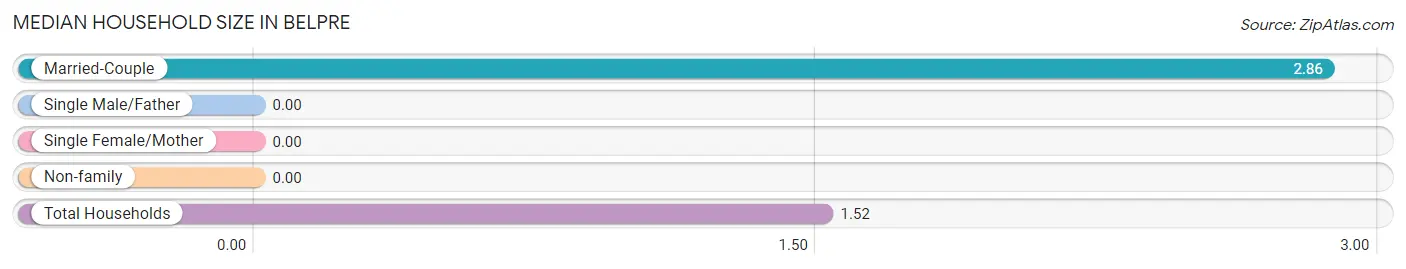
| Household Type | # Households | Household Size |
| Married-Couple | 7 (28.0%) | 2.86 |
| Single Male/Father | 0 (0.0%) | - |
| Single Female/Mother | 0 (0.0%) | - |
| Non-family | 18 (72.0%) | - |
| Total Households | 25 (100.0%) | 1.52 |
Household Size by Marriage Status in Belpre
Out of a total of 25 households in Belpre, 7 (28.0%) are family households, while 18 (72.0%) are nonfamily households. The most numerous type of family households are 3-person households, comprising 4, and the most common type of nonfamily households are 1-person households, comprising 18.
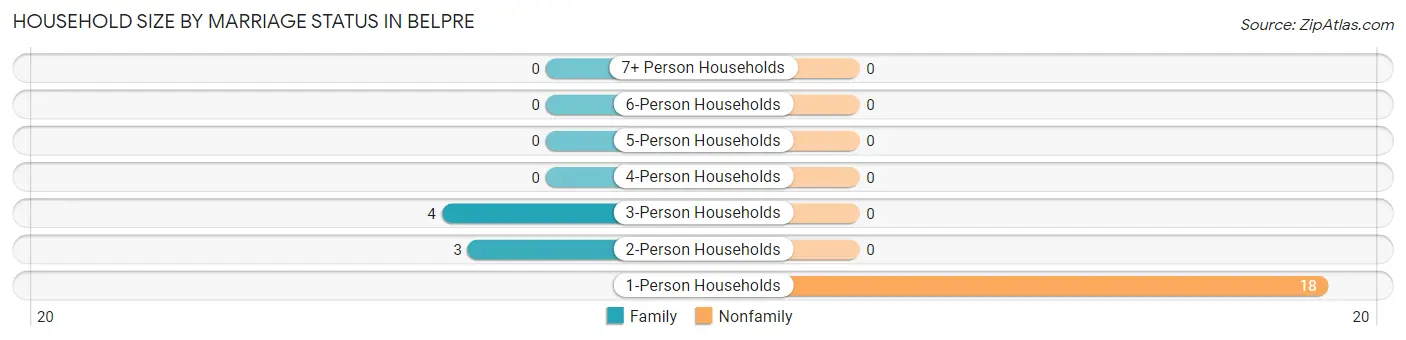
| Household Size | Family Households | Nonfamily Households |
| 1-Person Households | - | 18 (72.0%) |
| 2-Person Households | 3 (12.0%) | 0 (0.0%) |
| 3-Person Households | 4 (16.0%) | 0 (0.0%) |
| 4-Person Households | 0 (0.0%) | 0 (0.0%) |
| 5-Person Households | 0 (0.0%) | 0 (0.0%) |
| 6-Person Households | 0 (0.0%) | 0 (0.0%) |
| 7+ Person Households | 0 (0.0%) | 0 (0.0%) |
| Total | 7 (28.0%) | 18 (72.0%) |
Female Fertility in Belpre
Fertility by Age in Belpre
| Age Bracket | Women with Births | Births / 1,000 Women |
| 15 to 19 years | 0 (0.0%) | 0.0 |
| 20 to 34 years | 0 (0.0%) | 0.0 |
| 35 to 50 years | 0 (0.0%) | 0.0 |
| Total | 0 (0.0%) | 0.0 |
Fertility by Age by Marriage Status in Belpre
| Age Bracket | Married | Unmarried |
| 15 to 19 years | 0 (0.0%) | 0 (0.0%) |
| 20 to 34 years | 0 (0.0%) | 0 (0.0%) |
| 35 to 50 years | 0 (0.0%) | 0 (0.0%) |
| Total | 0 (0.0%) | 0 (0.0%) |
Fertility by Education in Belpre
| Educational Attainment | Women with Births | Births / 1,000 Women |
| Less than High School | 0 (0.0%) | 0.0 |
| High School Diploma | 0 (0.0%) | 0.0 |
| College or Associate's Degree | 0 (0.0%) | 0.0 |
| Bachelor's Degree | 0 (0.0%) | 0.0 |
| Graduate Degree | 0 (0.0%) | 0.0 |
| Total | 0 (0.0%) | 0.0 |
Fertility by Education by Marriage Status in Belpre
| Educational Attainment | Married | Unmarried |
| Less than High School | 0 (0.0%) | 0 (0.0%) |
| High School Diploma | 0 (0.0%) | 0 (0.0%) |
| College or Associate's Degree | 0 (0.0%) | 0 (0.0%) |
| Bachelor's Degree | 0 (0.0%) | 0 (0.0%) |
| Graduate Degree | 0 (0.0%) | 0 (0.0%) |
| Total | 0 (0.0%) | 0 (0.0%) |
Employment Characteristics in Belpre
Employment by Class of Employer in Belpre
Among the 22 employed individuals in Belpre, private company employees (15 | 68.2%), state government employees (4 | 18.2%), and local government employees (2 | 9.1%) make up the most common classes of employment.
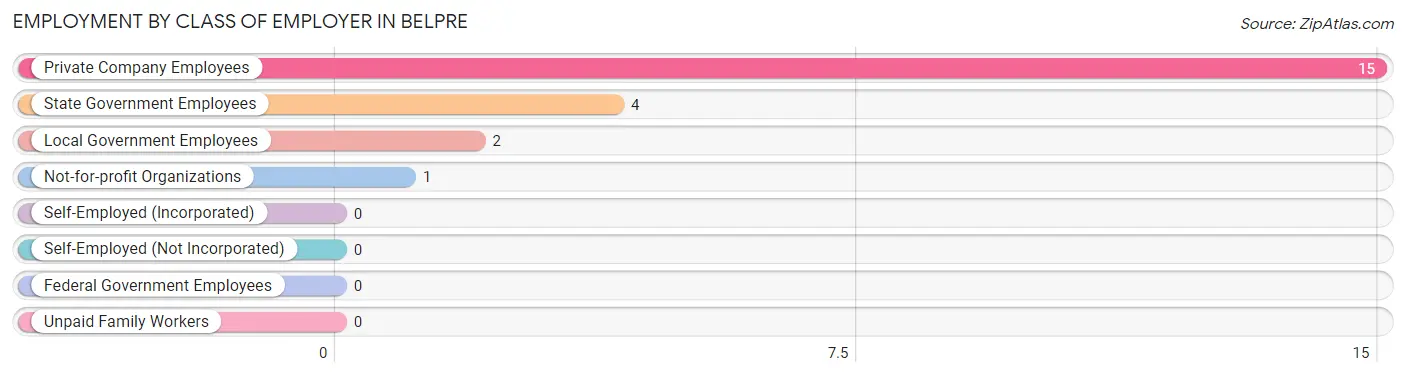
| Employer Class | # Employees | % Employees |
| Private Company Employees | 15 | 68.2% |
| Self-Employed (Incorporated) | 0 | 0.0% |
| Self-Employed (Not Incorporated) | 0 | 0.0% |
| Not-for-profit Organizations | 1 | 4.5% |
| Local Government Employees | 2 | 9.1% |
| State Government Employees | 4 | 18.2% |
| Federal Government Employees | 0 | 0.0% |
| Unpaid Family Workers | 0 | 0.0% |
| Total | 22 | 100.0% |
Employment Status by Age in Belpre
According to the labor force statistics for Belpre, out of the total population over 16 years of age (33), 72.7% or 24 individuals are in the labor force, with 8.3% or 2 of them unemployed. The age group with the highest labor force participation rate is 30 to 34 years, with 100.0% or 4 individuals in the labor force. Within the labor force, the 45 to 54 years age range has the highest percentage of unemployed individuals, with 28.6% or 2 of them being unemployed.
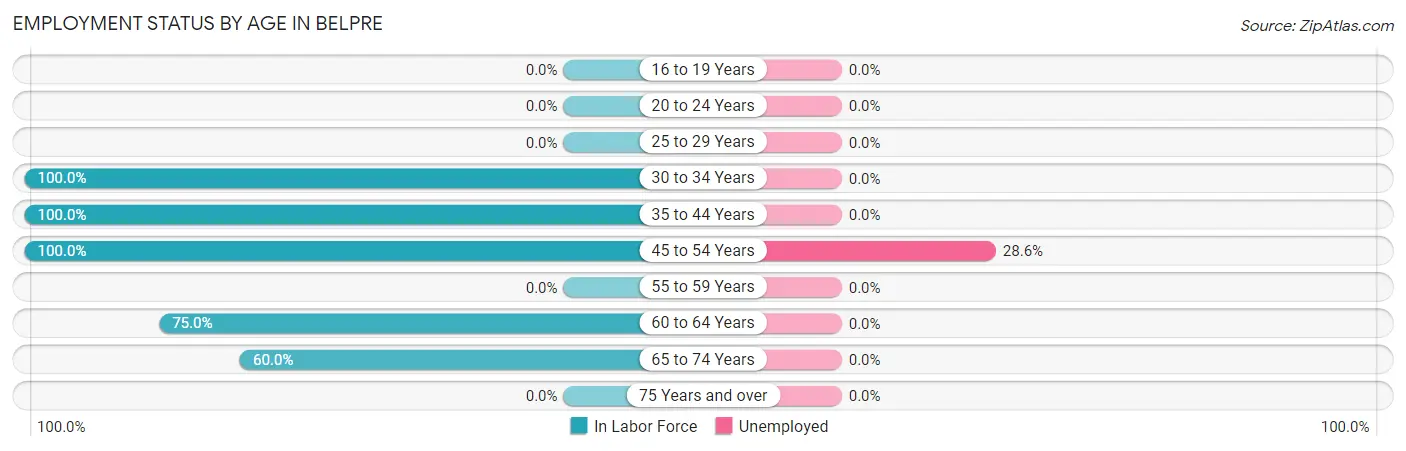
| Age Bracket | In Labor Force | Unemployed |
| 16 to 19 Years | 0 (0.0%) | 0 (0.0%) |
| 20 to 24 Years | 0 (0.0%) | 0 (0.0%) |
| 25 to 29 Years | 0 (0.0%) | 0 (0.0%) |
| 30 to 34 Years | 4 (100.0%) | 0 (0.0%) |
| 35 to 44 Years | 4 (100.0%) | 0 (0.0%) |
| 45 to 54 Years | 7 (100.0%) | 2 (28.6%) |
| 55 to 59 Years | 0 (0.0%) | 0 (0.0%) |
| 60 to 64 Years | 3 (75.0%) | 0 (0.0%) |
| 65 to 74 Years | 6 (60.0%) | 0 (0.0%) |
| 75 Years and over | 0 (0.0%) | 0 (0.0%) |
| Total | 24 (72.7%) | 2 (8.3%) |
Employment Status by Educational Attainment in Belpre
According to labor force statistics for Belpre, 94.7% of individuals (18) out of the total population between 25 and 64 years of age (19) are in the labor force, with 11.1% or 2 of them being unemployed. The group with the highest labor force participation rate are those with the educational attainment of less than high school, with 100.0% or 9 individuals in the labor force. Within the labor force, individuals with less than high school education have the highest percentage of unemployment, with 22.2% or 2 of them being unemployed.
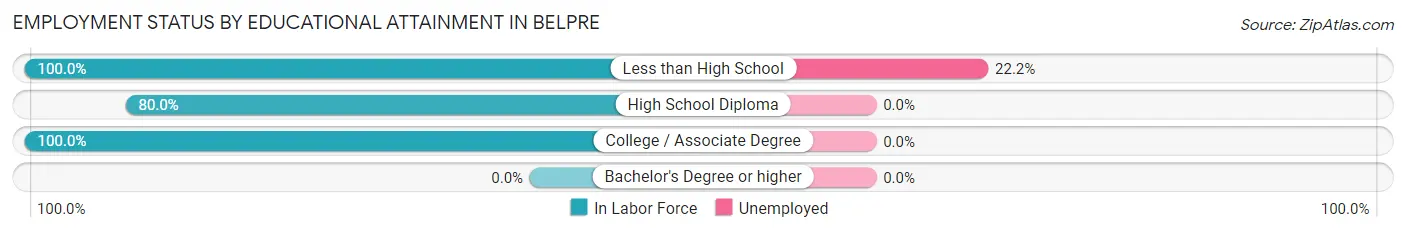
| Educational Attainment | In Labor Force | Unemployed |
| Less than High School | 9 (100.0%) | 2 (22.2%) |
| High School Diploma | 4 (80.0%) | 0 (0.0%) |
| College / Associate Degree | 5 (100.0%) | 0 (0.0%) |
| Bachelor's Degree or higher | 0 (0.0%) | 0 (0.0%) |
| Total | 18 (94.7%) | 2 (11.1%) |
Employment Occupations by Sex in Belpre
Management, Business, Science and Arts Occupations
The most common Management, Business, Science and Arts occupations in Belpre are , and Health Diagnosing & Treating (4 | 18.2%).
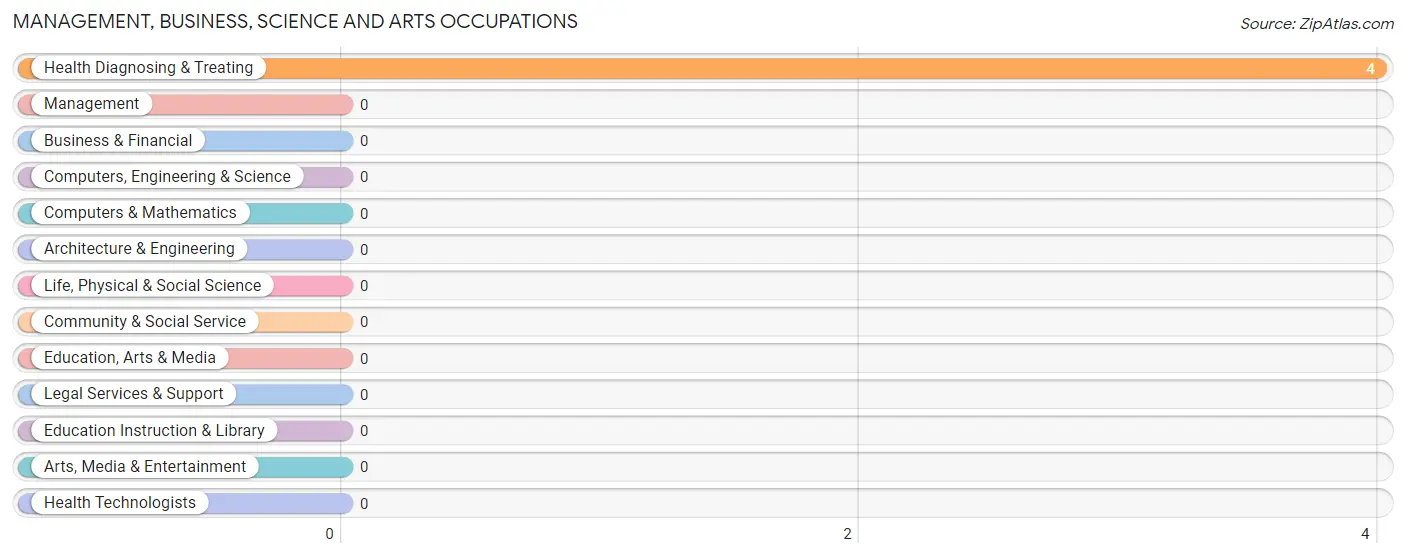
Management, Business, Science and Arts Occupations by Sex
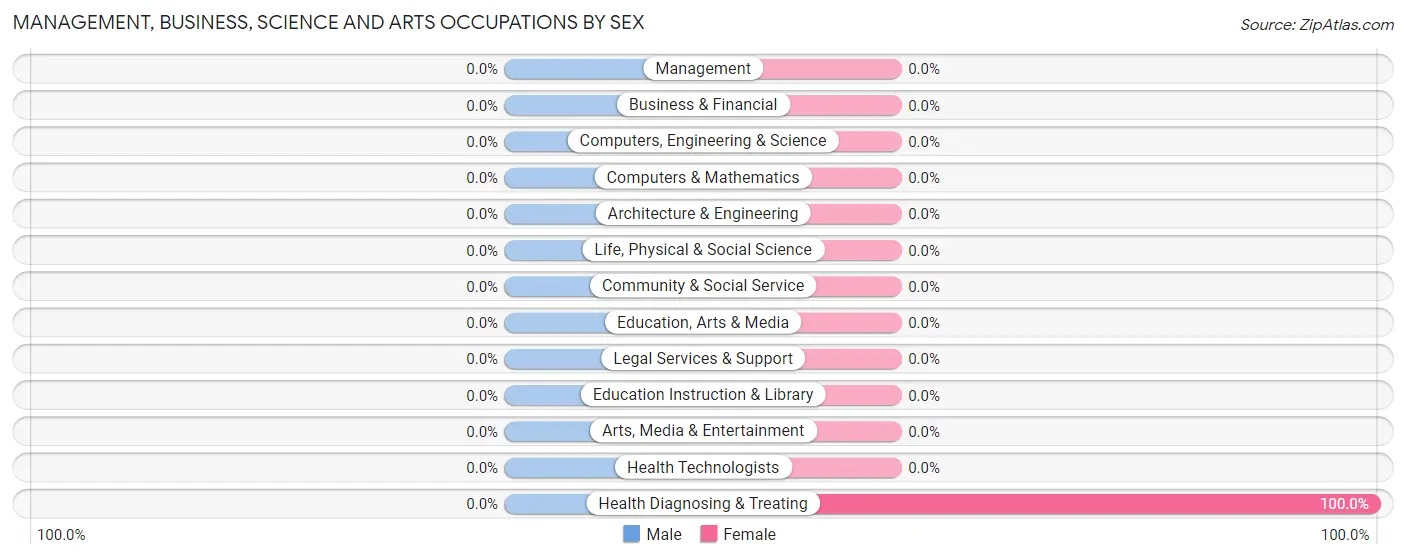
| Occupation | Male | Female |
| Management | 0 (0.0%) | 0 (0.0%) |
| Business & Financial | 0 (0.0%) | 0 (0.0%) |
| Computers, Engineering & Science | 0 (0.0%) | 0 (0.0%) |
| Computers & Mathematics | 0 (0.0%) | 0 (0.0%) |
| Architecture & Engineering | 0 (0.0%) | 0 (0.0%) |
| Life, Physical & Social Science | 0 (0.0%) | 0 (0.0%) |
| Community & Social Service | 0 (0.0%) | 0 (0.0%) |
| Education, Arts & Media | 0 (0.0%) | 0 (0.0%) |
| Legal Services & Support | 0 (0.0%) | 0 (0.0%) |
| Education Instruction & Library | 0 (0.0%) | 0 (0.0%) |
| Arts, Media & Entertainment | 0 (0.0%) | 0 (0.0%) |
| Health Diagnosing & Treating | 0 (0.0%) | 4 (100.0%) |
| Health Technologists | 0 (0.0%) | 0 (0.0%) |
| Total (Category) | 0 (0.0%) | 4 (100.0%) |
| Total (Overall) | 6 (27.3%) | 16 (72.7%) |
Services Occupations
The most common Services occupations in Belpre are Healthcare Support (3 | 13.6%), and Cleaning & Maintenance (1 | 4.5%).
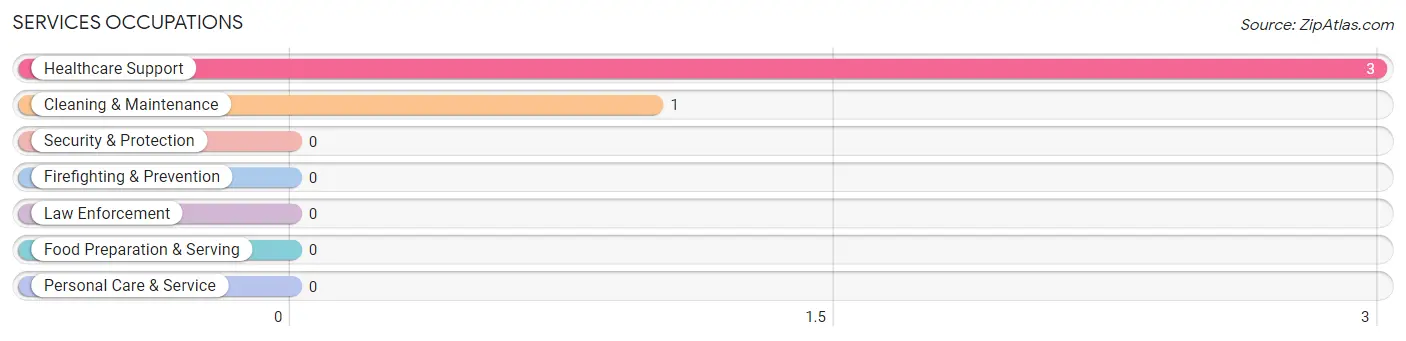
Services Occupations by Sex
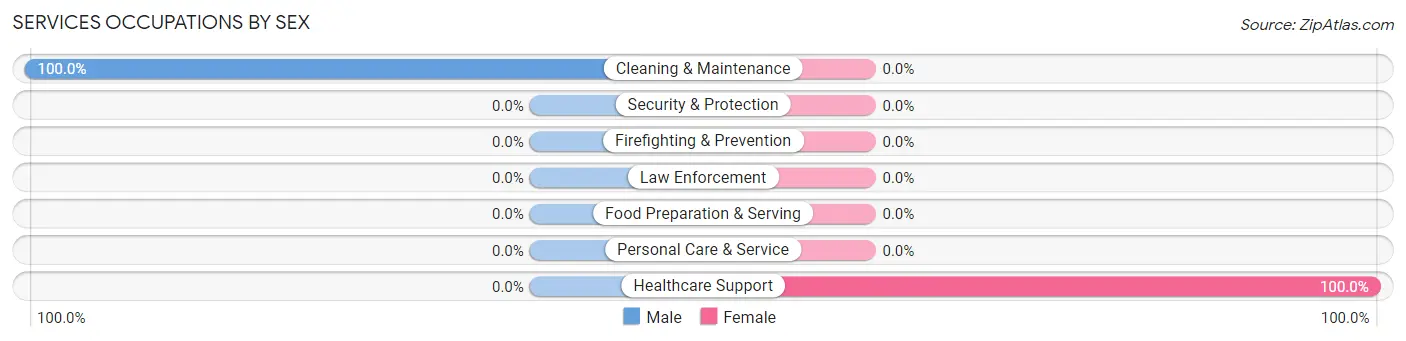
| Occupation | Male | Female |
| Healthcare Support | 0 (0.0%) | 3 (100.0%) |
| Security & Protection | 0 (0.0%) | 0 (0.0%) |
| Firefighting & Prevention | 0 (0.0%) | 0 (0.0%) |
| Law Enforcement | 0 (0.0%) | 0 (0.0%) |
| Food Preparation & Serving | 0 (0.0%) | 0 (0.0%) |
| Cleaning & Maintenance | 1 (100.0%) | 0 (0.0%) |
| Personal Care & Service | 0 (0.0%) | 0 (0.0%) |
| Total (Category) | 1 (25.0%) | 3 (75.0%) |
| Total (Overall) | 6 (27.3%) | 16 (72.7%) |
Sales and Office Occupations
The most common Sales and Office occupations in Belpre are , and Office & Administration (2 | 9.1%).

Sales and Office Occupations by Sex

| Occupation | Male | Female |
| Sales & Related | 0 (0.0%) | 0 (0.0%) |
| Office & Administration | 0 (0.0%) | 2 (100.0%) |
| Total (Category) | 0 (0.0%) | 2 (100.0%) |
| Total (Overall) | 6 (27.3%) | 16 (72.7%) |
Natural Resources, Construction and Maintenance Occupations
The most common Natural Resources, Construction and Maintenance occupations in Belpre are , and Farming, Fishing & Forestry (9 | 40.9%).
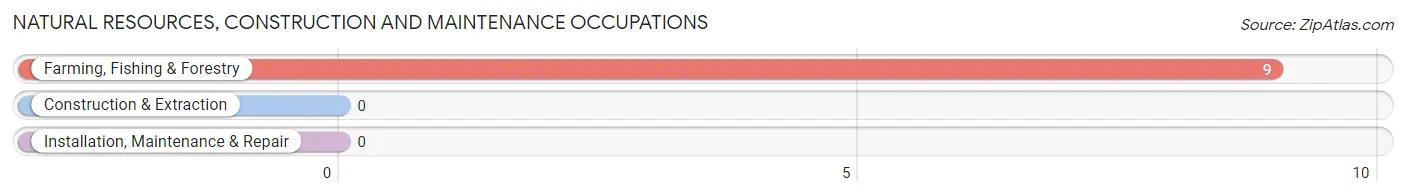
Natural Resources, Construction and Maintenance Occupations by Sex
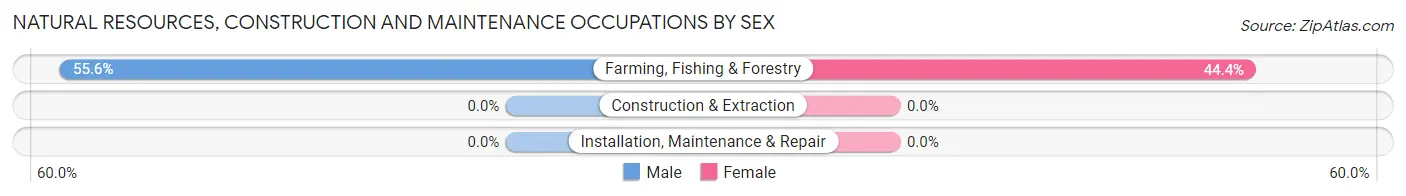
| Occupation | Male | Female |
| Farming, Fishing & Forestry | 5 (55.6%) | 4 (44.4%) |
| Construction & Extraction | 0 (0.0%) | 0 (0.0%) |
| Installation, Maintenance & Repair | 0 (0.0%) | 0 (0.0%) |
| Total (Category) | 5 (55.6%) | 4 (44.4%) |
| Total (Overall) | 6 (27.3%) | 16 (72.7%) |
Production, Transportation and Moving Occupations
The most common Production, Transportation and Moving occupations in Belpre are , and Material Moving (3 | 13.6%).
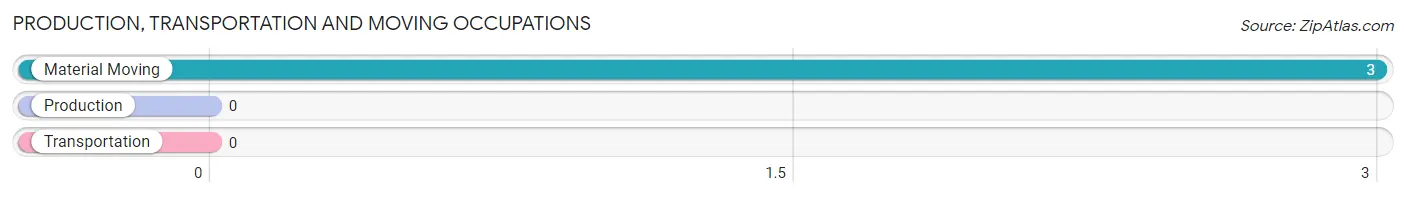
Production, Transportation and Moving Occupations by Sex
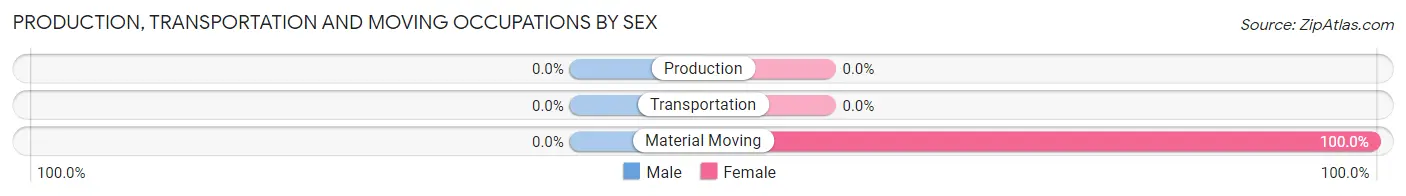
| Occupation | Male | Female |
| Production | 0 (0.0%) | 0 (0.0%) |
| Transportation | 0 (0.0%) | 0 (0.0%) |
| Material Moving | 0 (0.0%) | 3 (100.0%) |
| Total (Category) | 0 (0.0%) | 3 (100.0%) |
| Total (Overall) | 6 (27.3%) | 16 (72.7%) |
Employment Industries by Sex in Belpre
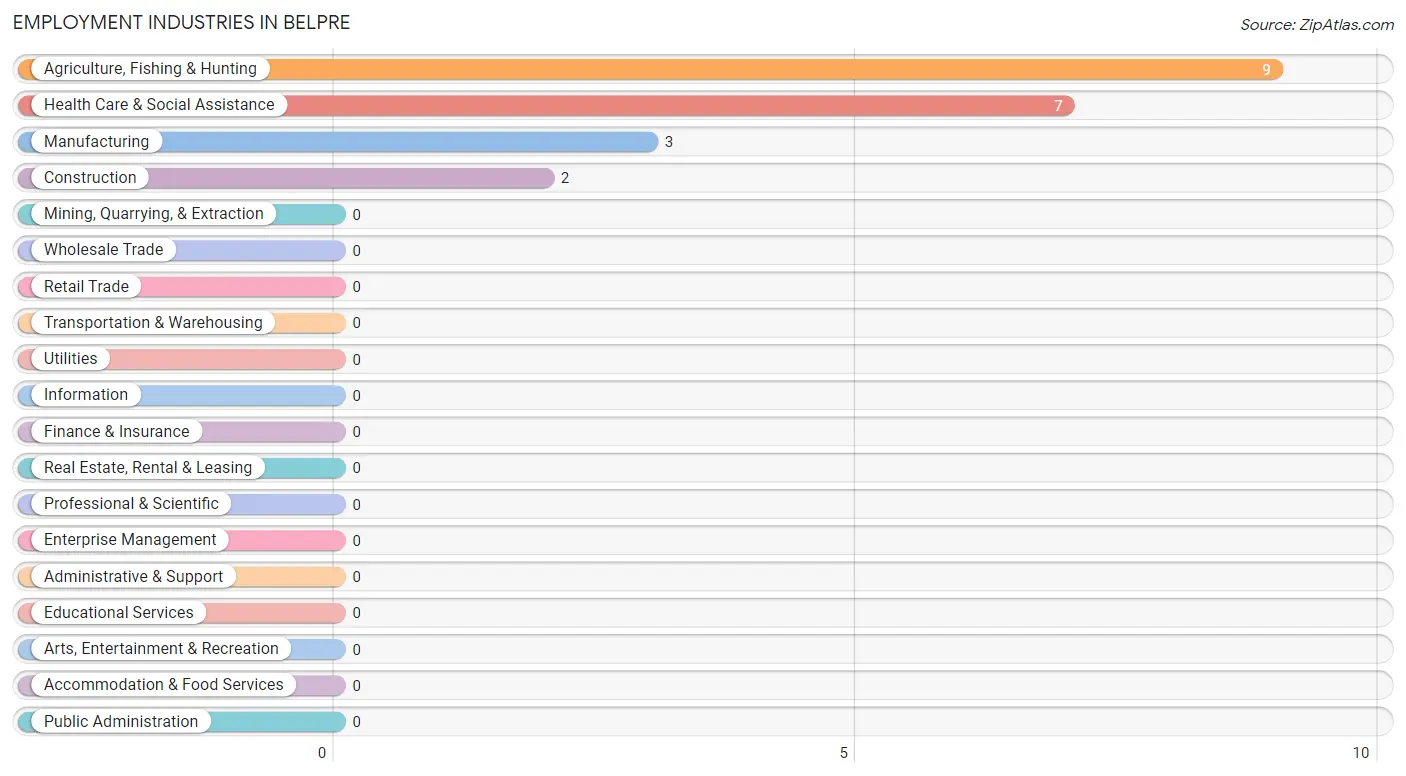
Employment Industries in Belpre
The major employment industries in Belpre include Agriculture, Fishing & Hunting (9 | 40.9%), Health Care & Social Assistance (7 | 31.8%), Manufacturing (3 | 13.6%), and Construction (2 | 9.1%).
Employment Industries by Sex in Belpre
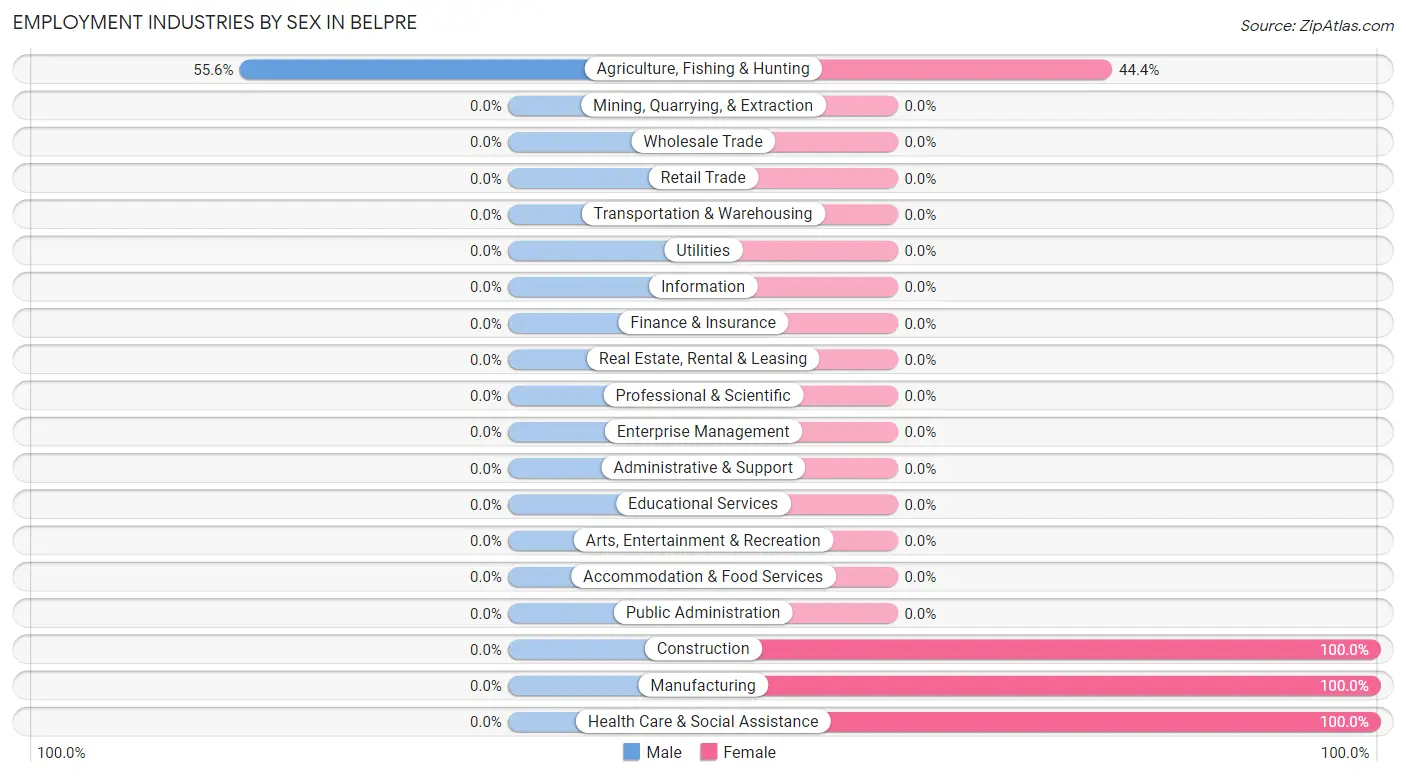
| Industry | Male | Female |
| Agriculture, Fishing & Hunting | 5 (55.6%) | 4 (44.4%) |
| Mining, Quarrying, & Extraction | 0 (0.0%) | 0 (0.0%) |
| Construction | 0 (0.0%) | 2 (100.0%) |
| Manufacturing | 0 (0.0%) | 3 (100.0%) |
| Wholesale Trade | 0 (0.0%) | 0 (0.0%) |
| Retail Trade | 0 (0.0%) | 0 (0.0%) |
| Transportation & Warehousing | 0 (0.0%) | 0 (0.0%) |
| Utilities | 0 (0.0%) | 0 (0.0%) |
| Information | 0 (0.0%) | 0 (0.0%) |
| Finance & Insurance | 0 (0.0%) | 0 (0.0%) |
| Real Estate, Rental & Leasing | 0 (0.0%) | 0 (0.0%) |
| Professional & Scientific | 0 (0.0%) | 0 (0.0%) |
| Enterprise Management | 0 (0.0%) | 0 (0.0%) |
| Administrative & Support | 0 (0.0%) | 0 (0.0%) |
| Educational Services | 0 (0.0%) | 0 (0.0%) |
| Health Care & Social Assistance | 0 (0.0%) | 7 (100.0%) |
| Arts, Entertainment & Recreation | 0 (0.0%) | 0 (0.0%) |
| Accommodation & Food Services | 0 (0.0%) | 0 (0.0%) |
| Public Administration | 0 (0.0%) | 0 (0.0%) |
| Total | 6 (27.3%) | 16 (72.7%) |
Education in Belpre
School Enrollment in Belpre
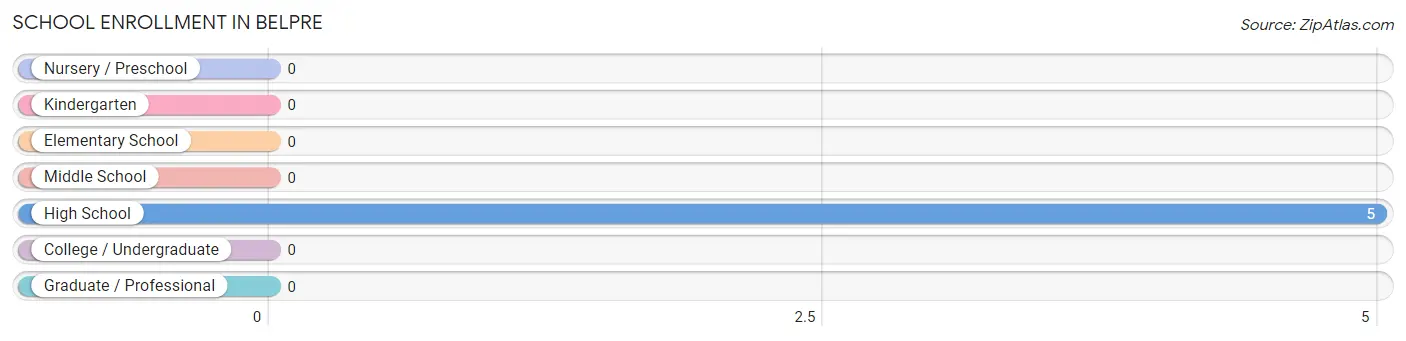
| School Level | # Students | % Students |
| Nursery / Preschool | 0 | 0.0% |
| Kindergarten | 0 | 0.0% |
| Elementary School | 0 | 0.0% |
| Middle School | 0 | 0.0% |
| High School | 5 | 100.0% |
| College / Undergraduate | 0 | 0.0% |
| Graduate / Professional | 0 | 0.0% |
| Total | 5 | 100.0% |
School Enrollment by Age by Funding Source in Belpre
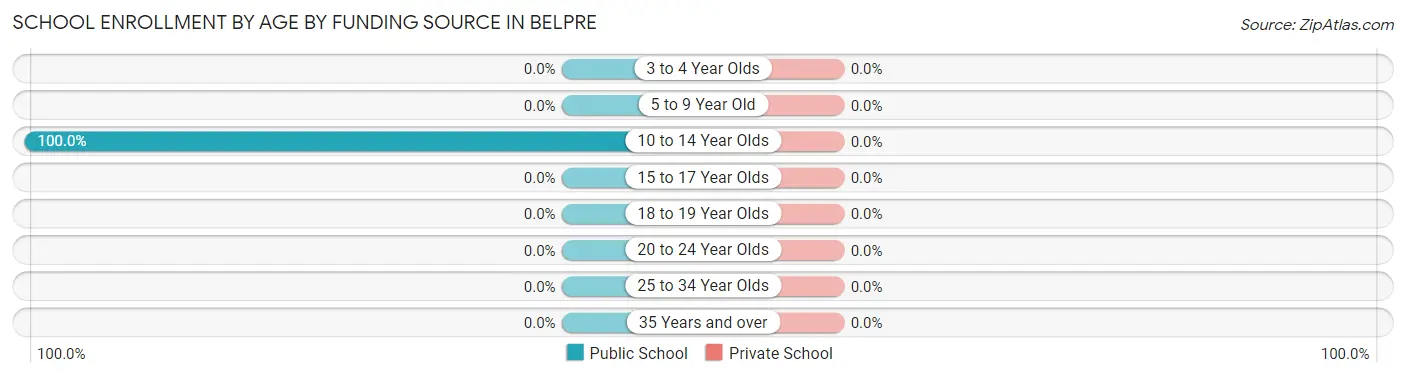
| Age Bracket | Public School | Private School |
| 3 to 4 Year Olds | 0 (0.0%) | 0 (0.0%) |
| 5 to 9 Year Old | 0 (0.0%) | 0 (0.0%) |
| 10 to 14 Year Olds | 5 (100.0%) | 0 (0.0%) |
| 15 to 17 Year Olds | 0 (0.0%) | 0 (0.0%) |
| 18 to 19 Year Olds | 0 (0.0%) | 0 (0.0%) |
| 20 to 24 Year Olds | 0 (0.0%) | 0 (0.0%) |
| 25 to 34 Year Olds | 0 (0.0%) | 0 (0.0%) |
| 35 Years and over | 0 (0.0%) | 0 (0.0%) |
| Total | 5 (100.0%) | 0 (0.0%) |
Educational Attainment by Field of Study in Belpre
| Field of Study | # Graduates | % Graduates |
| Computers & Mathematics | 0 | 0.0% |
| Bio, Nature & Agricultural | 0 | 0.0% |
| Physical & Health Sciences | 0 | 0.0% |
| Psychology | 0 | 0.0% |
| Social Sciences | 0 | 0.0% |
| Engineering | 0 | 0.0% |
| Multidisciplinary Studies | 0 | 0.0% |
| Science & Technology | 0 | 0.0% |
| Business | 0 | 0.0% |
| Education | 0 | 0.0% |
| Literature & Languages | 0 | 0.0% |
| Liberal Arts & History | 0 | 0.0% |
| Visual & Performing Arts | 0 | 0.0% |
| Communications | 0 | 0.0% |
| Arts & Humanities | 0 | 0.0% |
| Total | 0 | 0.0% |
Transportation & Commute in Belpre
Vehicle Availability by Sex in Belpre
The most prevalent vehicle ownership categories in Belpre are males with 2 vehicles (6, accounting for 100.0%) and females with 2 vehicles (8, making up 37.5%).
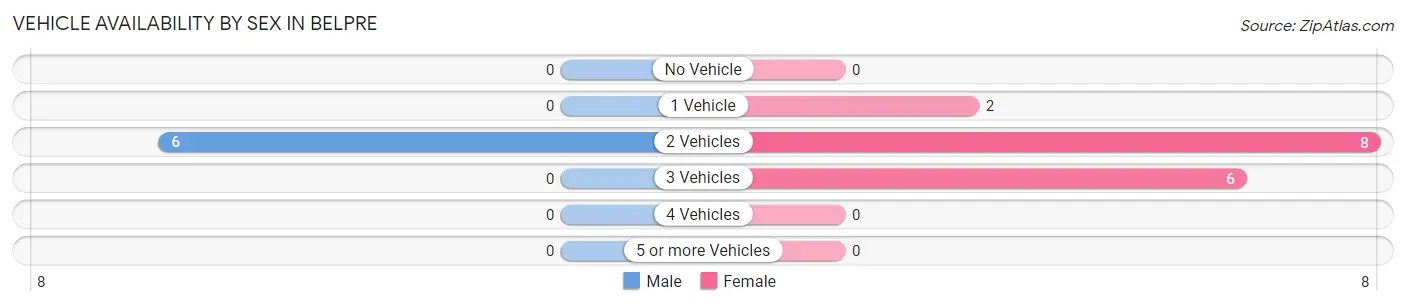
| Vehicles Available | Male | Female |
| No Vehicle | 0 (0.0%) | 0 (0.0%) |
| 1 Vehicle | 0 (0.0%) | 2 (12.5%) |
| 2 Vehicles | 6 (100.0%) | 8 (50.0%) |
| 3 Vehicles | 0 (0.0%) | 6 (37.5%) |
| 4 Vehicles | 0 (0.0%) | 0 (0.0%) |
| 5 or more Vehicles | 0 (0.0%) | 0 (0.0%) |
| Total | 6 (100.0%) | 16 (100.0%) |
Commute Time in Belpre
The most frequently occuring commute durations in Belpre are 15 to 19 minutes (9 commuters, 42.9%), 10 to 14 minutes (6 commuters, 28.6%), and 30 to 34 minutes (4 commuters, 19.1%).
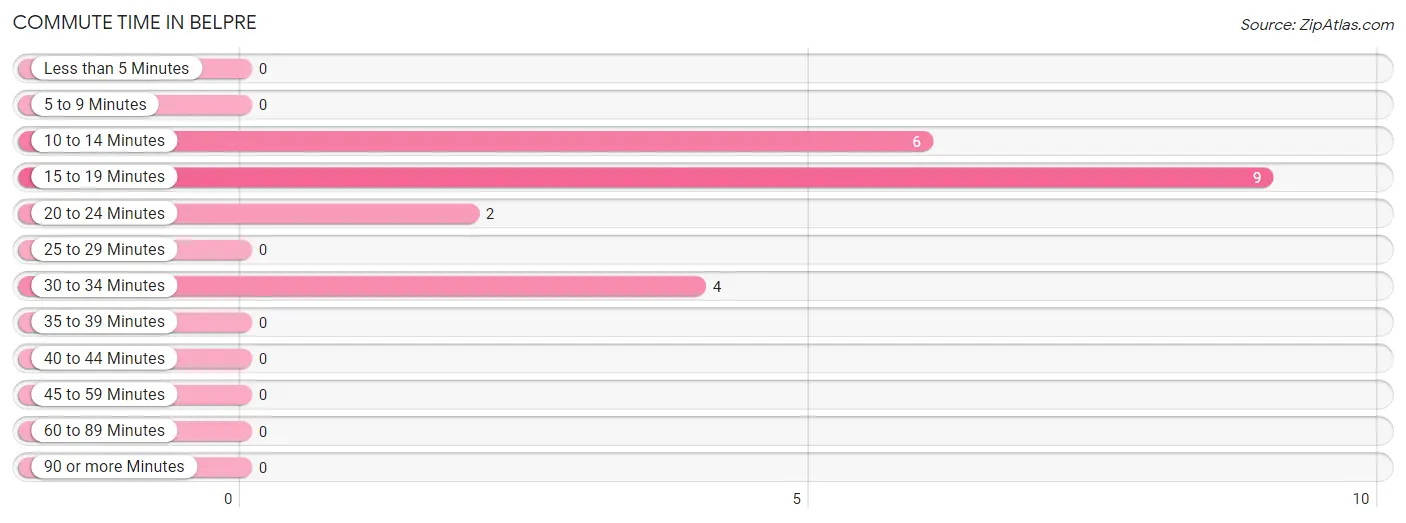
| Commute Time | # Commuters | % Commuters |
| Less than 5 Minutes | 0 | 0.0% |
| 5 to 9 Minutes | 0 | 0.0% |
| 10 to 14 Minutes | 6 | 28.6% |
| 15 to 19 Minutes | 9 | 42.9% |
| 20 to 24 Minutes | 2 | 9.5% |
| 25 to 29 Minutes | 0 | 0.0% |
| 30 to 34 Minutes | 4 | 19.1% |
| 35 to 39 Minutes | 0 | 0.0% |
| 40 to 44 Minutes | 0 | 0.0% |
| 45 to 59 Minutes | 0 | 0.0% |
| 60 to 89 Minutes | 0 | 0.0% |
| 90 or more Minutes | 0 | 0.0% |
Commute Time by Sex in Belpre
The most common commute times in Belpre are 15 to 19 minutes (5 commuters, 100.0%) for males and 10 to 14 minutes (6 commuters, 37.5%) for females.
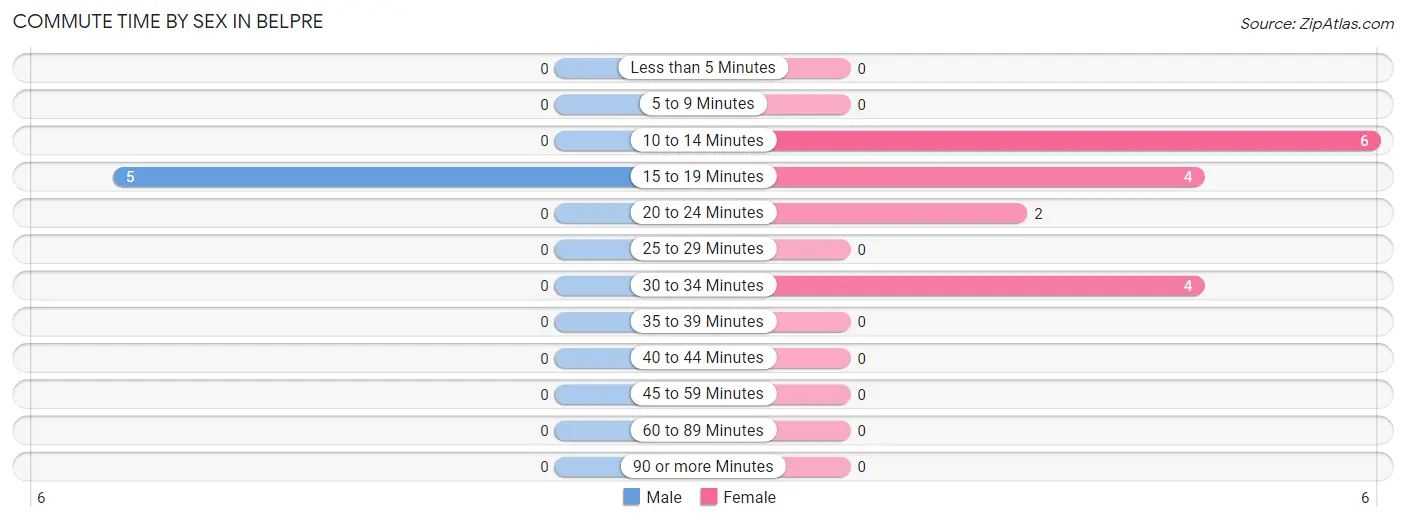
| Commute Time | Male | Female |
| Less than 5 Minutes | 0 (0.0%) | 0 (0.0%) |
| 5 to 9 Minutes | 0 (0.0%) | 0 (0.0%) |
| 10 to 14 Minutes | 0 (0.0%) | 6 (37.5%) |
| 15 to 19 Minutes | 5 (100.0%) | 4 (25.0%) |
| 20 to 24 Minutes | 0 (0.0%) | 2 (12.5%) |
| 25 to 29 Minutes | 0 (0.0%) | 0 (0.0%) |
| 30 to 34 Minutes | 0 (0.0%) | 4 (25.0%) |
| 35 to 39 Minutes | 0 (0.0%) | 0 (0.0%) |
| 40 to 44 Minutes | 0 (0.0%) | 0 (0.0%) |
| 45 to 59 Minutes | 0 (0.0%) | 0 (0.0%) |
| 60 to 89 Minutes | 0 (0.0%) | 0 (0.0%) |
| 90 or more Minutes | 0 (0.0%) | 0 (0.0%) |
Time of Departure to Work by Sex in Belpre
The most frequent times of departure to work in Belpre are 6:00 AM to 6:29 AM (5, 100.0%) for males and 5:30 AM to 5:59 AM (6, 37.5%) for females.
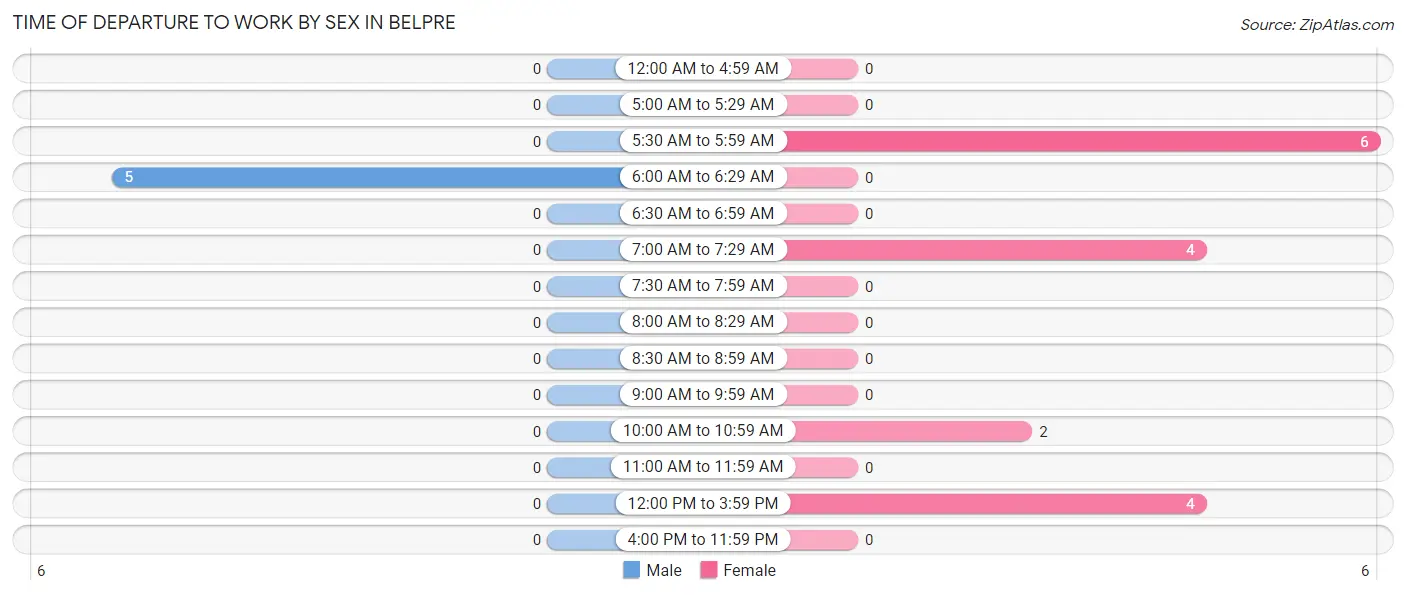
| Time of Departure | Male | Female |
| 12:00 AM to 4:59 AM | 0 (0.0%) | 0 (0.0%) |
| 5:00 AM to 5:29 AM | 0 (0.0%) | 0 (0.0%) |
| 5:30 AM to 5:59 AM | 0 (0.0%) | 6 (37.5%) |
| 6:00 AM to 6:29 AM | 5 (100.0%) | 0 (0.0%) |
| 6:30 AM to 6:59 AM | 0 (0.0%) | 0 (0.0%) |
| 7:00 AM to 7:29 AM | 0 (0.0%) | 4 (25.0%) |
| 7:30 AM to 7:59 AM | 0 (0.0%) | 0 (0.0%) |
| 8:00 AM to 8:29 AM | 0 (0.0%) | 0 (0.0%) |
| 8:30 AM to 8:59 AM | 0 (0.0%) | 0 (0.0%) |
| 9:00 AM to 9:59 AM | 0 (0.0%) | 0 (0.0%) |
| 10:00 AM to 10:59 AM | 0 (0.0%) | 2 (12.5%) |
| 11:00 AM to 11:59 AM | 0 (0.0%) | 0 (0.0%) |
| 12:00 PM to 3:59 PM | 0 (0.0%) | 4 (25.0%) |
| 4:00 PM to 11:59 PM | 0 (0.0%) | 0 (0.0%) |
| Total | 5 (100.0%) | 16 (100.0%) |
Housing Occupancy in Belpre
Occupancy by Ownership in Belpre
Of the total 25 dwellings in Belpre, owner-occupied units account for 21 (84.0%), while renter-occupied units make up 4 (16.0%).
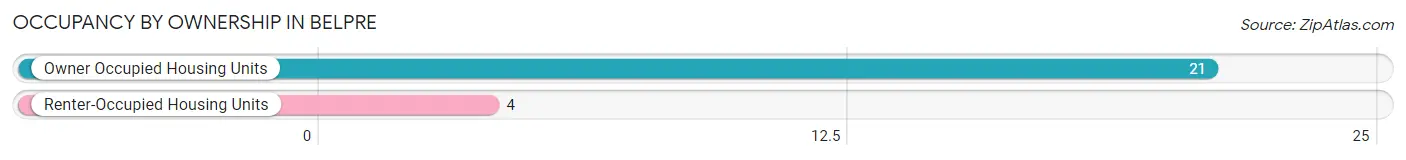
| Occupancy | # Housing Units | % Housing Units |
| Owner Occupied Housing Units | 21 | 84.0% |
| Renter-Occupied Housing Units | 4 | 16.0% |
| Total Occupied Housing Units | 25 | 100.0% |
Occupancy by Household Size in Belpre
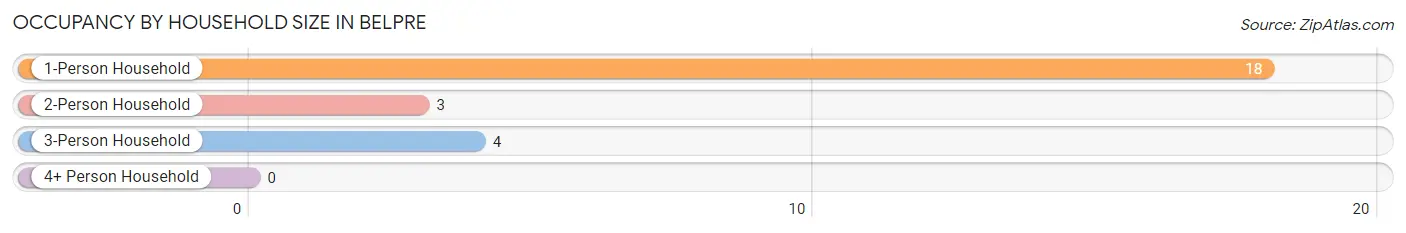
| Household Size | # Housing Units | % Housing Units |
| 1-Person Household | 18 | 72.0% |
| 2-Person Household | 3 | 12.0% |
| 3-Person Household | 4 | 16.0% |
| 4+ Person Household | 0 | 0.0% |
| Total Housing Units | 25 | 100.0% |
Occupancy by Ownership by Household Size in Belpre
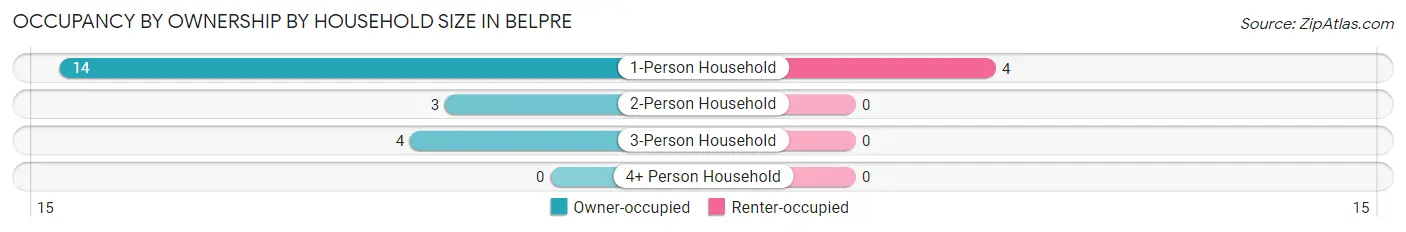
| Household Size | Owner-occupied | Renter-occupied |
| 1-Person Household | 14 (77.8%) | 4 (22.2%) |
| 2-Person Household | 3 (100.0%) | 0 (0.0%) |
| 3-Person Household | 4 (100.0%) | 0 (0.0%) |
| 4+ Person Household | 0 (0.0%) | 0 (0.0%) |
| Total Housing Units | 21 (84.0%) | 4 (16.0%) |
Occupancy by Educational Attainment in Belpre
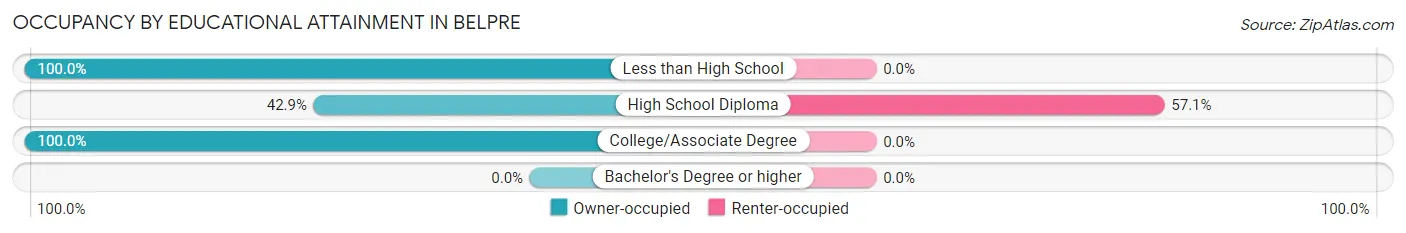
| Household Size | Owner-occupied | Renter-occupied |
| Less than High School | 11 (100.0%) | 0 (0.0%) |
| High School Diploma | 3 (42.9%) | 4 (57.1%) |
| College/Associate Degree | 7 (100.0%) | 0 (0.0%) |
| Bachelor's Degree or higher | 0 (0.0%) | 0 (0.0%) |
Occupancy by Age of Householder in Belpre
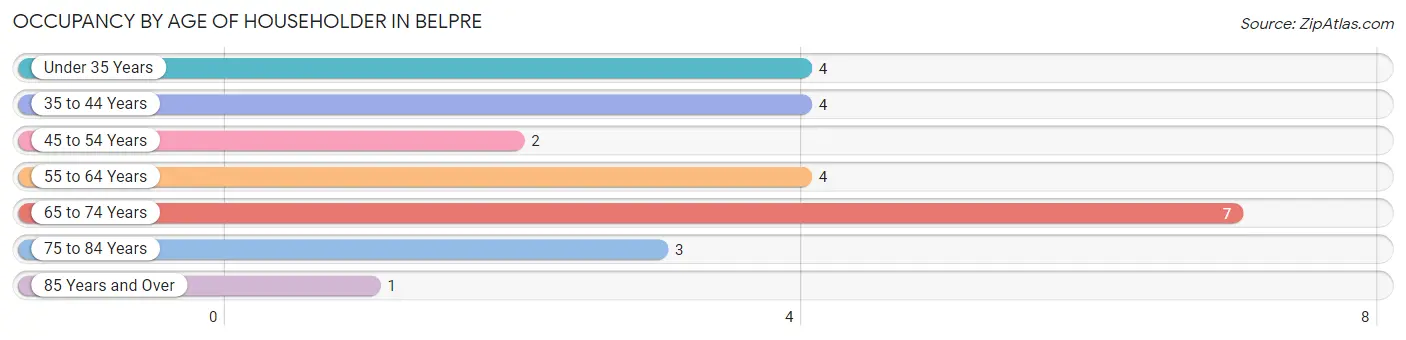
| Age Bracket | # Households | % Households |
| Under 35 Years | 4 | 16.0% |
| 35 to 44 Years | 4 | 16.0% |
| 45 to 54 Years | 2 | 8.0% |
| 55 to 64 Years | 4 | 16.0% |
| 65 to 74 Years | 7 | 28.0% |
| 75 to 84 Years | 3 | 12.0% |
| 85 Years and Over | 1 | 4.0% |
| Total | 25 | 100.0% |
Housing Finances in Belpre
Median Income by Occupancy in Belpre
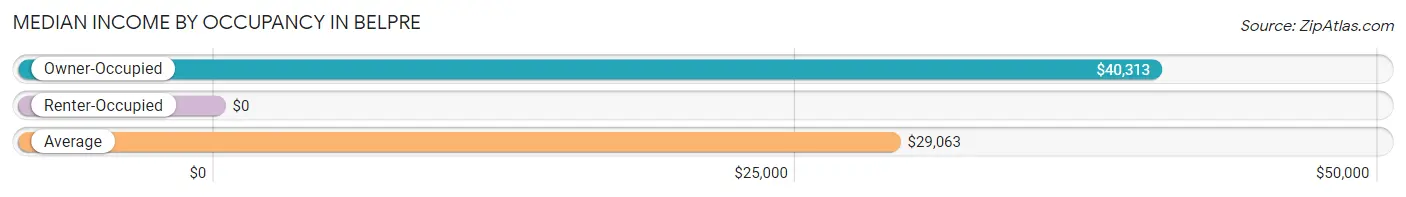
| Occupancy Type | # Households | Median Income |
| Owner-Occupied | 21 (84.0%) | $40,313 |
| Renter-Occupied | 4 (16.0%) | $0 |
| Average | 25 (100.0%) | $29,063 |
Occupancy by Householder Income Bracket in Belpre
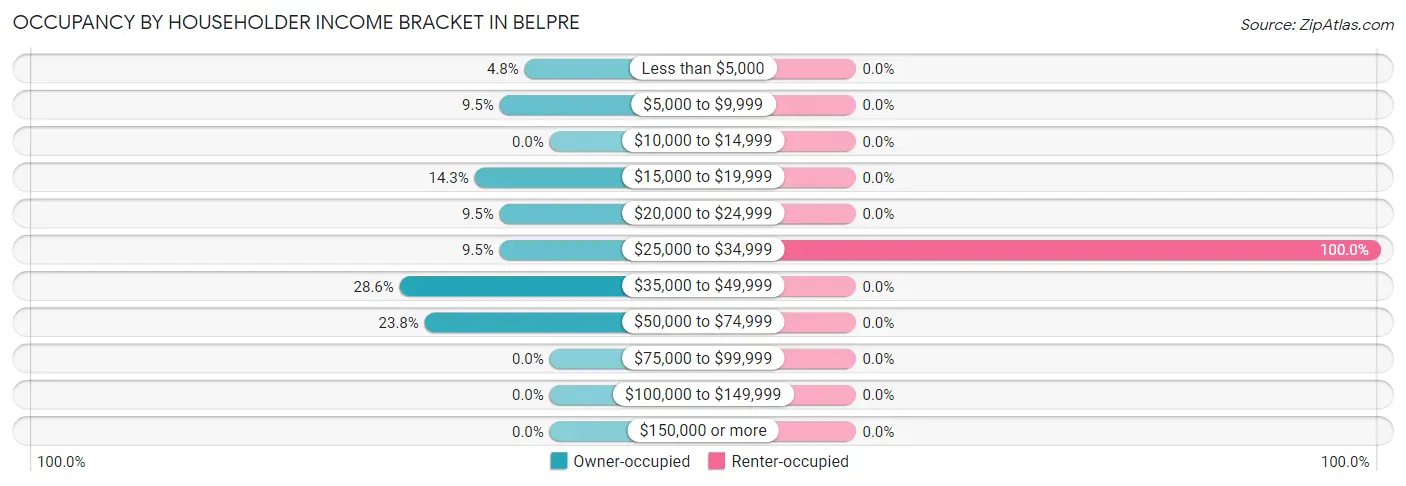
| Income Bracket | Owner-occupied | Renter-occupied |
| Less than $5,000 | 1 (4.8%) | 0 (0.0%) |
| $5,000 to $9,999 | 2 (9.5%) | 0 (0.0%) |
| $10,000 to $14,999 | 0 (0.0%) | 0 (0.0%) |
| $15,000 to $19,999 | 3 (14.3%) | 0 (0.0%) |
| $20,000 to $24,999 | 2 (9.5%) | 0 (0.0%) |
| $25,000 to $34,999 | 2 (9.5%) | 4 (100.0%) |
| $35,000 to $49,999 | 6 (28.6%) | 0 (0.0%) |
| $50,000 to $74,999 | 5 (23.8%) | 0 (0.0%) |
| $75,000 to $99,999 | 0 (0.0%) | 0 (0.0%) |
| $100,000 to $149,999 | 0 (0.0%) | 0 (0.0%) |
| $150,000 or more | 0 (0.0%) | 0 (0.0%) |
| Total | 21 (100.0%) | 4 (100.0%) |
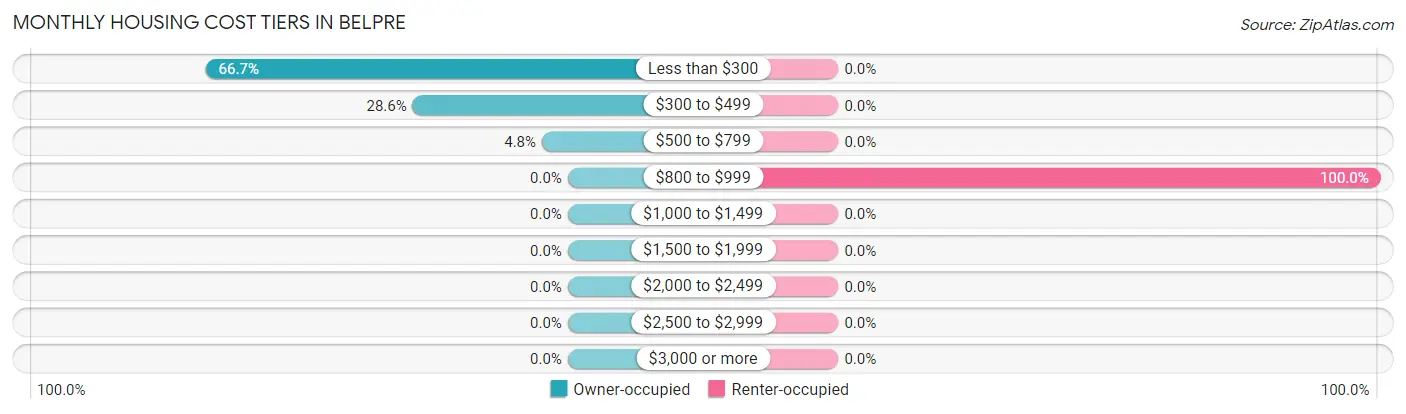
Monthly Housing Cost Tiers in Belpre
| Monthly Cost | Owner-occupied | Renter-occupied |
| Less than $300 | 14 (66.7%) | 0 (0.0%) |
| $300 to $499 | 6 (28.6%) | 0 (0.0%) |
| $500 to $799 | 1 (4.8%) | 0 (0.0%) |
| $800 to $999 | 0 (0.0%) | 4 (100.0%) |
| $1,000 to $1,499 | 0 (0.0%) | 0 (0.0%) |
| $1,500 to $1,999 | 0 (0.0%) | 0 (0.0%) |
| $2,000 to $2,499 | 0 (0.0%) | 0 (0.0%) |
| $2,500 to $2,999 | 0 (0.0%) | 0 (0.0%) |
| $3,000 or more | 0 (0.0%) | 0 (0.0%) |
| Total | 21 (100.0%) | 4 (100.0%) |
Physical Housing Characteristics in Belpre
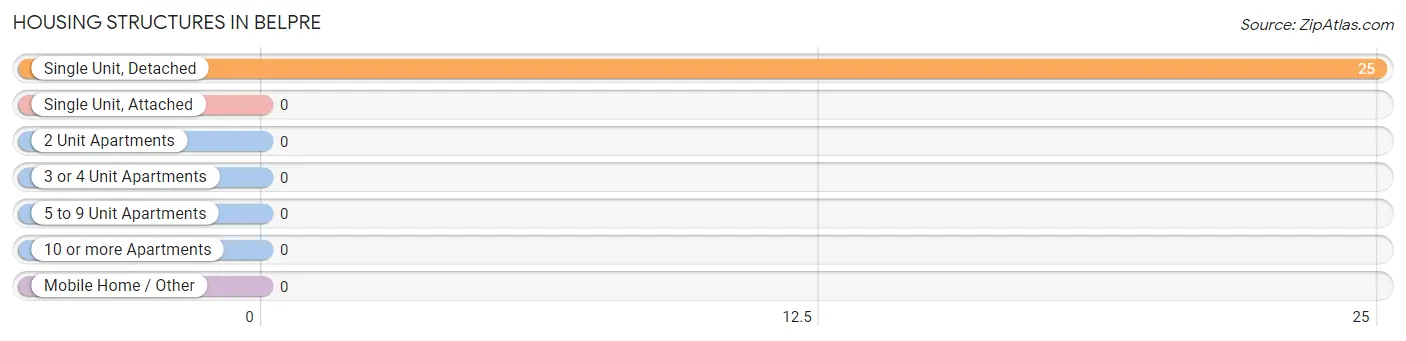
Housing Structures in Belpre
| Structure Type | # Housing Units | % Housing Units |
| Single Unit, Detached | 25 | 100.0% |
| Single Unit, Attached | 0 | 0.0% |
| 2 Unit Apartments | 0 | 0.0% |
| 3 or 4 Unit Apartments | 0 | 0.0% |
| 5 to 9 Unit Apartments | 0 | 0.0% |
| 10 or more Apartments | 0 | 0.0% |
| Mobile Home / Other | 0 | 0.0% |
| Total | 25 | 100.0% |
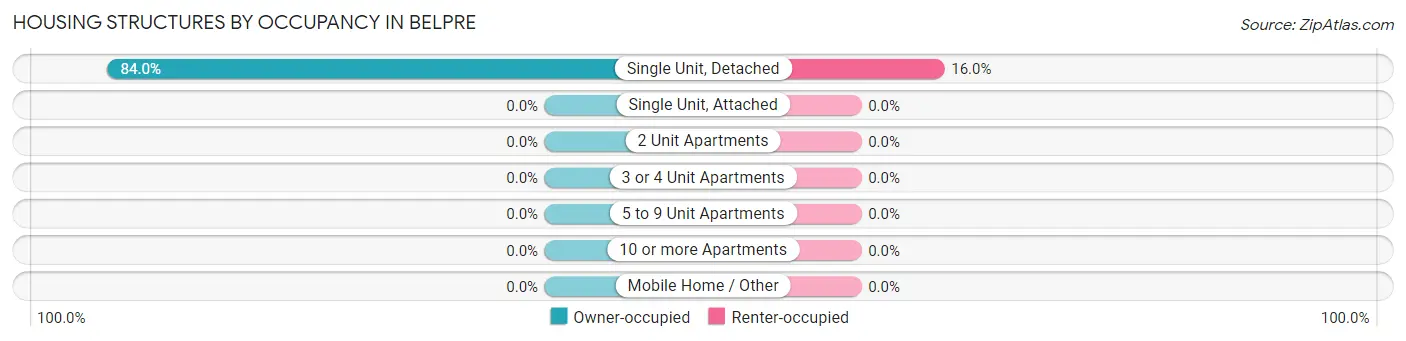
Housing Structures by Occupancy in Belpre
| Structure Type | Owner-occupied | Renter-occupied |
| Single Unit, Detached | 21 (84.0%) | 4 (16.0%) |
| Single Unit, Attached | 0 (0.0%) | 0 (0.0%) |
| 2 Unit Apartments | 0 (0.0%) | 0 (0.0%) |
| 3 or 4 Unit Apartments | 0 (0.0%) | 0 (0.0%) |
| 5 to 9 Unit Apartments | 0 (0.0%) | 0 (0.0%) |
| 10 or more Apartments | 0 (0.0%) | 0 (0.0%) |
| Mobile Home / Other | 0 (0.0%) | 0 (0.0%) |
| Total | 21 (84.0%) | 4 (16.0%) |
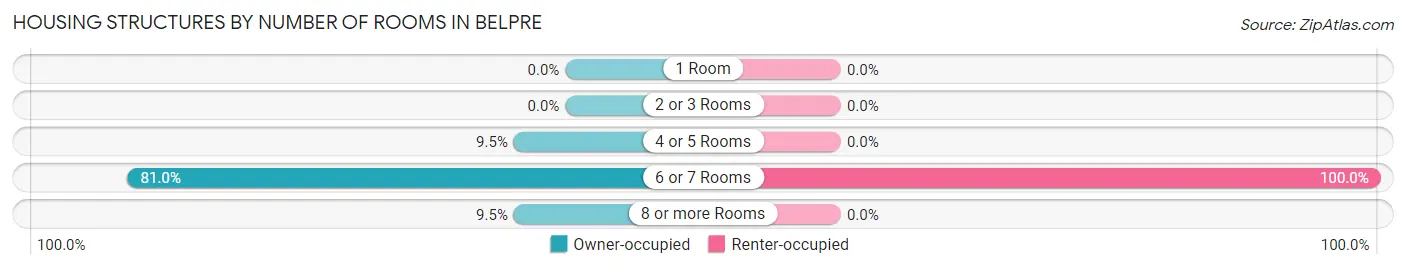
Housing Structures by Number of Rooms in Belpre
| Number of Rooms | Owner-occupied | Renter-occupied |
| 1 Room | 0 (0.0%) | 0 (0.0%) |
| 2 or 3 Rooms | 0 (0.0%) | 0 (0.0%) |
| 4 or 5 Rooms | 2 (9.5%) | 0 (0.0%) |
| 6 or 7 Rooms | 17 (80.9%) | 4 (100.0%) |
| 8 or more Rooms | 2 (9.5%) | 0 (0.0%) |
| Total | 21 (100.0%) | 4 (100.0%) |
Housing Structure by Heating Type in Belpre
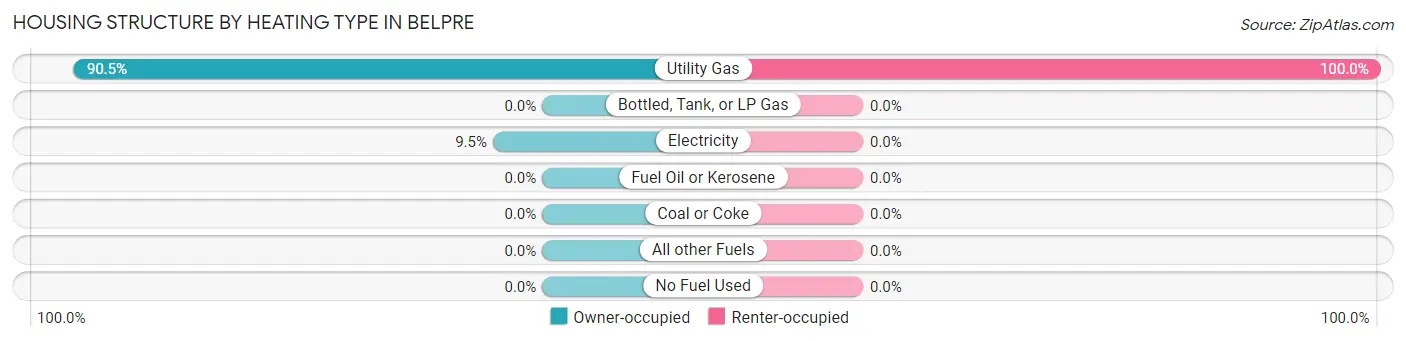
| Heating Type | Owner-occupied | Renter-occupied |
| Utility Gas | 19 (90.5%) | 4 (100.0%) |
| Bottled, Tank, or LP Gas | 0 (0.0%) | 0 (0.0%) |
| Electricity | 2 (9.5%) | 0 (0.0%) |
| Fuel Oil or Kerosene | 0 (0.0%) | 0 (0.0%) |
| Coal or Coke | 0 (0.0%) | 0 (0.0%) |
| All other Fuels | 0 (0.0%) | 0 (0.0%) |
| No Fuel Used | 0 (0.0%) | 0 (0.0%) |
| Total | 21 (100.0%) | 4 (100.0%) |
Household Vehicle Usage in Belpre
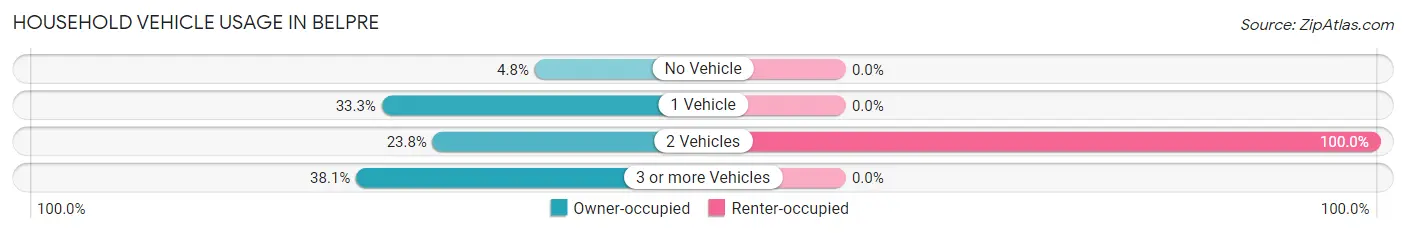
| Vehicles per Household | Owner-occupied | Renter-occupied |
| No Vehicle | 1 (4.8%) | 0 (0.0%) |
| 1 Vehicle | 7 (33.3%) | 0 (0.0%) |
| 2 Vehicles | 5 (23.8%) | 4 (100.0%) |
| 3 or more Vehicles | 8 (38.1%) | 0 (0.0%) |
| Total | 21 (100.0%) | 4 (100.0%) |
Real Estate & Mortgages in Belpre
Real Estate and Mortgage Overview in Belpre
| Characteristic | Without Mortgage | With Mortgage |
| Housing Units | 20 | 1 |
| Median Property Value | $17,500 | $0 |
| Median Household Income | $33,750 | $0 |
| Monthly Housing Costs | $278 | $0 |
| Real Estate Taxes | $280 | $0 |
Property Value by Mortgage Status in Belpre
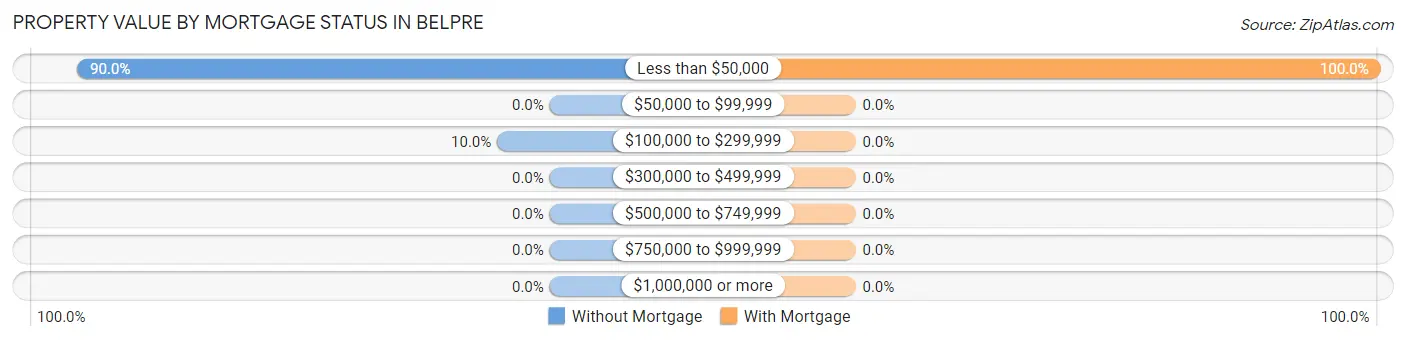
| Property Value | Without Mortgage | With Mortgage |
| Less than $50,000 | 18 (90.0%) | 1 (100.0%) |
| $50,000 to $99,999 | 0 (0.0%) | 0 (0.0%) |
| $100,000 to $299,999 | 2 (10.0%) | 0 (0.0%) |
| $300,000 to $499,999 | 0 (0.0%) | 0 (0.0%) |
| $500,000 to $749,999 | 0 (0.0%) | 0 (0.0%) |
| $750,000 to $999,999 | 0 (0.0%) | 0 (0.0%) |
| $1,000,000 or more | 0 (0.0%) | 0 (0.0%) |
| Total | 20 (100.0%) | 1 (100.0%) |
Household Income by Mortgage Status in Belpre
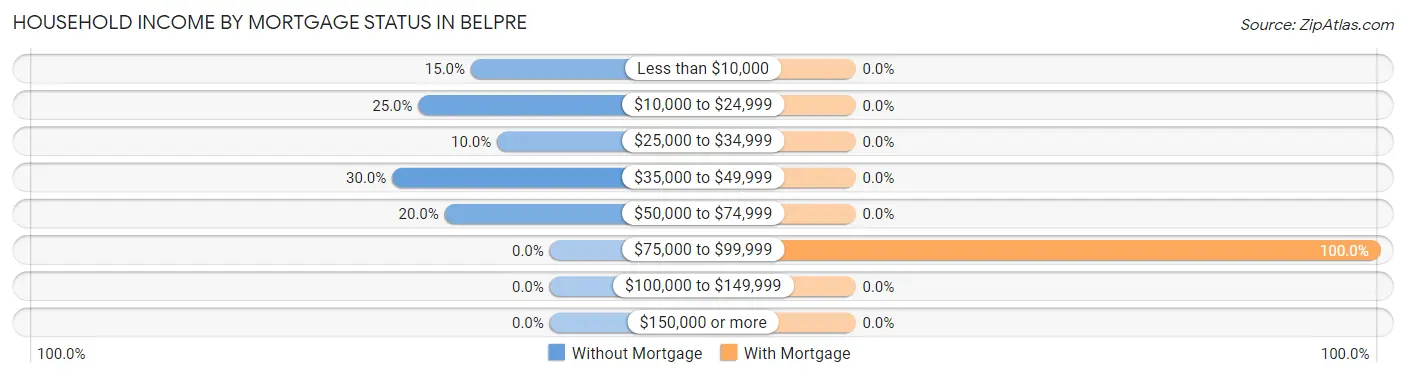
| Household Income | Without Mortgage | With Mortgage |
| Less than $10,000 | 3 (15.0%) | 0 (0.0%) |
| $10,000 to $24,999 | 5 (25.0%) | 0 (0.0%) |
| $25,000 to $34,999 | 2 (10.0%) | 0 (0.0%) |
| $35,000 to $49,999 | 6 (30.0%) | 0 (0.0%) |
| $50,000 to $74,999 | 4 (20.0%) | 0 (0.0%) |
| $75,000 to $99,999 | 0 (0.0%) | 1 (100.0%) |
| $100,000 to $149,999 | 0 (0.0%) | 0 (0.0%) |
| $150,000 or more | 0 (0.0%) | 0 (0.0%) |
| Total | 20 (100.0%) | 1 (100.0%) |
Property Value to Household Income Ratio in Belpre
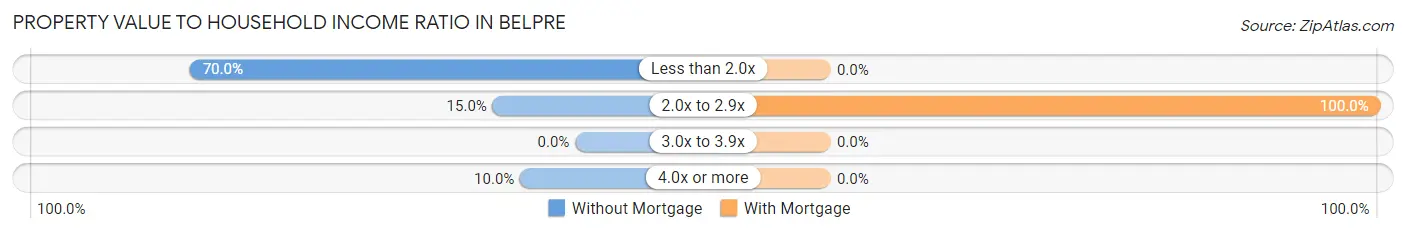
| Value-to-Income Ratio | Without Mortgage | With Mortgage |
| Less than 2.0x | 14 (70.0%) | 0 (0.0%) |
| 2.0x to 2.9x | 3 (15.0%) | 1 (100.0%) |
| 3.0x to 3.9x | 0 (0.0%) | 0 (0.0%) |
| 4.0x or more | 2 (10.0%) | 0 (0.0%) |
| Total | 20 (100.0%) | 1 (100.0%) |
Real Estate Taxes by Mortgage Status in Belpre
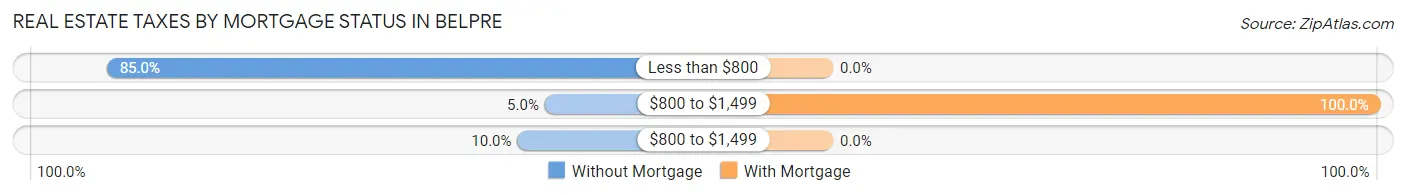
| Property Taxes | Without Mortgage | With Mortgage |
| Less than $800 | 17 (85.0%) | 0 (0.0%) |
| $800 to $1,499 | 1 (5.0%) | 1 (100.0%) |
| $800 to $1,499 | 2 (10.0%) | 0 (0.0%) |
| Total | 20 (100.0%) | 1 (100.0%) |
Health & Disability in Belpre
Health Insurance Coverage by Age in Belpre
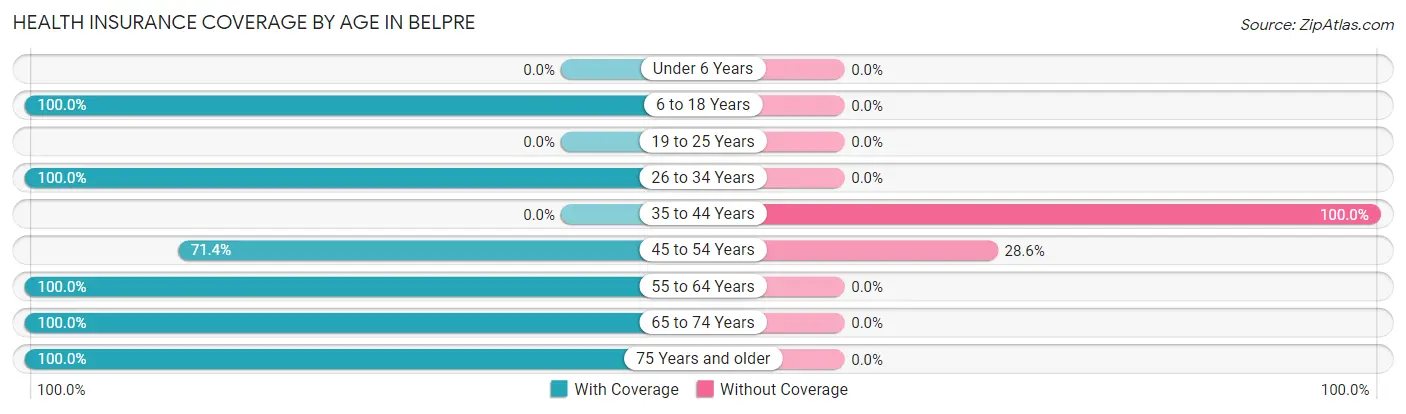
| Age Bracket | With Coverage | Without Coverage |
| Under 6 Years | 0 (0.0%) | 0 (0.0%) |
| 6 to 18 Years | 5 (100.0%) | 0 (0.0%) |
| 19 to 25 Years | 0 (0.0%) | 0 (0.0%) |
| 26 to 34 Years | 4 (100.0%) | 0 (0.0%) |
| 35 to 44 Years | 0 (0.0%) | 4 (100.0%) |
| 45 to 54 Years | 5 (71.4%) | 2 (28.6%) |
| 55 to 64 Years | 4 (100.0%) | 0 (0.0%) |
| 65 to 74 Years | 10 (100.0%) | 0 (0.0%) |
| 75 Years and older | 4 (100.0%) | 0 (0.0%) |
| Total | 32 (84.2%) | 6 (15.8%) |
Health Insurance Coverage by Citizenship Status in Belpre

| Citizenship Status | With Coverage | Without Coverage |
| Native Born | 0 (0.0%) | 0 (0.0%) |
| Foreign Born, Citizen | 5 (100.0%) | 0 (0.0%) |
| Foreign Born, not a Citizen | 0 (0.0%) | 0 (0.0%) |
Health Insurance Coverage by Household Income in Belpre
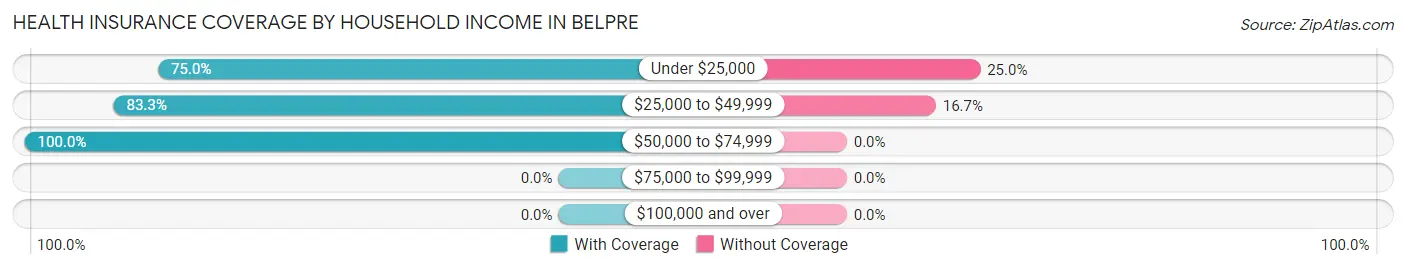
| Household Income | With Coverage | Without Coverage |
| Under $25,000 | 6 (75.0%) | 2 (25.0%) |
| $25,000 to $49,999 | 20 (83.3%) | 4 (16.7%) |
| $50,000 to $74,999 | 6 (100.0%) | 0 (0.0%) |
| $75,000 to $99,999 | 0 (0.0%) | 0 (0.0%) |
| $100,000 and over | 0 (0.0%) | 0 (0.0%) |
Public vs Private Health Insurance Coverage by Age in Belpre
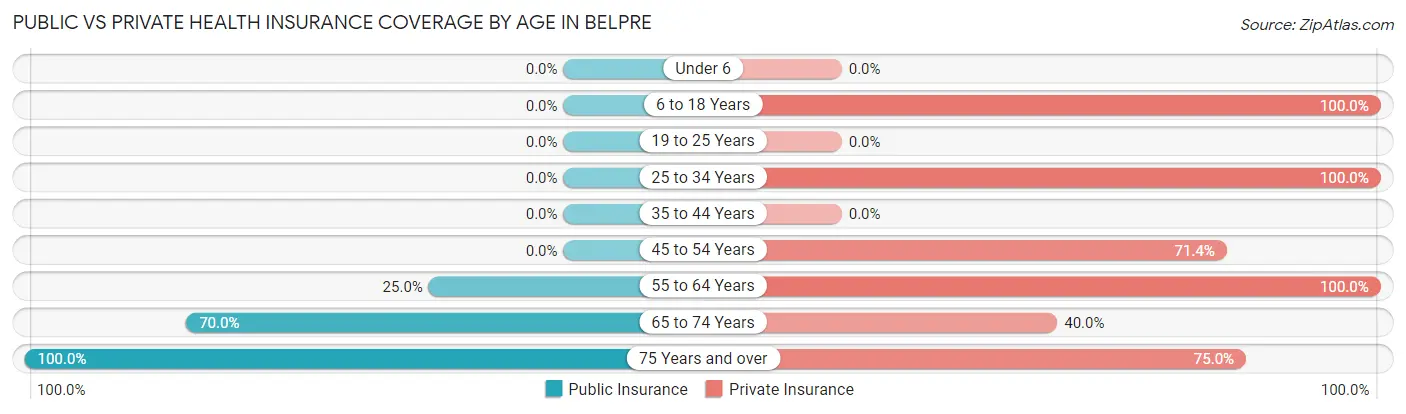
| Age Bracket | Public Insurance | Private Insurance |
| Under 6 | 0 (0.0%) | 0 (0.0%) |
| 6 to 18 Years | 0 (0.0%) | 5 (100.0%) |
| 19 to 25 Years | 0 (0.0%) | 0 (0.0%) |
| 25 to 34 Years | 0 (0.0%) | 4 (100.0%) |
| 35 to 44 Years | 0 (0.0%) | 0 (0.0%) |
| 45 to 54 Years | 0 (0.0%) | 5 (71.4%) |
| 55 to 64 Years | 1 (25.0%) | 4 (100.0%) |
| 65 to 74 Years | 7 (70.0%) | 4 (40.0%) |
| 75 Years and over | 4 (100.0%) | 3 (75.0%) |
| Total | 12 (31.6%) | 25 (65.8%) |
Disability Status by Sex by Age in Belpre
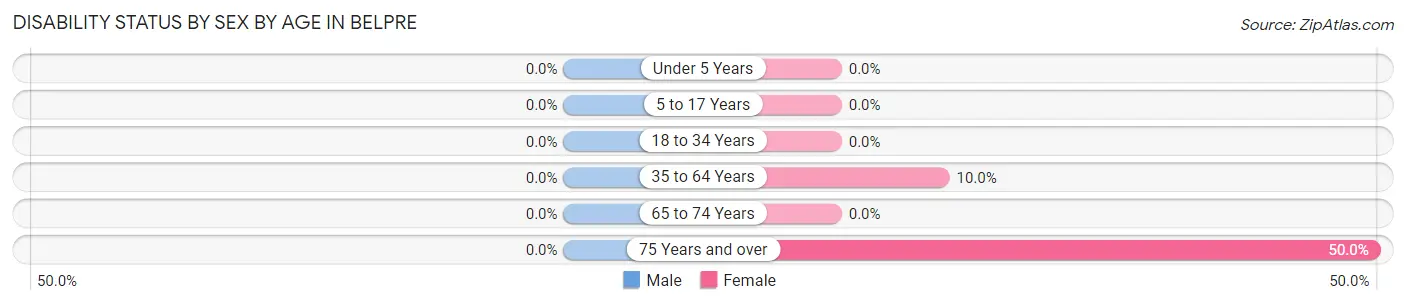
| Age Bracket | Male | Female |
| Under 5 Years | 0 (0.0%) | 0 (0.0%) |
| 5 to 17 Years | 0 (0.0%) | 0 (0.0%) |
| 18 to 34 Years | 0 (0.0%) | 0 (0.0%) |
| 35 to 64 Years | 0 (0.0%) | 1 (10.0%) |
| 65 to 74 Years | 0 (0.0%) | 0 (0.0%) |
| 75 Years and over | 0 (0.0%) | 1 (50.0%) |
Disability Class by Sex by Age in Belpre
Disability Class: Hearing Difficulty
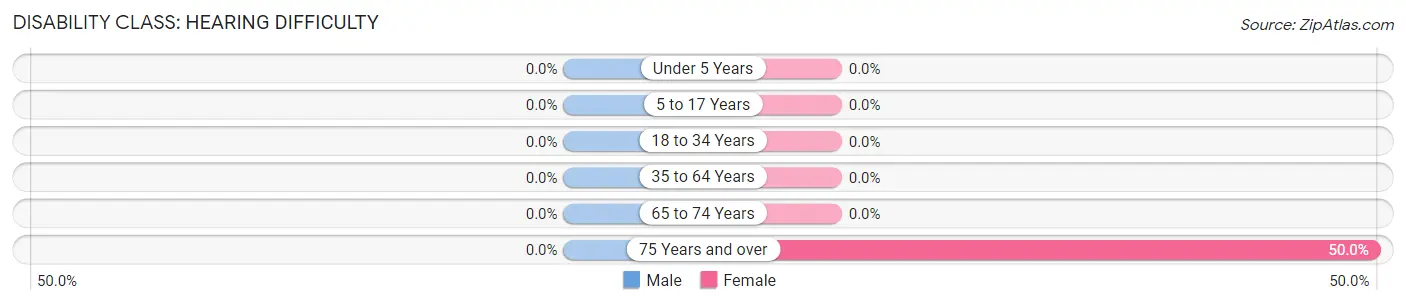
| Age Bracket | Male | Female |
| Under 5 Years | 0 (0.0%) | 0 (0.0%) |
| 5 to 17 Years | 0 (0.0%) | 0 (0.0%) |
| 18 to 34 Years | 0 (0.0%) | 0 (0.0%) |
| 35 to 64 Years | 0 (0.0%) | 0 (0.0%) |
| 65 to 74 Years | 0 (0.0%) | 0 (0.0%) |
| 75 Years and over | 0 (0.0%) | 1 (50.0%) |
Disability Class: Vision Difficulty
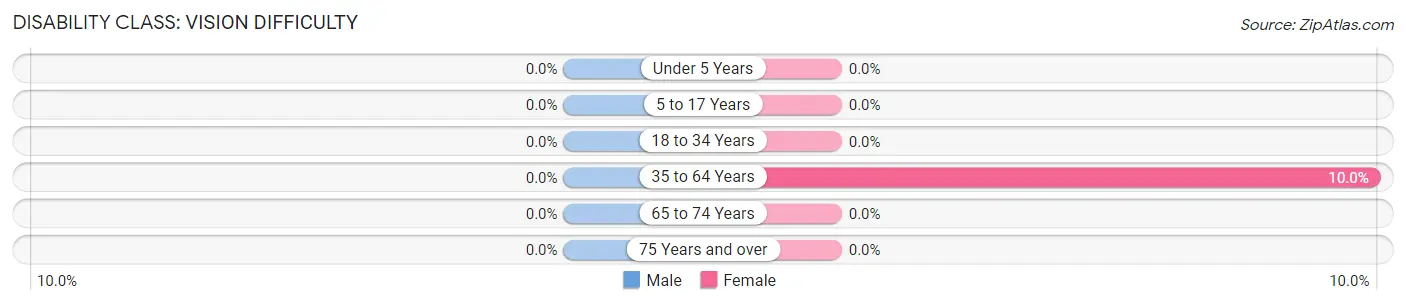
| Age Bracket | Male | Female |
| Under 5 Years | 0 (0.0%) | 0 (0.0%) |
| 5 to 17 Years | 0 (0.0%) | 0 (0.0%) |
| 18 to 34 Years | 0 (0.0%) | 0 (0.0%) |
| 35 to 64 Years | 0 (0.0%) | 1 (10.0%) |
| 65 to 74 Years | 0 (0.0%) | 0 (0.0%) |
| 75 Years and over | 0 (0.0%) | 0 (0.0%) |
Disability Class: Cognitive Difficulty

| Age Bracket | Male | Female |
| 5 to 17 Years | 0 (0.0%) | 0 (0.0%) |
| 18 to 34 Years | 0 (0.0%) | 0 (0.0%) |
| 35 to 64 Years | 0 (0.0%) | 0 (0.0%) |
| 65 to 74 Years | 0 (0.0%) | 0 (0.0%) |
| 75 Years and over | 0 (0.0%) | 0 (0.0%) |
Disability Class: Ambulatory Difficulty
| Age Bracket | Male | Female |
| 5 to 17 Years | 0 (0.0%) | 0 (0.0%) |
| 18 to 34 Years | 0 (0.0%) | 0 (0.0%) |
| 35 to 64 Years | 0 (0.0%) | 0 (0.0%) |
| 65 to 74 Years | 0 (0.0%) | 0 (0.0%) |
| 75 Years and over | 0 (0.0%) | 0 (0.0%) |
Disability Class: Self-Care Difficulty
| Age Bracket | Male | Female |
| 5 to 17 Years | 0 (0.0%) | 0 (0.0%) |
| 18 to 34 Years | 0 (0.0%) | 0 (0.0%) |
| 35 to 64 Years | 0 (0.0%) | 0 (0.0%) |
| 65 to 74 Years | 0 (0.0%) | 0 (0.0%) |
| 75 Years and over | 0 (0.0%) | 0 (0.0%) |
Technology Access in Belpre
Computing Device Access in Belpre
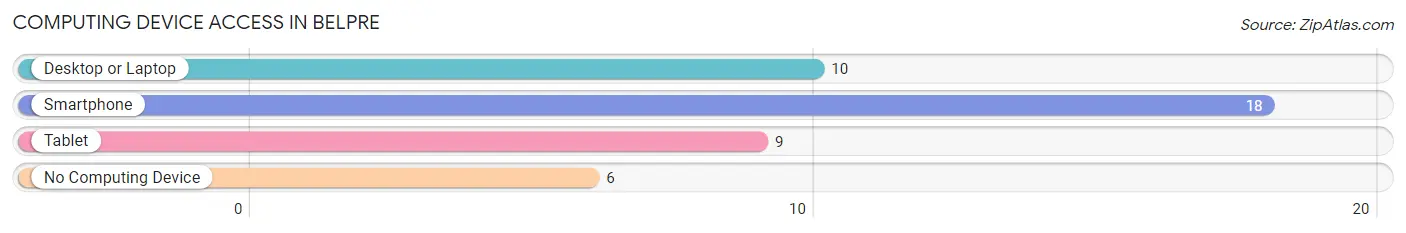
| Device Type | # Households | % Households |
| Desktop or Laptop | 10 | 40.0% |
| Smartphone | 18 | 72.0% |
| Tablet | 9 | 36.0% |
| No Computing Device | 6 | 24.0% |
| Total | 25 | 100.0% |
Internet Access in Belpre
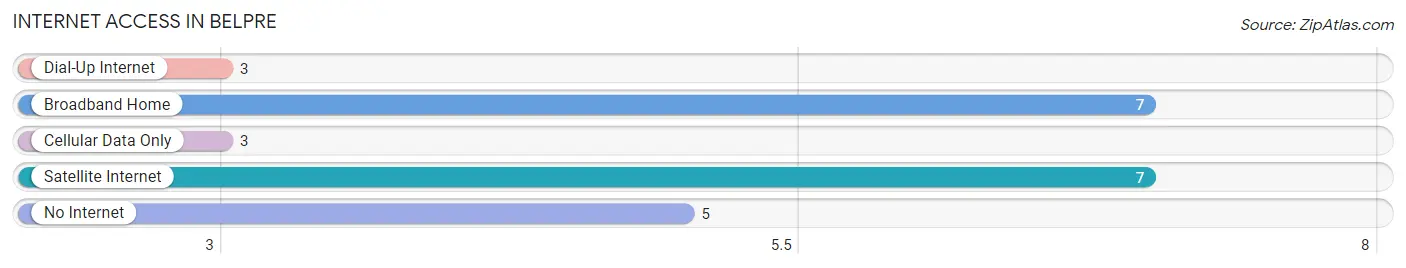
| Internet Type | # Households | % Households |
| Dial-Up Internet | 3 | 12.0% |
| Broadband Home | 7 | 28.0% |
| Cellular Data Only | 3 | 12.0% |
| Satellite Internet | 7 | 28.0% |
| No Internet | 5 | 20.0% |
| Total | 25 | 100.0% |
Belpre Summary
Belpre, Kansas is a small town located in the northwest corner of the state, near the Nebraska border. It is part of the larger Sherman County, and is home to a population of just over 500 people. Belpre is a rural community, with a strong agricultural base, and is known for its friendly atmosphere and small-town charm.
History
Belpre was founded in 1887, when the railroad was extended to the area. The town was named after the nearby Belpre Creek, which was named after a Native American chief. The town was originally a farming community, and the first settlers were mostly of German descent.
In the early 1900s, Belpre began to grow and develop. The town was incorporated in 1909, and the first mayor was elected in 1910. The town was home to a variety of businesses, including a bank, a hotel, a general store, and a blacksmith shop.
In the 1920s, Belpre experienced a period of growth and prosperity. The town was home to a variety of businesses, including a movie theater, a bowling alley, and a variety of stores. The town also had a school, a library, and a post office.
In the 1950s, Belpre began to decline. The railroad was abandoned, and the town’s businesses began to close. The population began to decline, and by the 1970s, the town was nearly abandoned.
In the 1980s, Belpre began to experience a resurgence. The town was revitalized, and new businesses began to open. The population began to grow, and the town was once again thriving.
Geography
Belpre is located in the northwest corner of Kansas, near the Nebraska border. The town is situated in Sherman County, and is surrounded by rolling hills and farmland. The town is located on the banks of the Belpre Creek, and is home to a variety of wildlife, including deer, wild turkeys, and coyotes.
The climate in Belpre is typical of the Great Plains region. Summers are hot and dry, with temperatures reaching into the 90s. Winters are cold and dry, with temperatures often dropping below zero.
Economy
Belpre’s economy is largely based on agriculture. The town is home to a variety of farms, and the surrounding area is known for its production of wheat, corn, and soybeans. The town is also home to a variety of small businesses, including a grocery store, a hardware store, and a restaurant.
Demographics
As of the 2010 census, Belpre had a population of 517 people. The population is largely white, with a small percentage of African Americans and Hispanics. The median household income is $41,250, and the median home value is $90,000. The town is home to a variety of religious denominations, including Catholic, Lutheran, and Methodist.
Common Questions
What is Per Capita Income in Belpre?
Per Capita income in Belpre is $21,755.
What is the Median Family Income in Belpre?
Median Family Income in Belpre is $40,938.
What is the Median Household income in Belpre?
Median Household Income in Belpre is $29,063.
What is Inequality or Gini Index in Belpre?
Inequality or Gini Index in Belpre is 0.27.
What is the Total Population of Belpre?
Total Population of Belpre is 38.
What is the Total Male Population of Belpre?
Total Male Population of Belpre is 15.
What is the Total Female Population of Belpre?
Total Female Population of Belpre is 23.
What is the Ratio of Males per 100 Females in Belpre?
There are 65.22 Males per 100 Females in Belpre.
What is the Ratio of Females per 100 Males in Belpre?
There are 153.33 Females per 100 Males in Belpre.
What is the Median Population Age in Belpre?
Median Population Age in Belpre is 54.5 Years.
What is the Average Family Size in Belpre
Average Family Size in Belpre is 2.9 People.
What is the Average Household Size in Belpre
Average Household Size in Belpre is 1.5 People.
How Large is the Labor Force in Belpre?
There are 24 People in the Labor Forcein in Belpre.
What is the Percentage of People in the Labor Force in Belpre?
72.7% of People are in the Labor Force in Belpre.
What is the Unemployment Rate in Belpre?
Unemployment Rate in Belpre is 8.3%.