Walnut, KS Map & Demographics
Walnut Map
Walnut Overview
$27,168
PER CAPITA INCOME
$58,375
AVG FAMILY INCOME
$58,375
AVG HOUSEHOLD INCOME
59.7%
WAGE / INCOME GAP [ % ]
40.3¢/ $1
WAGE / INCOME GAP [ $ ]
$11,967
FAMILY INCOME DEFICIT
0.42
INEQUALITY / GINI INDEX
201
TOTAL POPULATION
113
MALE POPULATION
88
FEMALE POPULATION
128.41
MALES / 100 FEMALES
77.88
FEMALES / 100 MALES
40.0
MEDIAN AGE
2.9
AVG FAMILY SIZE
2.8
AVG HOUSEHOLD SIZE
120
LABOR FORCE [ PEOPLE ]
73.6%
PERCENT IN LABOR FORCE
5.8%
UNEMPLOYMENT RATE
Walnut Zip Codes
Walnut Area Codes
Income in Walnut
Income Overview in Walnut
Per Capita Income in Walnut is $27,168, while median incomes of families and households are $58,375 and $58,375 respectively.
| Characteristic | Number | Measure |
| Per Capita Income | 201 | $27,168 |
| Median Family Income | 55 | $58,375 |
| Mean Family Income | 55 | $65,911 |
| Median Household Income | 71 | $58,375 |
| Mean Household Income | 71 | $74,801 |
| Income Deficit | 55 | $11,967 |
| Wage / Income Gap (%) | 201 | 59.73% |
| Wage / Income Gap ($) | 201 | 40.27¢ per $1 |
| Gini / Inequality Index | 201 | 0.42 |
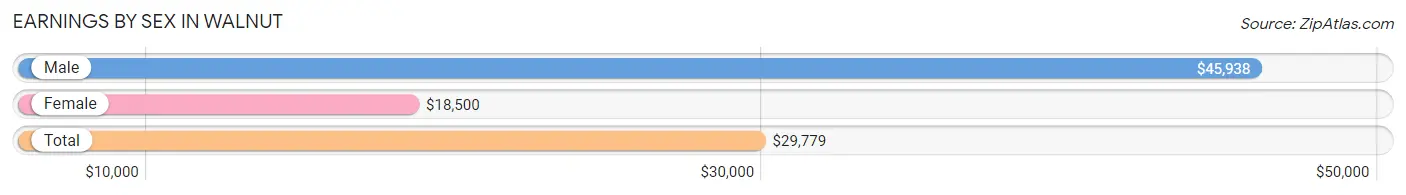
Earnings by Sex in Walnut
Average Earnings in Walnut are $29,779, $45,938 for men and $18,500 for women, a difference of 59.7%.
| Sex | Number | Average Earnings |
| Male | 67 (58.3%) | $45,938 |
| Female | 48 (41.7%) | $18,500 |
| Total | 115 (100.0%) | $29,779 |
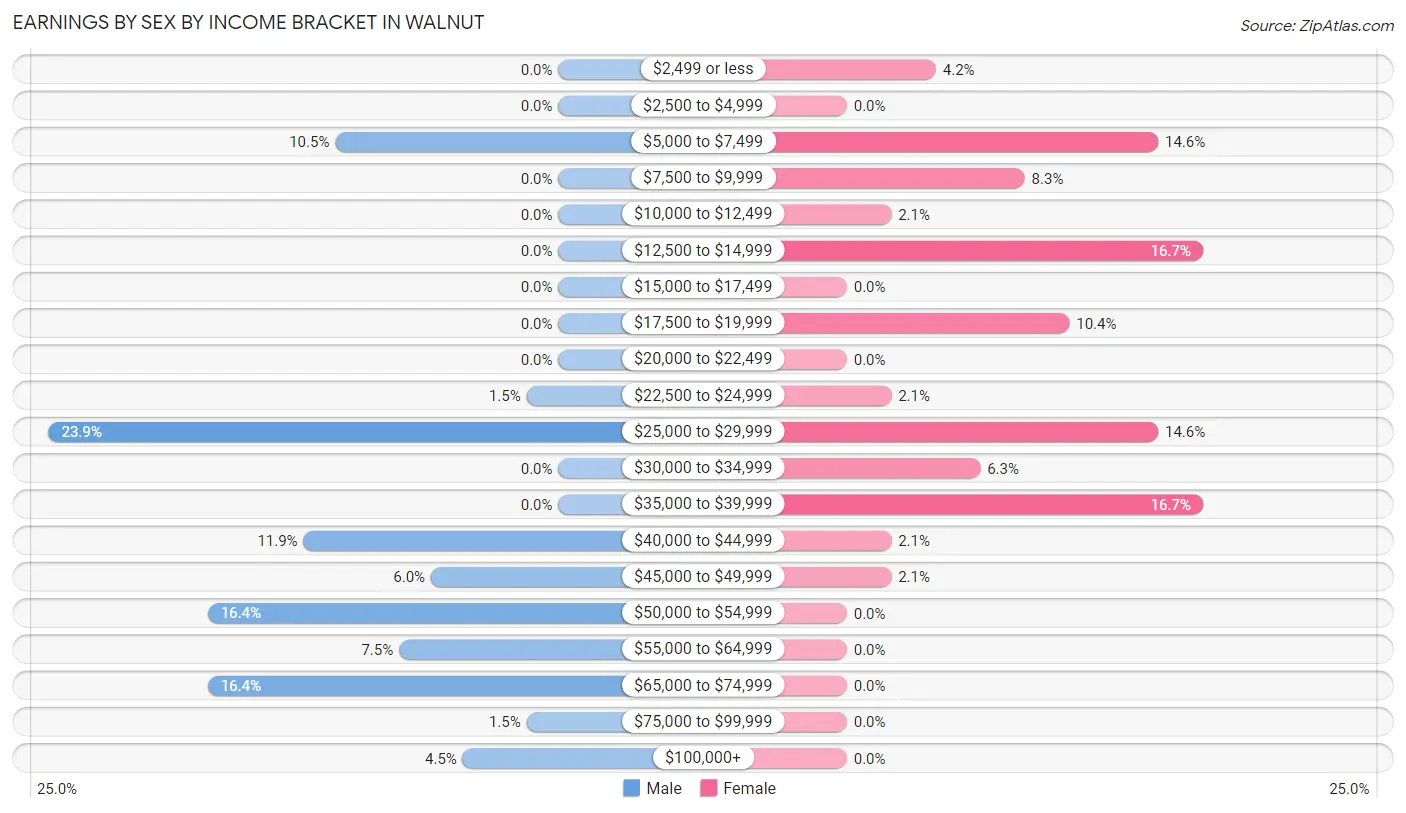
Earnings by Sex by Income Bracket in Walnut
The most common earnings brackets in Walnut are $25,000 to $29,999 for men (16 | 23.9%) and $12,500 to $14,999 for women (8 | 16.7%).
| Income | Male | Female |
| $2,499 or less | 0 (0.0%) | 2 (4.2%) |
| $2,500 to $4,999 | 0 (0.0%) | 0 (0.0%) |
| $5,000 to $7,499 | 7 (10.4%) | 7 (14.6%) |
| $7,500 to $9,999 | 0 (0.0%) | 4 (8.3%) |
| $10,000 to $12,499 | 0 (0.0%) | 1 (2.1%) |
| $12,500 to $14,999 | 0 (0.0%) | 8 (16.7%) |
| $15,000 to $17,499 | 0 (0.0%) | 0 (0.0%) |
| $17,500 to $19,999 | 0 (0.0%) | 5 (10.4%) |
| $20,000 to $22,499 | 0 (0.0%) | 0 (0.0%) |
| $22,500 to $24,999 | 1 (1.5%) | 1 (2.1%) |
| $25,000 to $29,999 | 16 (23.9%) | 7 (14.6%) |
| $30,000 to $34,999 | 0 (0.0%) | 3 (6.2%) |
| $35,000 to $39,999 | 0 (0.0%) | 8 (16.7%) |
| $40,000 to $44,999 | 8 (11.9%) | 1 (2.1%) |
| $45,000 to $49,999 | 4 (6.0%) | 1 (2.1%) |
| $50,000 to $54,999 | 11 (16.4%) | 0 (0.0%) |
| $55,000 to $64,999 | 5 (7.5%) | 0 (0.0%) |
| $65,000 to $74,999 | 11 (16.4%) | 0 (0.0%) |
| $75,000 to $99,999 | 1 (1.5%) | 0 (0.0%) |
| $100,000+ | 3 (4.5%) | 0 (0.0%) |
| Total | 67 (100.0%) | 48 (100.0%) |
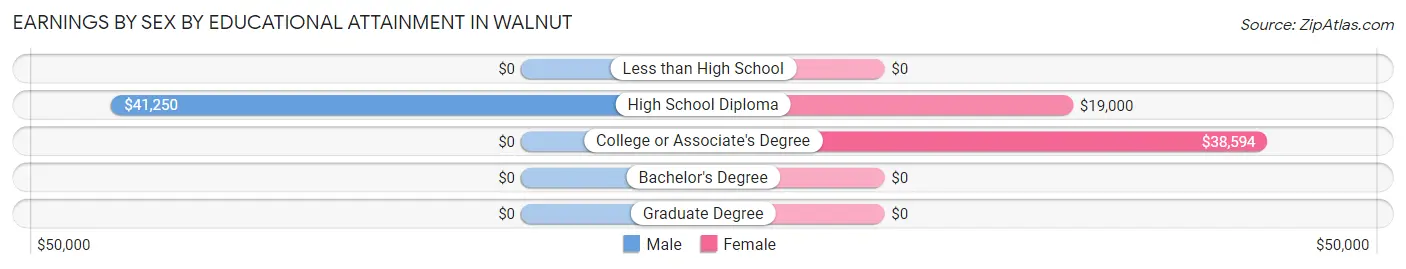
Earnings by Sex by Educational Attainment in Walnut
Average earnings in Walnut are $42,143 for men and $26,042 for women, a difference of 38.2%. Men with an educational attainment of high school diploma enjoy the highest average annual earnings of $41,250, while those with high school diploma education earn the least with $41,250. Women with an educational attainment of college or associate's degree earn the most with the average annual earnings of $38,594, while those with high school diploma education have the smallest earnings of $19,000.
| Educational Attainment | Male Income | Female Income |
| Less than High School | - | - |
| High School Diploma | $41,250 | $19,000 |
| College or Associate's Degree | - | - |
| Bachelor's Degree | - | - |
| Graduate Degree | - | - |
| Total | $42,143 | $26,042 |
Family Income in Walnut
Family Income Brackets in Walnut
According to the Walnut family income data, there are 14 families falling into the $50,000 to $74,999 income range, which is the most common income bracket and makes up 25.5% of all families.
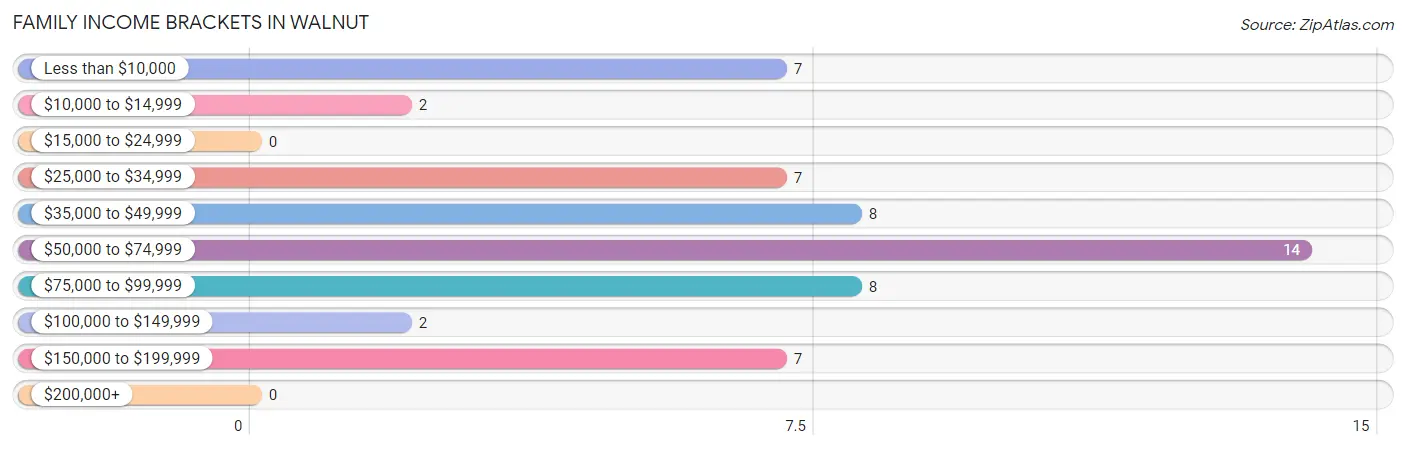
| Income Bracket | # Families | % Families |
| Less than $10,000 | 7 | 12.7% |
| $10,000 to $14,999 | 2 | 3.6% |
| $15,000 to $24,999 | 0 | 0.0% |
| $25,000 to $34,999 | 7 | 12.7% |
| $35,000 to $49,999 | 8 | 14.5% |
| $50,000 to $74,999 | 14 | 25.5% |
| $75,000 to $99,999 | 8 | 14.5% |
| $100,000 to $149,999 | 2 | 3.6% |
| $150,000 to $199,999 | 7 | 12.7% |
| $200,000+ | 0 | 0.0% |
Family Income by Famaliy Size in Walnut
3-person families (13 | 23.6%) account for the highest median family income in Walnut with $85,536 per family, while 3-person families (13 | 23.6%) have the highest median income of $28,512 per family member.
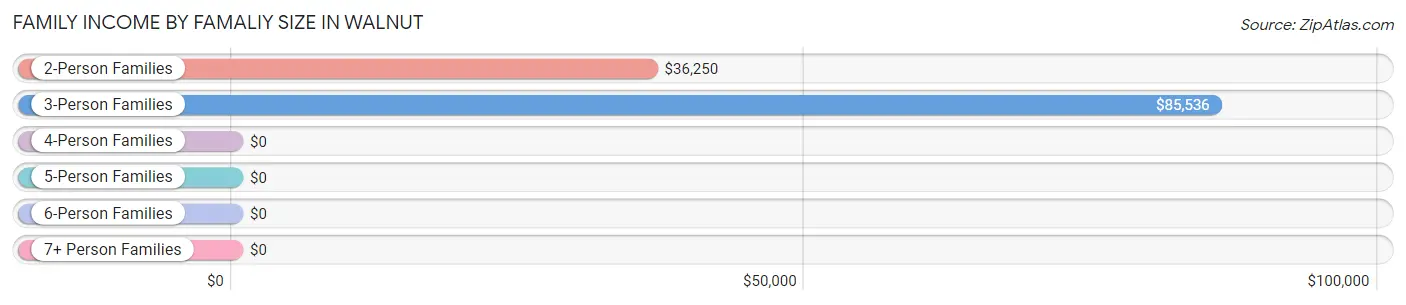
| Income Bracket | # Families | Median Income |
| 2-Person Families | 28 (50.9%) | $36,250 |
| 3-Person Families | 13 (23.6%) | $85,536 |
| 4-Person Families | 7 (12.7%) | $0 |
| 5-Person Families | 7 (12.7%) | $0 |
| 6-Person Families | 0 (0.0%) | $0 |
| 7+ Person Families | 0 (0.0%) | $0 |
| Total | 55 (100.0%) | $58,375 |
Family Income by Number of Earners in Walnut
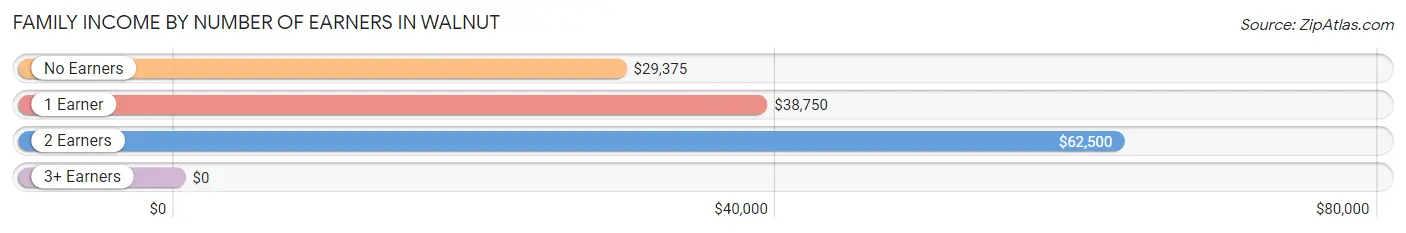
| Number of Earners | # Families | Median Income |
| No Earners | 7 (12.7%) | $29,375 |
| 1 Earner | 26 (47.3%) | $38,750 |
| 2 Earners | 8 (14.5%) | $62,500 |
| 3+ Earners | 14 (25.5%) | $0 |
| Total | 55 (100.0%) | $58,375 |
Household Income in Walnut
Household Income Brackets in Walnut
With 24 households falling in the category, the $50,000 to $74,999 income range is the most frequent in Walnut, accounting for 33.8% of all households.
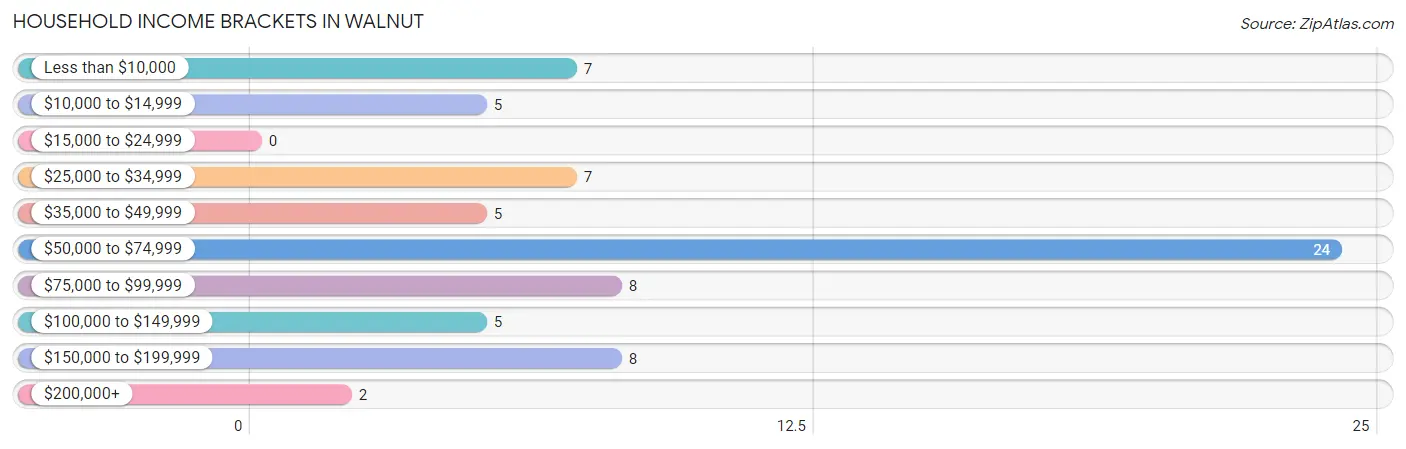
| Income Bracket | # Households | % Households |
| Less than $10,000 | 7 | 9.9% |
| $10,000 to $14,999 | 5 | 7.0% |
| $15,000 to $24,999 | 0 | 0.0% |
| $25,000 to $34,999 | 7 | 9.9% |
| $35,000 to $49,999 | 5 | 7.0% |
| $50,000 to $74,999 | 24 | 33.8% |
| $75,000 to $99,999 | 8 | 11.3% |
| $100,000 to $149,999 | 5 | 7.0% |
| $150,000 to $199,999 | 8 | 11.3% |
| $200,000+ | 2 | 2.8% |
Household Income by Householder Age in Walnut
The median household income in Walnut is $58,375, with the highest median household income of $83,750 found in the 45 to 64 years age bracket for the primary householder. A total of 14 households (19.7%) fall into this category. Meanwhile, the 15 to 24 years age bracket for the primary householder has the lowest median household income of $0, with 2 households (2.8%) in this group.
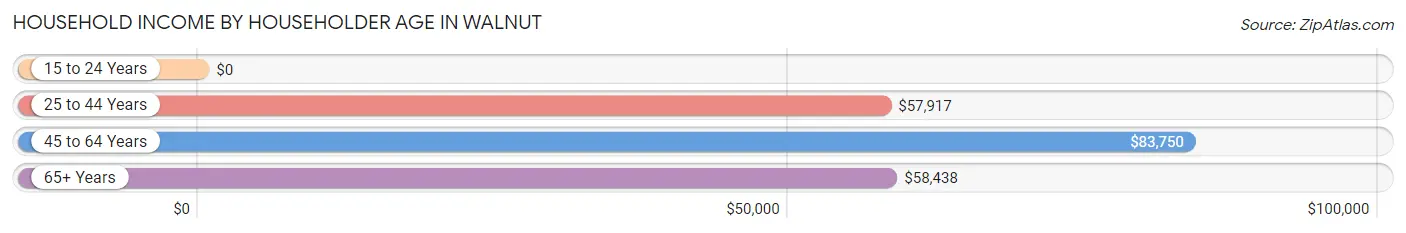
| Income Bracket | # Households | Median Income |
| 15 to 24 Years | 2 (2.8%) | $0 |
| 25 to 44 Years | 42 (59.2%) | $57,917 |
| 45 to 64 Years | 14 (19.7%) | $83,750 |
| 65+ Years | 13 (18.3%) | $58,438 |
| Total | 71 (100.0%) | $58,375 |
Poverty in Walnut
Income Below Poverty by Sex and Age in Walnut
With 15.9% poverty level for males and 29.5% for females among the residents of Walnut, 35 to 44 year old males and 16 and 17 year old females are the most vulnerable to poverty, with 12 males (40.0%) and 7 females (100.0%) in their respective age groups living below the poverty level.
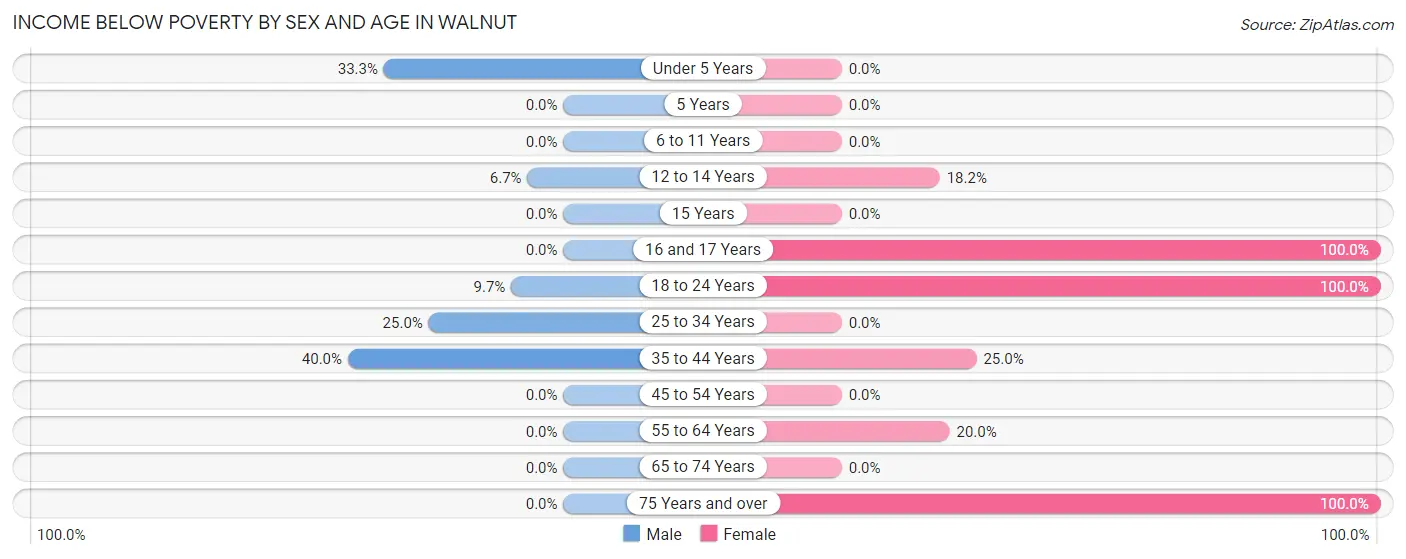
| Age Bracket | Male | Female |
| Under 5 Years | 1 (33.3%) | 0 (0.0%) |
| 5 Years | 0 (0.0%) | 0 (0.0%) |
| 6 to 11 Years | 0 (0.0%) | 0 (0.0%) |
| 12 to 14 Years | 1 (6.7%) | 2 (18.2%) |
| 15 Years | 0 (0.0%) | 0 (0.0%) |
| 16 and 17 Years | 0 (0.0%) | 7 (100.0%) |
| 18 to 24 Years | 3 (9.7%) | 6 (100.0%) |
| 25 to 34 Years | 1 (25.0%) | 0 (0.0%) |
| 35 to 44 Years | 12 (40.0%) | 7 (25.0%) |
| 45 to 54 Years | 0 (0.0%) | 0 (0.0%) |
| 55 to 64 Years | 0 (0.0%) | 2 (20.0%) |
| 65 to 74 Years | 0 (0.0%) | 0 (0.0%) |
| 75 Years and over | 0 (0.0%) | 2 (100.0%) |
| Total | 18 (15.9%) | 26 (29.5%) |
Income Above Poverty by Sex and Age in Walnut
According to the poverty statistics in Walnut, males aged 6 to 11 years and females aged 6 to 11 years are the age groups that are most secure financially, with 100.0% of males and 100.0% of females in these age groups living above the poverty line.
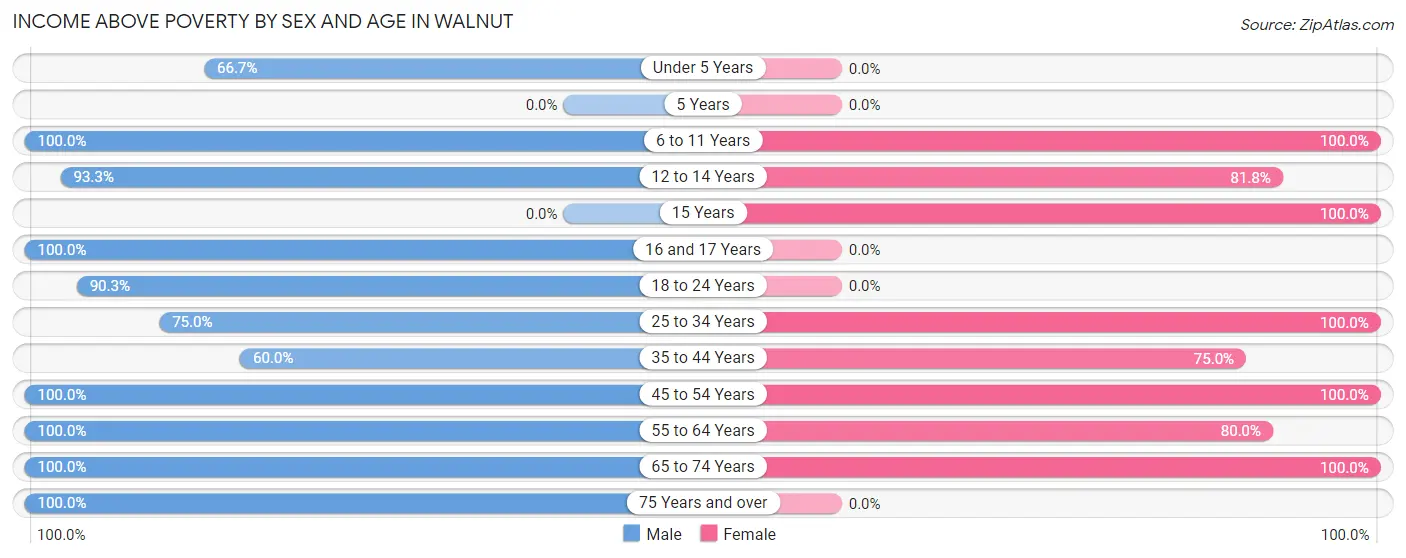
| Age Bracket | Male | Female |
| Under 5 Years | 2 (66.7%) | 0 (0.0%) |
| 5 Years | 0 (0.0%) | 0 (0.0%) |
| 6 to 11 Years | 2 (100.0%) | 5 (100.0%) |
| 12 to 14 Years | 14 (93.3%) | 9 (81.8%) |
| 15 Years | 0 (0.0%) | 2 (100.0%) |
| 16 and 17 Years | 2 (100.0%) | 0 (0.0%) |
| 18 to 24 Years | 28 (90.3%) | 0 (0.0%) |
| 25 to 34 Years | 3 (75.0%) | 1 (100.0%) |
| 35 to 44 Years | 18 (60.0%) | 21 (75.0%) |
| 45 to 54 Years | 3 (100.0%) | 11 (100.0%) |
| 55 to 64 Years | 10 (100.0%) | 8 (80.0%) |
| 65 to 74 Years | 12 (100.0%) | 5 (100.0%) |
| 75 Years and over | 1 (100.0%) | 0 (0.0%) |
| Total | 95 (84.1%) | 62 (70.5%) |
Income Below Poverty Among Married-Couple Families in Walnut
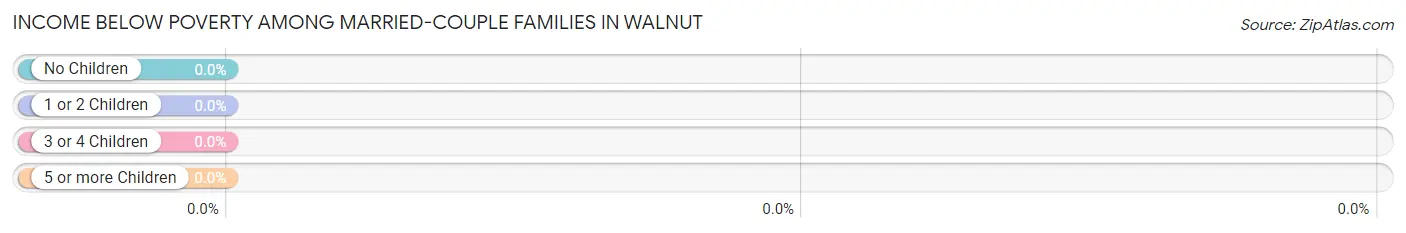
| Children | Above Poverty | Below Poverty |
| No Children | 28 (100.0%) | 0 (0.0%) |
| 1 or 2 Children | 1 (100.0%) | 0 (0.0%) |
| 3 or 4 Children | 7 (100.0%) | 0 (0.0%) |
| 5 or more Children | 0 (0.0%) | 0 (0.0%) |
| Total | 36 (100.0%) | 0 (0.0%) |
Income Below Poverty Among Single-Parent Households in Walnut
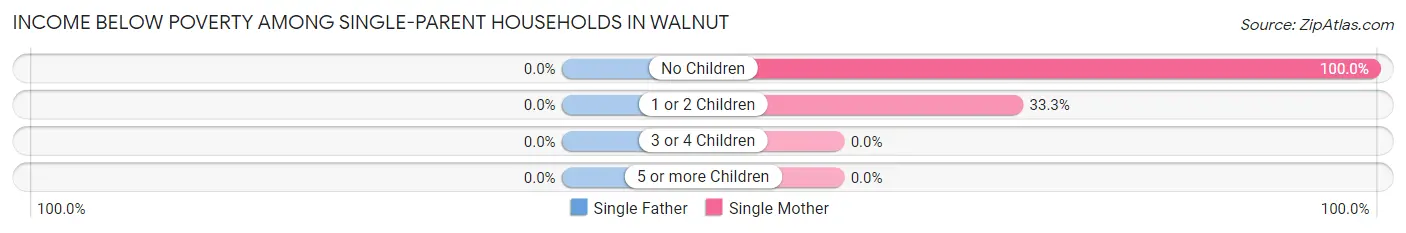
| Children | Single Father | Single Mother |
| No Children | 0 (0.0%) | 5 (100.0%) |
| 1 or 2 Children | 0 (0.0%) | 4 (33.3%) |
| 3 or 4 Children | 0 (0.0%) | 0 (0.0%) |
| 5 or more Children | 0 (0.0%) | 0 (0.0%) |
| Total | 0 (0.0%) | 9 (52.9%) |
Income Below Poverty Among Married-Couple vs Single-Parent Households in Walnut
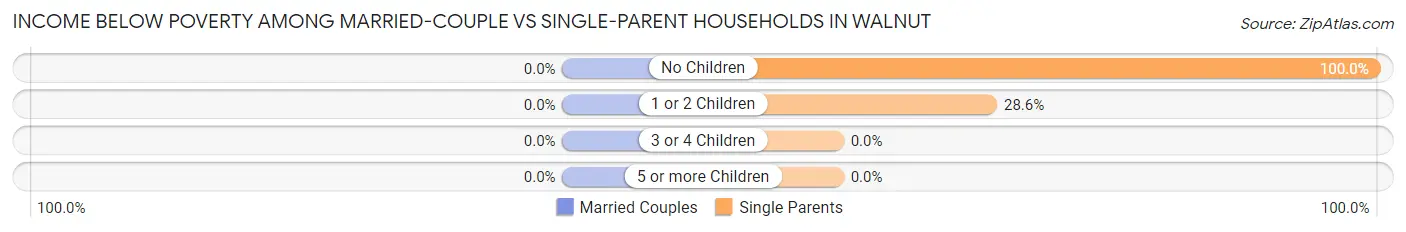
| Children | Married-Couple Families | Single-Parent Households |
| No Children | 0 (0.0%) | 5 (100.0%) |
| 1 or 2 Children | 0 (0.0%) | 4 (28.6%) |
| 3 or 4 Children | 0 (0.0%) | 0 (0.0%) |
| 5 or more Children | 0 (0.0%) | 0 (0.0%) |
| Total | 0 (0.0%) | 9 (47.4%) |
Race in Walnut
The most populous races in Walnut are White / Caucasian (182 | 90.5%), and Two or more Races (19 | 9.5%).
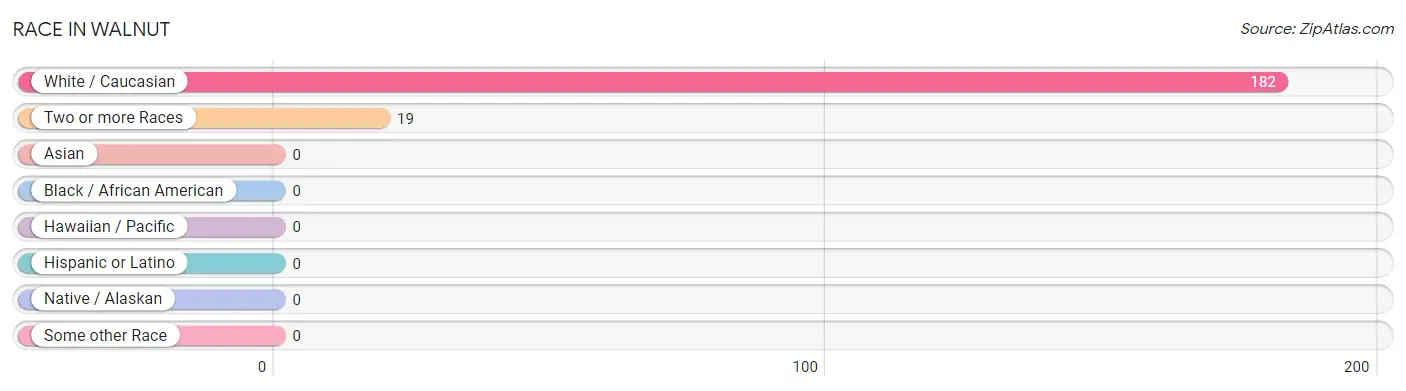
| Race | # Population | % Population |
| Asian | 0 | 0.0% |
| Black / African American | 0 | 0.0% |
| Hawaiian / Pacific | 0 | 0.0% |
| Hispanic or Latino | 0 | 0.0% |
| Native / Alaskan | 0 | 0.0% |
| White / Caucasian | 182 | 90.5% |
| Two or more Races | 19 | 9.5% |
| Some other Race | 0 | 0.0% |
| Total | 201 | 100.0% |
Ancestry in Walnut
The most populous ancestries reported in Walnut are Irish (38 | 18.9%), German (30 | 14.9%), Dutch (15 | 7.5%), Scotch-Irish (12 | 6.0%), and English (9 | 4.5%), together accounting for 51.7% of all Walnut residents.
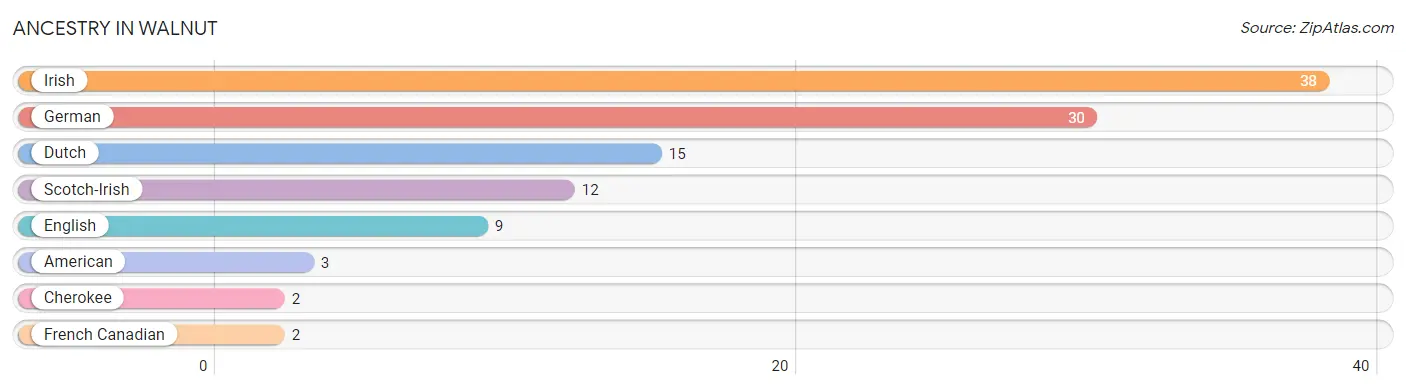
| Ancestry | # Population | % Population |
| American | 3 | 1.5% |
| Cherokee | 2 | 1.0% |
| Dutch | 15 | 7.5% |
| English | 9 | 4.5% |
| French Canadian | 2 | 1.0% |
| German | 30 | 14.9% |
| Irish | 38 | 18.9% |
| Scotch-Irish | 12 | 6.0% | View All 8 Rows |
Immigrants in Walnut

| Immigration Origin | # Population | % Population | View All 0 Rows |
Sex and Age in Walnut
Sex and Age in Walnut
The most populous age groups in Walnut are 20 to 24 Years (31 | 27.4%) for men and 40 to 44 Years (21 | 23.9%) for women.
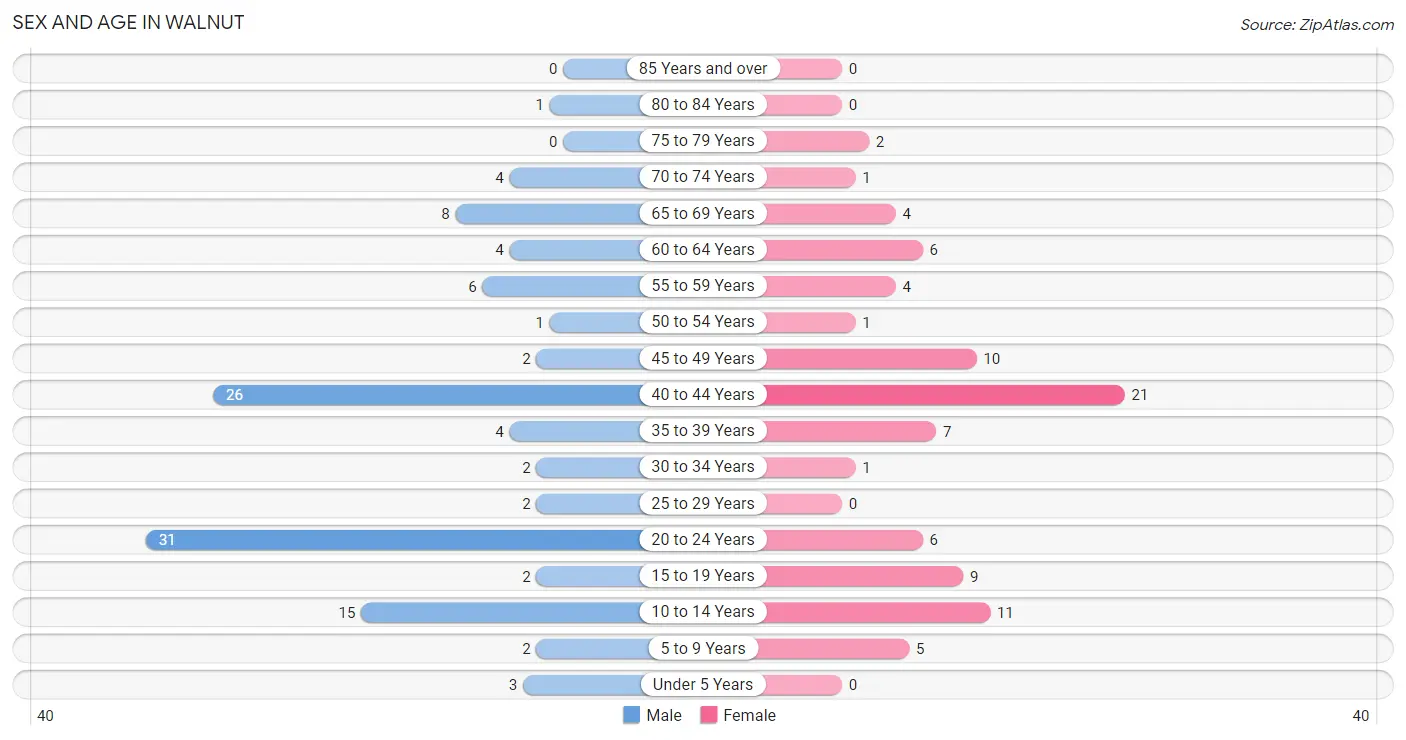
| Age Bracket | Male | Female |
| Under 5 Years | 3 (2.6%) | 0 (0.0%) |
| 5 to 9 Years | 2 (1.8%) | 5 (5.7%) |
| 10 to 14 Years | 15 (13.3%) | 11 (12.5%) |
| 15 to 19 Years | 2 (1.8%) | 9 (10.2%) |
| 20 to 24 Years | 31 (27.4%) | 6 (6.8%) |
| 25 to 29 Years | 2 (1.8%) | 0 (0.0%) |
| 30 to 34 Years | 2 (1.8%) | 1 (1.1%) |
| 35 to 39 Years | 4 (3.5%) | 7 (8.0%) |
| 40 to 44 Years | 26 (23.0%) | 21 (23.9%) |
| 45 to 49 Years | 2 (1.8%) | 10 (11.4%) |
| 50 to 54 Years | 1 (0.9%) | 1 (1.1%) |
| 55 to 59 Years | 6 (5.3%) | 4 (4.5%) |
| 60 to 64 Years | 4 (3.5%) | 6 (6.8%) |
| 65 to 69 Years | 8 (7.1%) | 4 (4.5%) |
| 70 to 74 Years | 4 (3.5%) | 1 (1.1%) |
| 75 to 79 Years | 0 (0.0%) | 2 (2.3%) |
| 80 to 84 Years | 1 (0.9%) | 0 (0.0%) |
| 85 Years and over | 0 (0.0%) | 0 (0.0%) |
| Total | 113 (100.0%) | 88 (100.0%) |
Families and Households in Walnut
Median Family Size in Walnut
The median family size in Walnut is 2.89 persons per family, with married-couple families (36 | 65.4%) accounting for the largest median family size of 3.25 persons per family. On the other hand, single female/mother families (17 | 30.9%) represent the smallest median family size with 2.18 persons per family.
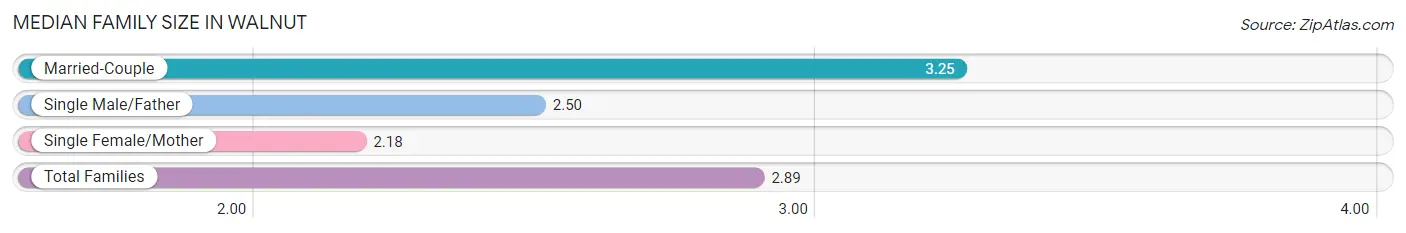
| Family Type | # Families | Family Size |
| Married-Couple | 36 (65.4%) | 3.25 |
| Single Male/Father | 2 (3.6%) | 2.50 |
| Single Female/Mother | 17 (30.9%) | 2.18 |
| Total Families | 55 (100.0%) | 2.89 |
Median Household Size in Walnut
The median household size in Walnut is 2.83 persons per household, with single male/father households (2 | 2.8%) accounting for the largest median household size of 3.5 persons per household. non-family households (16 | 22.5%) represent the smallest median household size with 1.13 persons per household.
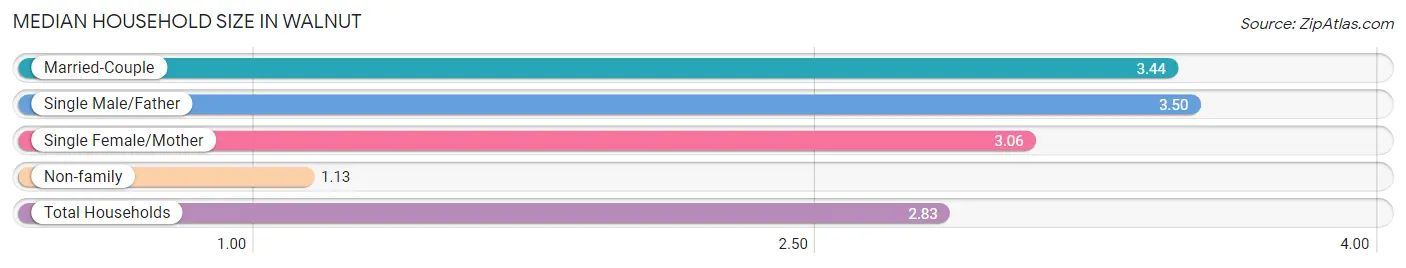
| Household Type | # Households | Household Size |
| Married-Couple | 36 (50.7%) | 3.44 |
| Single Male/Father | 2 (2.8%) | 3.50 |
| Single Female/Mother | 17 (23.9%) | 3.06 |
| Non-family | 16 (22.5%) | 1.13 |
| Total Households | 71 (100.0%) | 2.83 |
Household Size by Marriage Status in Walnut
Out of a total of 71 households in Walnut, 55 (77.5%) are family households, while 16 (22.5%) are nonfamily households. The most numerous type of family households are 2-person households, comprising 20, and the most common type of nonfamily households are 1-person households, comprising 14.
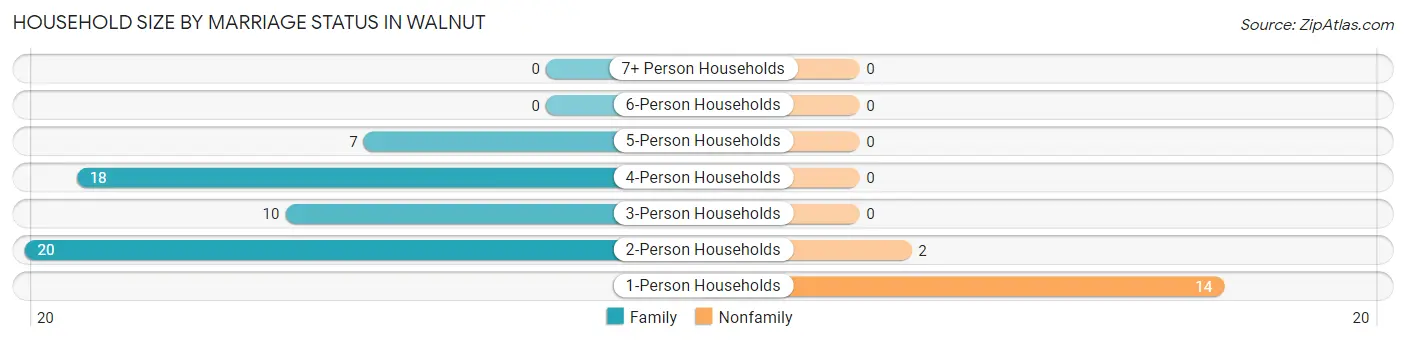
| Household Size | Family Households | Nonfamily Households |
| 1-Person Households | - | 14 (19.7%) |
| 2-Person Households | 20 (28.2%) | 2 (2.8%) |
| 3-Person Households | 10 (14.1%) | 0 (0.0%) |
| 4-Person Households | 18 (25.4%) | 0 (0.0%) |
| 5-Person Households | 7 (9.9%) | 0 (0.0%) |
| 6-Person Households | 0 (0.0%) | 0 (0.0%) |
| 7+ Person Households | 0 (0.0%) | 0 (0.0%) |
| Total | 55 (77.5%) | 16 (22.5%) |
Female Fertility in Walnut
Fertility by Age in Walnut
Average fertility rate in Walnut is 127.0 births per 1,000 women. Women in the age bracket of 20 to 34 years have the highest fertility rate with 286.0 births per 1,000 women. Women in the age bracket of 35 to 50 years acount for 71.4% of all women with births.
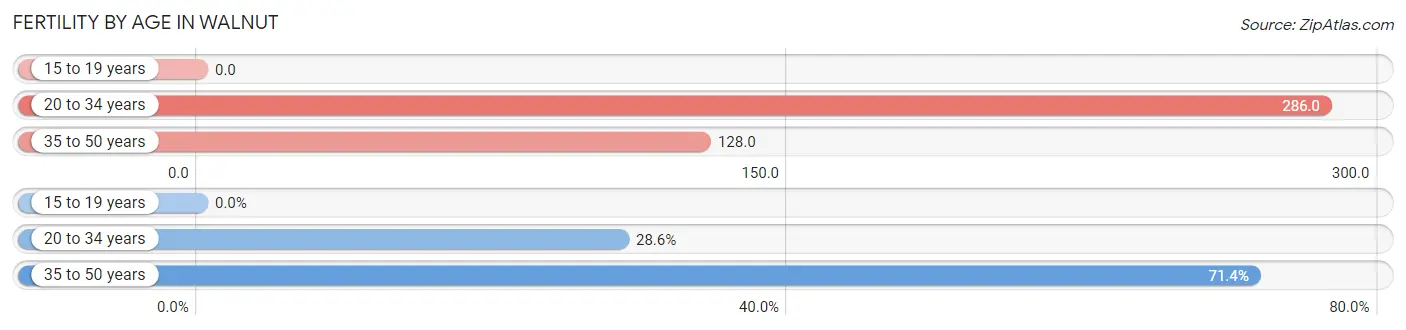
| Age Bracket | Women with Births | Births / 1,000 Women |
| 15 to 19 years | 0 (0.0%) | 0.0 |
| 20 to 34 years | 2 (28.6%) | 286.0 |
| 35 to 50 years | 5 (71.4%) | 128.0 |
| Total | 7 (100.0%) | 127.0 |
Fertility by Age by Marriage Status in Walnut
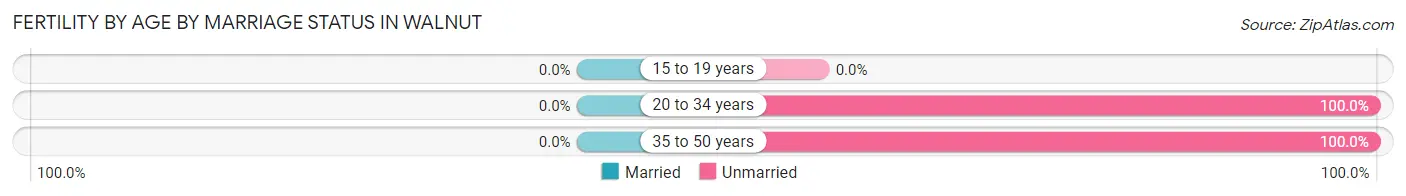
| Age Bracket | Married | Unmarried |
| 15 to 19 years | 0 (0.0%) | 0 (0.0%) |
| 20 to 34 years | 0 (0.0%) | 2 (100.0%) |
| 35 to 50 years | 0 (0.0%) | 5 (100.0%) |
| Total | 0 (0.0%) | 7 (100.0%) |
Fertility by Education in Walnut
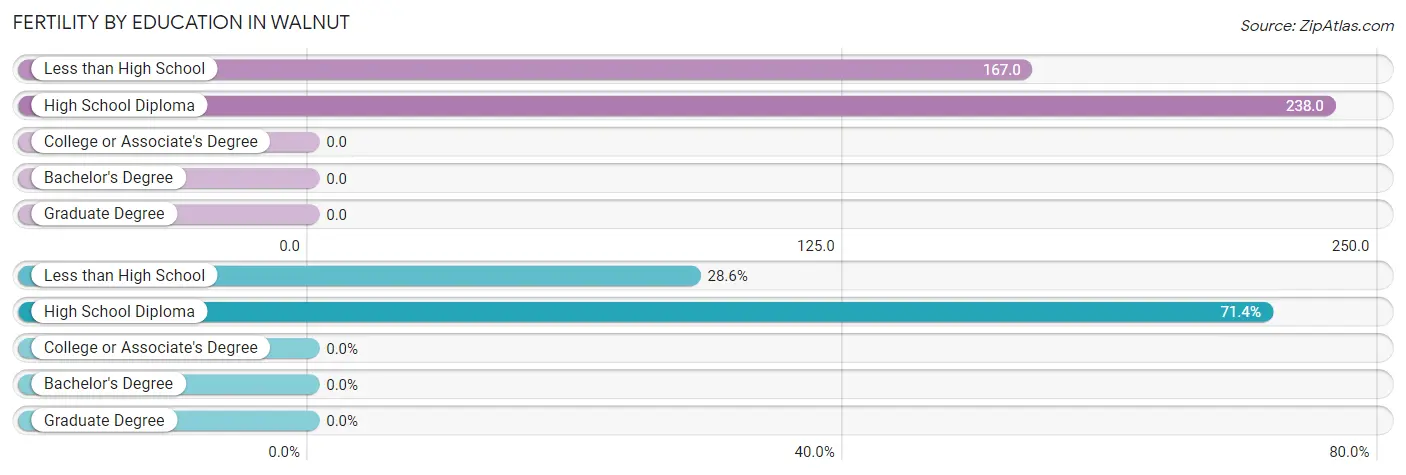
| Educational Attainment | Women with Births | Births / 1,000 Women |
| Less than High School | 2 (28.6%) | 167.0 |
| High School Diploma | 5 (71.4%) | 238.0 |
| College or Associate's Degree | 0 (0.0%) | 0.0 |
| Bachelor's Degree | 0 (0.0%) | 0.0 |
| Graduate Degree | 0 (0.0%) | 0.0 |
| Total | 7 (100.0%) | 127.0 |
Fertility by Education by Marriage Status in Walnut
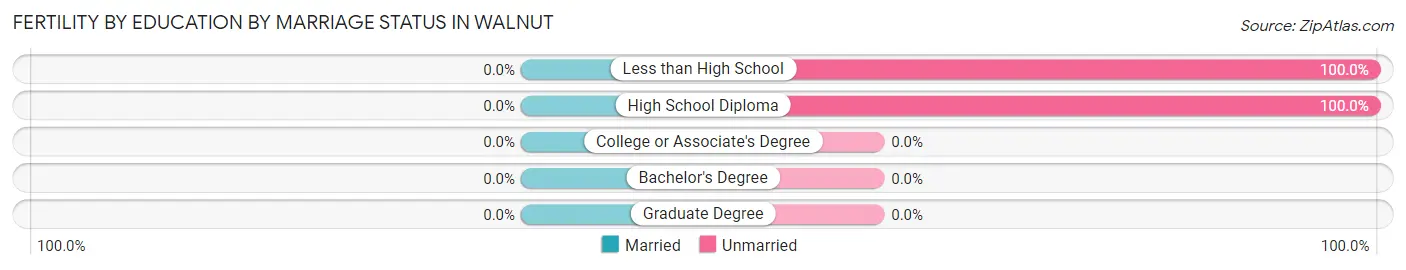
| Educational Attainment | Married | Unmarried |
| Less than High School | 0 (0.0%) | 2 (100.0%) |
| High School Diploma | 0 (0.0%) | 5 (100.0%) |
| College or Associate's Degree | 0 (0.0%) | 0 (0.0%) |
| Bachelor's Degree | 0 (0.0%) | 0 (0.0%) |
| Graduate Degree | 0 (0.0%) | 0 (0.0%) |
| Total | 0 (0.0%) | 7 (100.0%) |
Employment Characteristics in Walnut
Employment by Class of Employer in Walnut
Among the 113 employed individuals in Walnut, private company employees (93 | 82.3%), local government employees (8 | 7.1%), and not-for-profit organizations (5 | 4.4%) make up the most common classes of employment.
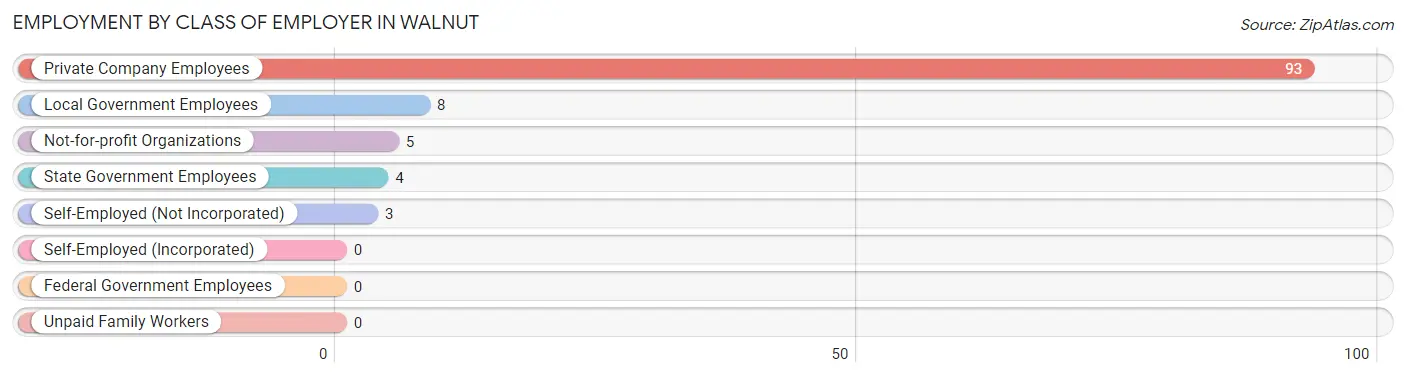
| Employer Class | # Employees | % Employees |
| Private Company Employees | 93 | 82.3% |
| Self-Employed (Incorporated) | 0 | 0.0% |
| Self-Employed (Not Incorporated) | 3 | 2.6% |
| Not-for-profit Organizations | 5 | 4.4% |
| Local Government Employees | 8 | 7.1% |
| State Government Employees | 4 | 3.5% |
| Federal Government Employees | 0 | 0.0% |
| Unpaid Family Workers | 0 | 0.0% |
| Total | 113 | 100.0% |
Employment Status by Age in Walnut
According to the labor force statistics for Walnut, out of the total population over 16 years of age (163), 73.6% or 120 individuals are in the labor force, with 5.8% or 7 of them unemployed. The age group with the highest labor force participation rate is 20 to 24 years, with 100.0% or 37 individuals in the labor force. Within the labor force, the 35 to 44 years age range has the highest percentage of unemployed individuals, with 12.5% or 5 of them being unemployed.
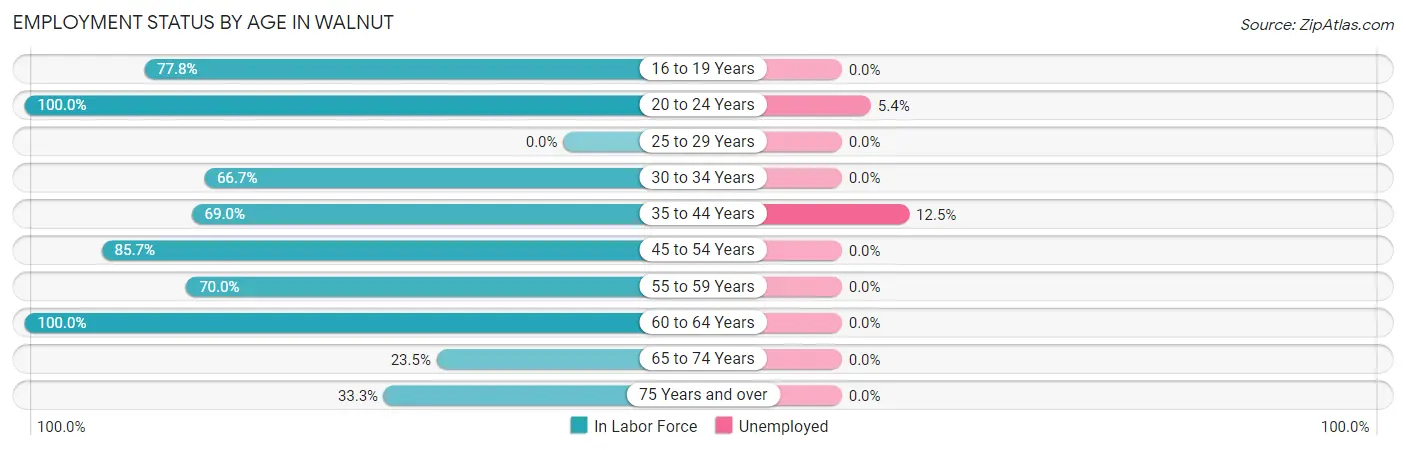
| Age Bracket | In Labor Force | Unemployed |
| 16 to 19 Years | 7 (77.8%) | 0 (0.0%) |
| 20 to 24 Years | 37 (100.0%) | 2 (5.4%) |
| 25 to 29 Years | 0 (0.0%) | 0 (0.0%) |
| 30 to 34 Years | 2 (66.7%) | 0 (0.0%) |
| 35 to 44 Years | 40 (69.0%) | 5 (12.5%) |
| 45 to 54 Years | 12 (85.7%) | 0 (0.0%) |
| 55 to 59 Years | 7 (70.0%) | 0 (0.0%) |
| 60 to 64 Years | 10 (100.0%) | 0 (0.0%) |
| 65 to 74 Years | 4 (23.5%) | 0 (0.0%) |
| 75 Years and over | 1 (33.3%) | 0 (0.0%) |
| Total | 120 (73.6%) | 7 (5.8%) |
Employment Status by Educational Attainment in Walnut
According to labor force statistics for Walnut, 73.2% of individuals (71) out of the total population between 25 and 64 years of age (97) are in the labor force, with 7.0% or 5 of them being unemployed. The group with the highest labor force participation rate are those with the educational attainment of bachelor's degree or higher, with 100.0% or 4 individuals in the labor force. Within the labor force, individuals with high school diploma education have the highest percentage of unemployment, with 14.7% or 5 of them being unemployed.
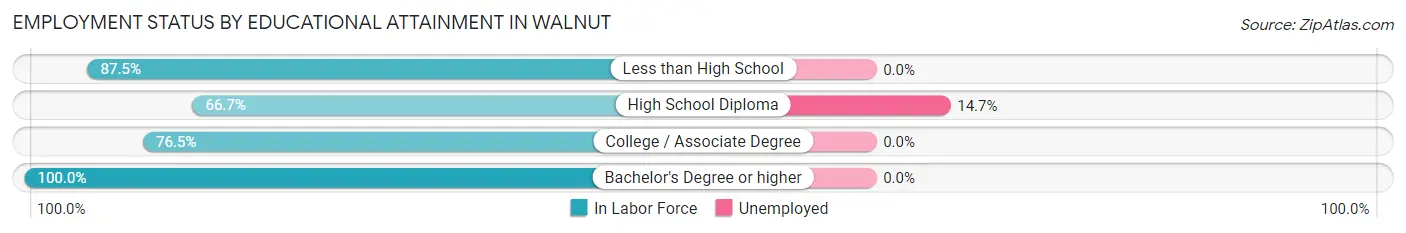
| Educational Attainment | In Labor Force | Unemployed |
| Less than High School | 7 (87.5%) | 0 (0.0%) |
| High School Diploma | 34 (66.7%) | 7 (14.7%) |
| College / Associate Degree | 26 (76.5%) | 0 (0.0%) |
| Bachelor's Degree or higher | 4 (100.0%) | 0 (0.0%) |
| Total | 71 (73.2%) | 7 (7.0%) |
Employment Occupations by Sex in Walnut
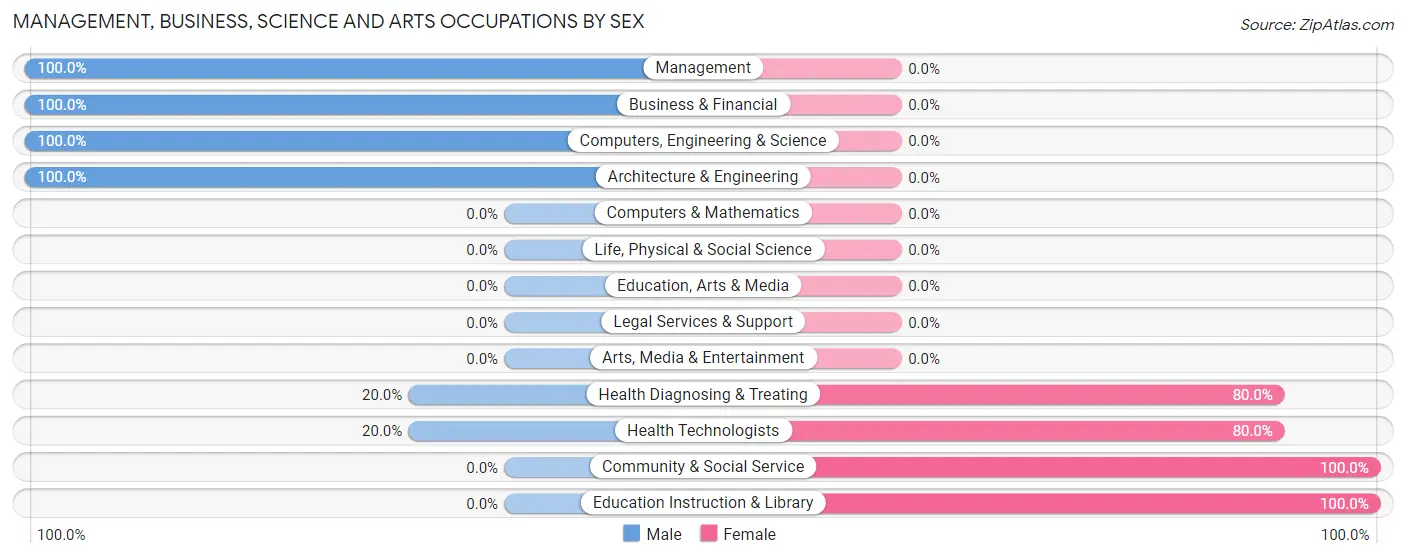
Management, Business, Science and Arts Occupations
The most common Management, Business, Science and Arts occupations in Walnut are Community & Social Service (12 | 10.6%), Education Instruction & Library (12 | 10.6%), Health Diagnosing & Treating (5 | 4.4%), Health Technologists (5 | 4.4%), and Management (3 | 2.6%).
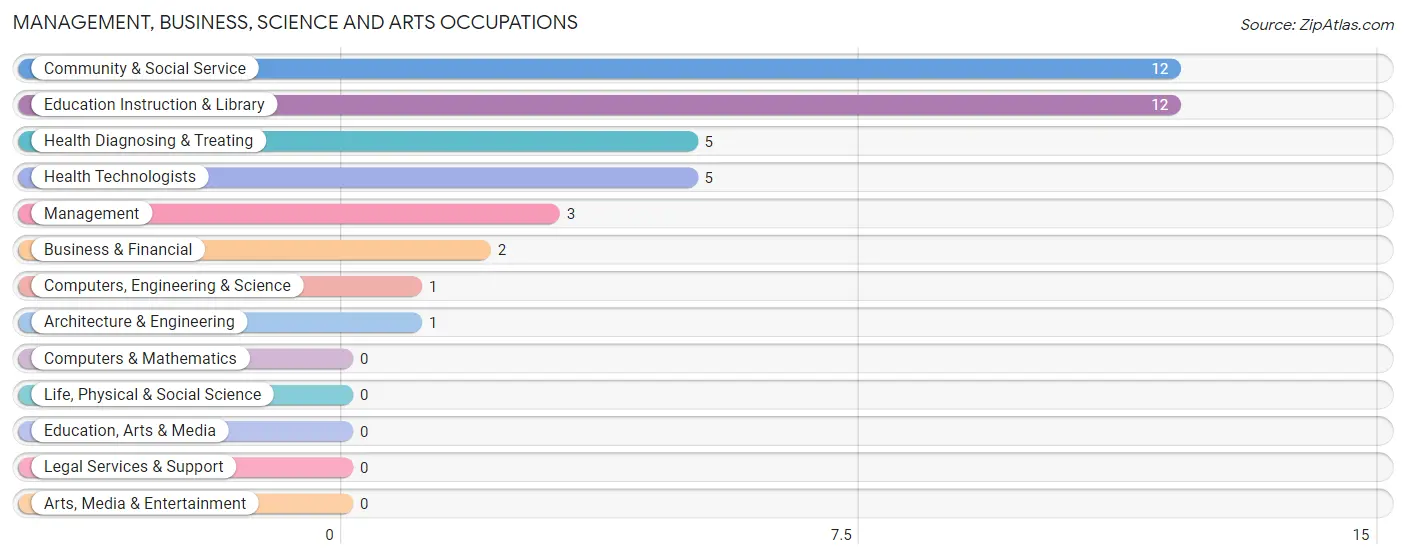
Management, Business, Science and Arts Occupations by Sex
Within the Management, Business, Science and Arts occupations in Walnut, the most male-oriented occupations are Management (100.0%), Business & Financial (100.0%), and Computers, Engineering & Science (100.0%), while the most female-oriented occupations are Community & Social Service (100.0%), Education Instruction & Library (100.0%), and Health Diagnosing & Treating (80.0%).
| Occupation | Male | Female |
| Management | 3 (100.0%) | 0 (0.0%) |
| Business & Financial | 2 (100.0%) | 0 (0.0%) |
| Computers, Engineering & Science | 1 (100.0%) | 0 (0.0%) |
| Computers & Mathematics | 0 (0.0%) | 0 (0.0%) |
| Architecture & Engineering | 1 (100.0%) | 0 (0.0%) |
| Life, Physical & Social Science | 0 (0.0%) | 0 (0.0%) |
| Community & Social Service | 0 (0.0%) | 12 (100.0%) |
| Education, Arts & Media | 0 (0.0%) | 0 (0.0%) |
| Legal Services & Support | 0 (0.0%) | 0 (0.0%) |
| Education Instruction & Library | 0 (0.0%) | 12 (100.0%) |
| Arts, Media & Entertainment | 0 (0.0%) | 0 (0.0%) |
| Health Diagnosing & Treating | 1 (20.0%) | 4 (80.0%) |
| Health Technologists | 1 (20.0%) | 4 (80.0%) |
| Total (Category) | 7 (30.4%) | 16 (69.6%) |
| Total (Overall) | 67 (59.3%) | 46 (40.7%) |
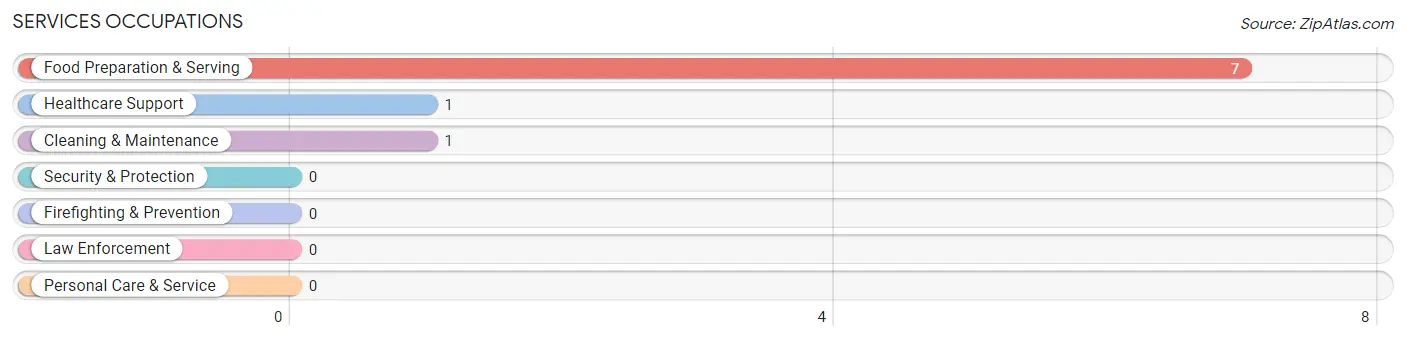
Services Occupations
The most common Services occupations in Walnut are Food Preparation & Serving (7 | 6.2%), Healthcare Support (1 | 0.9%), and Cleaning & Maintenance (1 | 0.9%).
Services Occupations by Sex
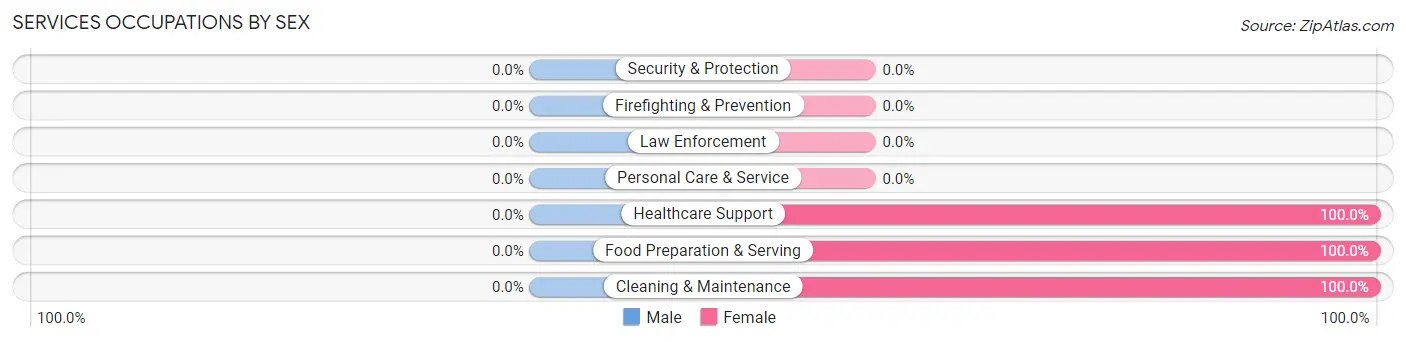
| Occupation | Male | Female |
| Healthcare Support | 0 (0.0%) | 1 (100.0%) |
| Security & Protection | 0 (0.0%) | 0 (0.0%) |
| Firefighting & Prevention | 0 (0.0%) | 0 (0.0%) |
| Law Enforcement | 0 (0.0%) | 0 (0.0%) |
| Food Preparation & Serving | 0 (0.0%) | 7 (100.0%) |
| Cleaning & Maintenance | 0 (0.0%) | 1 (100.0%) |
| Personal Care & Service | 0 (0.0%) | 0 (0.0%) |
| Total (Category) | 0 (0.0%) | 9 (100.0%) |
| Total (Overall) | 67 (59.3%) | 46 (40.7%) |
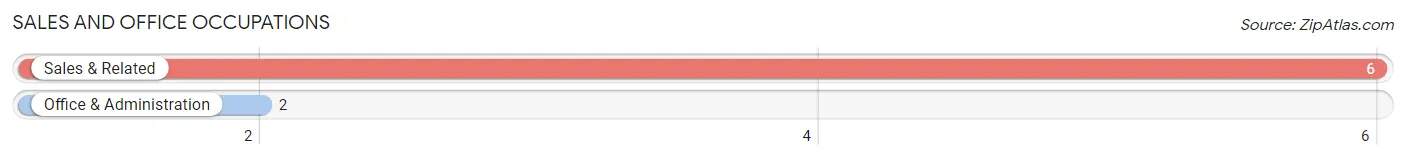
Sales and Office Occupations
The most common Sales and Office occupations in Walnut are Sales & Related (6 | 5.3%), and Office & Administration (2 | 1.8%).
Sales and Office Occupations by Sex
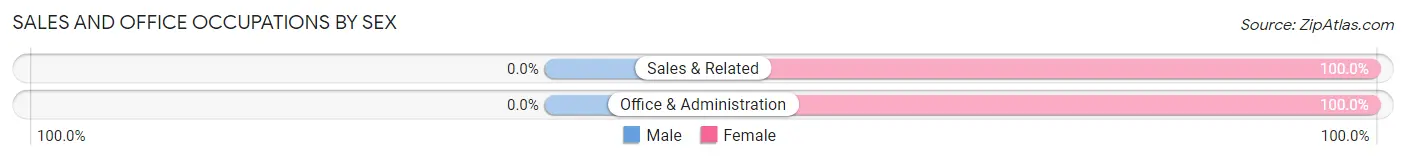
| Occupation | Male | Female |
| Sales & Related | 0 (0.0%) | 6 (100.0%) |
| Office & Administration | 0 (0.0%) | 2 (100.0%) |
| Total (Category) | 0 (0.0%) | 8 (100.0%) |
| Total (Overall) | 67 (59.3%) | 46 (40.7%) |
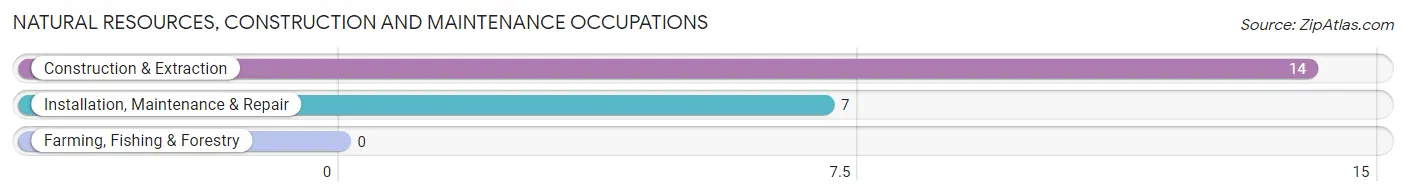
Natural Resources, Construction and Maintenance Occupations
The most common Natural Resources, Construction and Maintenance occupations in Walnut are Construction & Extraction (14 | 12.4%), and Installation, Maintenance & Repair (7 | 6.2%).
Natural Resources, Construction and Maintenance Occupations by Sex
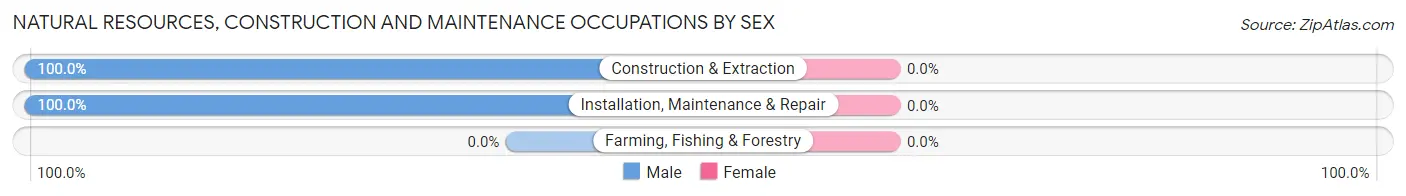
| Occupation | Male | Female |
| Farming, Fishing & Forestry | 0 (0.0%) | 0 (0.0%) |
| Construction & Extraction | 14 (100.0%) | 0 (0.0%) |
| Installation, Maintenance & Repair | 7 (100.0%) | 0 (0.0%) |
| Total (Category) | 21 (100.0%) | 0 (0.0%) |
| Total (Overall) | 67 (59.3%) | 46 (40.7%) |
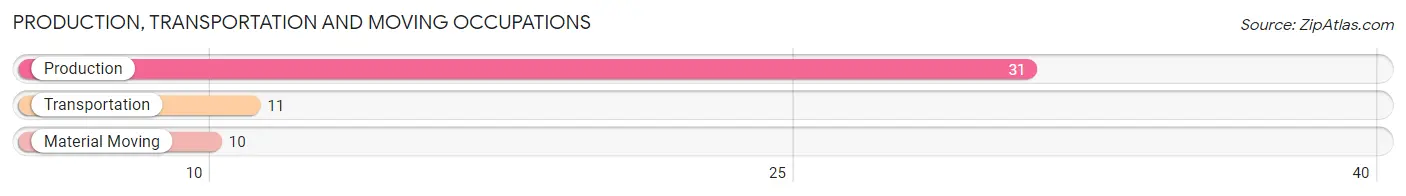
Production, Transportation and Moving Occupations
The most common Production, Transportation and Moving occupations in Walnut are Production (31 | 27.4%), Transportation (11 | 9.7%), and Material Moving (10 | 8.8%).
Production, Transportation and Moving Occupations by Sex
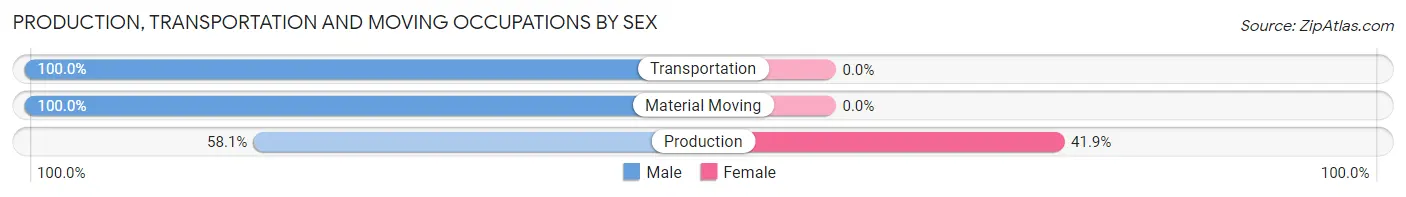
| Occupation | Male | Female |
| Production | 18 (58.1%) | 13 (41.9%) |
| Transportation | 11 (100.0%) | 0 (0.0%) |
| Material Moving | 10 (100.0%) | 0 (0.0%) |
| Total (Category) | 39 (75.0%) | 13 (25.0%) |
| Total (Overall) | 67 (59.3%) | 46 (40.7%) |
Employment Industries by Sex in Walnut
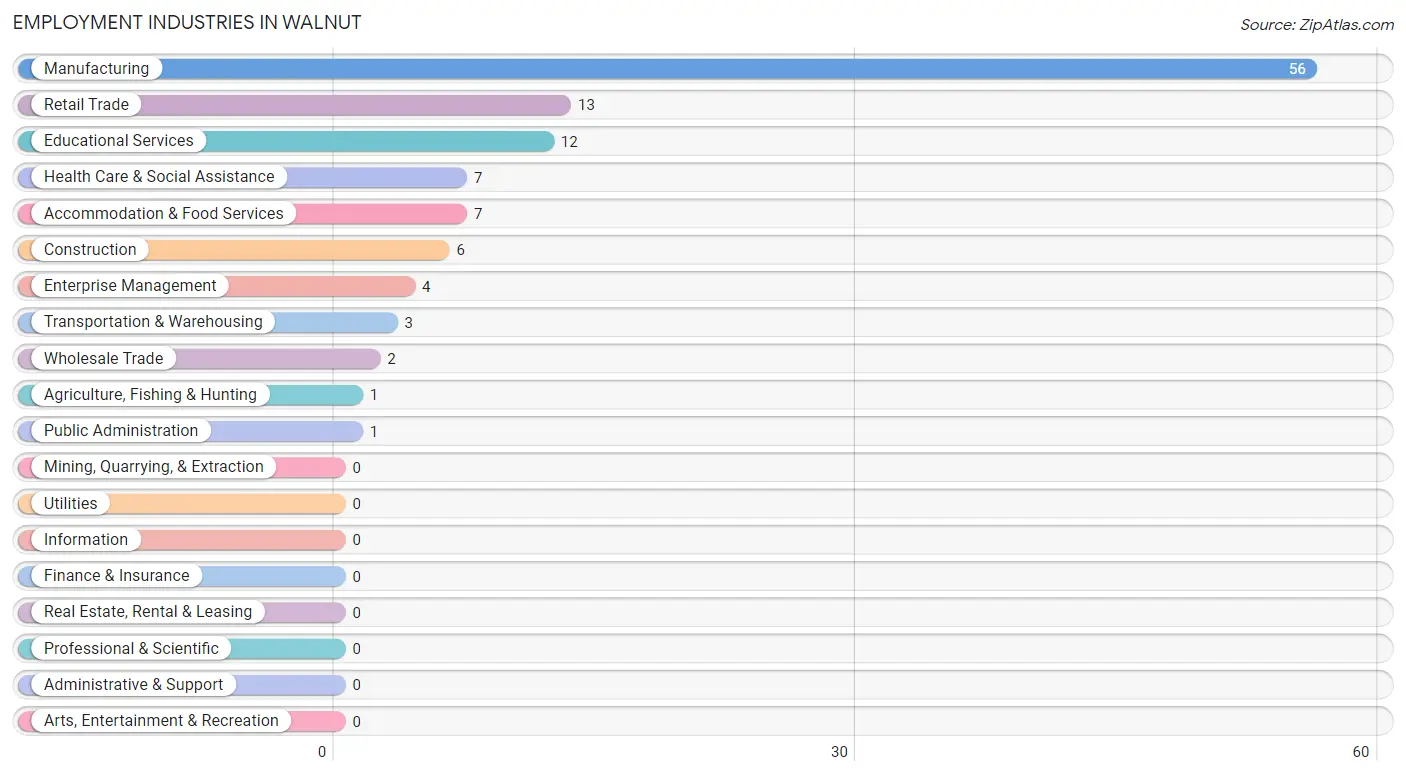
Employment Industries in Walnut
The major employment industries in Walnut include Manufacturing (56 | 49.6%), Retail Trade (13 | 11.5%), Educational Services (12 | 10.6%), Health Care & Social Assistance (7 | 6.2%), and Accommodation & Food Services (7 | 6.2%).
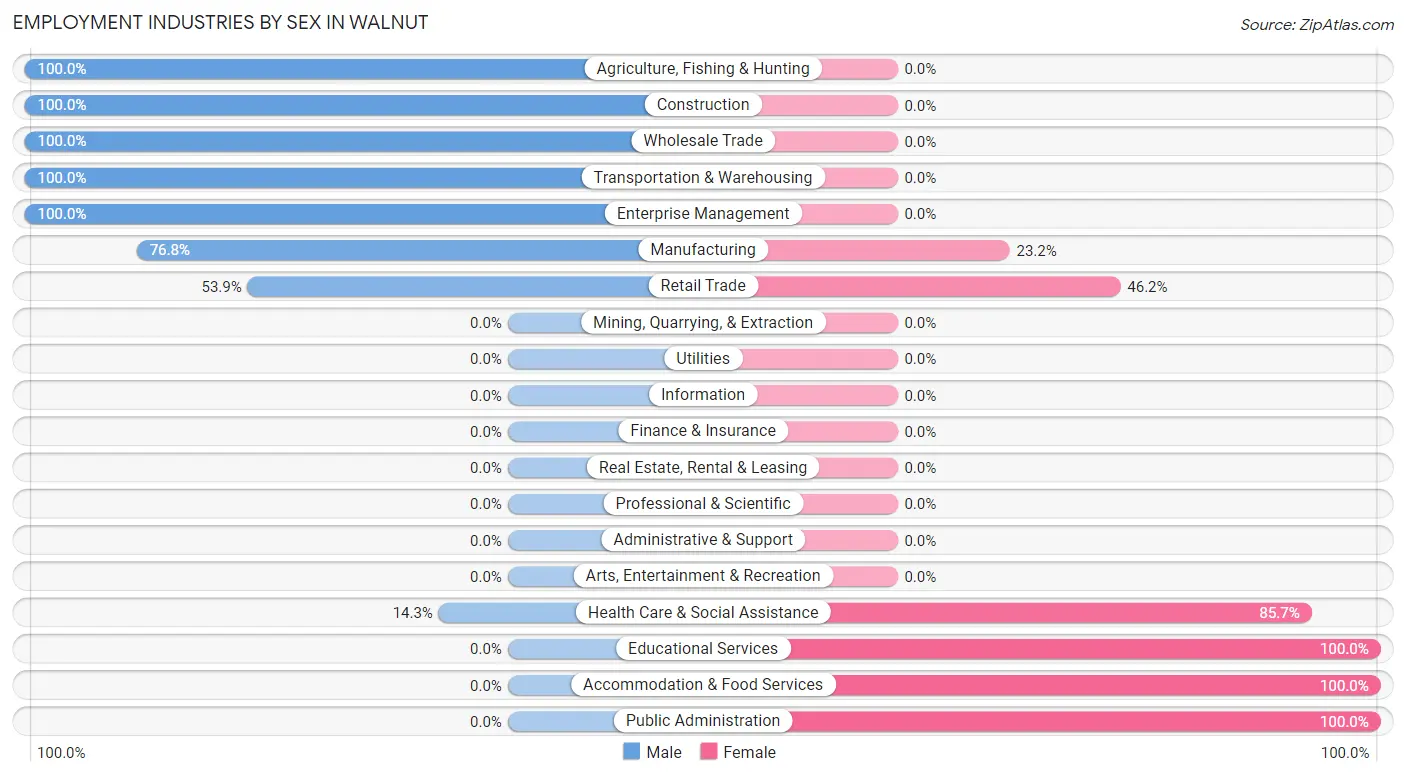
Employment Industries by Sex in Walnut
The Walnut industries that see more men than women are Agriculture, Fishing & Hunting (100.0%), Construction (100.0%), and Wholesale Trade (100.0%), whereas the industries that tend to have a higher number of women are Educational Services (100.0%), Accommodation & Food Services (100.0%), and Public Administration (100.0%).
| Industry | Male | Female |
| Agriculture, Fishing & Hunting | 1 (100.0%) | 0 (0.0%) |
| Mining, Quarrying, & Extraction | 0 (0.0%) | 0 (0.0%) |
| Construction | 6 (100.0%) | 0 (0.0%) |
| Manufacturing | 43 (76.8%) | 13 (23.2%) |
| Wholesale Trade | 2 (100.0%) | 0 (0.0%) |
| Retail Trade | 7 (53.8%) | 6 (46.2%) |
| Transportation & Warehousing | 3 (100.0%) | 0 (0.0%) |
| Utilities | 0 (0.0%) | 0 (0.0%) |
| Information | 0 (0.0%) | 0 (0.0%) |
| Finance & Insurance | 0 (0.0%) | 0 (0.0%) |
| Real Estate, Rental & Leasing | 0 (0.0%) | 0 (0.0%) |
| Professional & Scientific | 0 (0.0%) | 0 (0.0%) |
| Enterprise Management | 4 (100.0%) | 0 (0.0%) |
| Administrative & Support | 0 (0.0%) | 0 (0.0%) |
| Educational Services | 0 (0.0%) | 12 (100.0%) |
| Health Care & Social Assistance | 1 (14.3%) | 6 (85.7%) |
| Arts, Entertainment & Recreation | 0 (0.0%) | 0 (0.0%) |
| Accommodation & Food Services | 0 (0.0%) | 7 (100.0%) |
| Public Administration | 0 (0.0%) | 1 (100.0%) |
| Total | 67 (59.3%) | 46 (40.7%) |
Education in Walnut
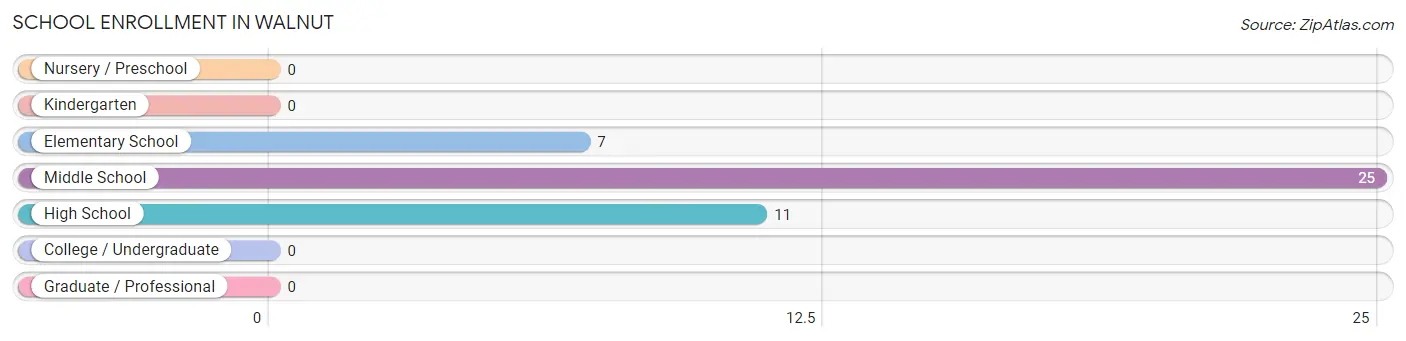
School Enrollment in Walnut
The most common levels of schooling among the 43 students in Walnut are middle school (25 | 58.1%), high school (11 | 25.6%), and elementary school (7 | 16.3%).
| School Level | # Students | % Students |
| Nursery / Preschool | 0 | 0.0% |
| Kindergarten | 0 | 0.0% |
| Elementary School | 7 | 16.3% |
| Middle School | 25 | 58.1% |
| High School | 11 | 25.6% |
| College / Undergraduate | 0 | 0.0% |
| Graduate / Professional | 0 | 0.0% |
| Total | 43 | 100.0% |
School Enrollment by Age by Funding Source in Walnut
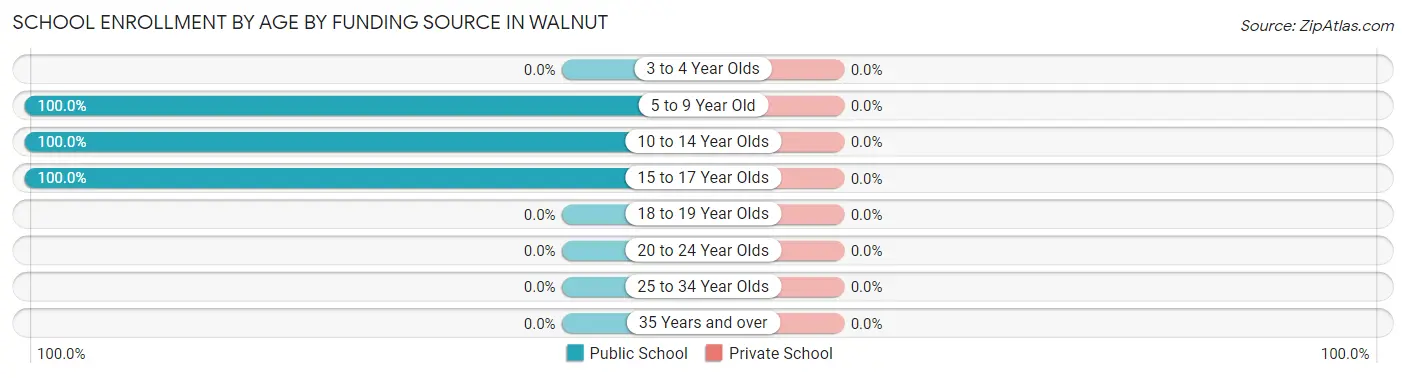
| Age Bracket | Public School | Private School |
| 3 to 4 Year Olds | 0 (0.0%) | 0 (0.0%) |
| 5 to 9 Year Old | 7 (100.0%) | 0 (0.0%) |
| 10 to 14 Year Olds | 25 (100.0%) | 0 (0.0%) |
| 15 to 17 Year Olds | 11 (100.0%) | 0 (0.0%) |
| 18 to 19 Year Olds | 0 (0.0%) | 0 (0.0%) |
| 20 to 24 Year Olds | 0 (0.0%) | 0 (0.0%) |
| 25 to 34 Year Olds | 0 (0.0%) | 0 (0.0%) |
| 35 Years and over | 0 (0.0%) | 0 (0.0%) |
| Total | 43 (100.0%) | 0 (0.0%) |
Educational Attainment by Field of Study in Walnut
Business (3 | 37.5%), psychology (2 | 25.0%), education (2 | 25.0%), and physical & health sciences (1 | 12.5%) are the most common fields of study among 8 individuals in Walnut who have obtained a bachelor's degree or higher.
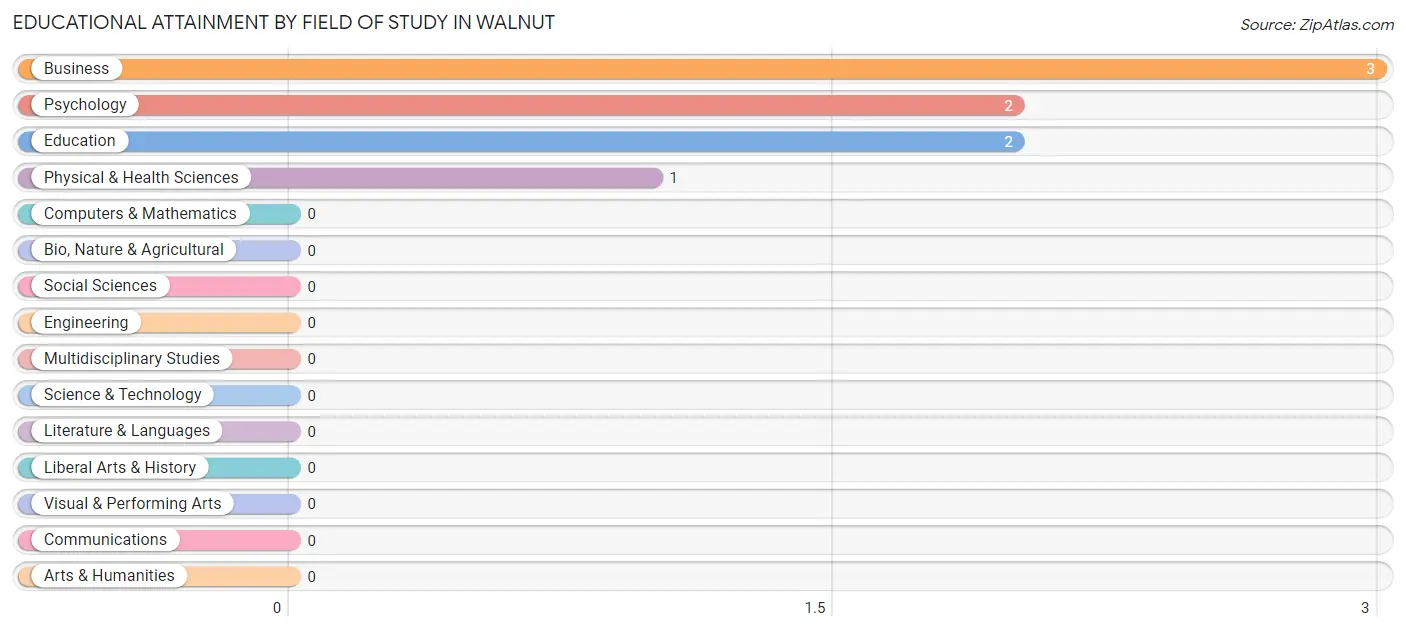
| Field of Study | # Graduates | % Graduates |
| Computers & Mathematics | 0 | 0.0% |
| Bio, Nature & Agricultural | 0 | 0.0% |
| Physical & Health Sciences | 1 | 12.5% |
| Psychology | 2 | 25.0% |
| Social Sciences | 0 | 0.0% |
| Engineering | 0 | 0.0% |
| Multidisciplinary Studies | 0 | 0.0% |
| Science & Technology | 0 | 0.0% |
| Business | 3 | 37.5% |
| Education | 2 | 25.0% |
| Literature & Languages | 0 | 0.0% |
| Liberal Arts & History | 0 | 0.0% |
| Visual & Performing Arts | 0 | 0.0% |
| Communications | 0 | 0.0% |
| Arts & Humanities | 0 | 0.0% |
| Total | 8 | 100.0% |
Transportation & Commute in Walnut
Vehicle Availability by Sex in Walnut
The most prevalent vehicle ownership categories in Walnut are males with 4 vehicles (27, accounting for 40.3%) and females with 4 vehicles (7, making up 58.7%).
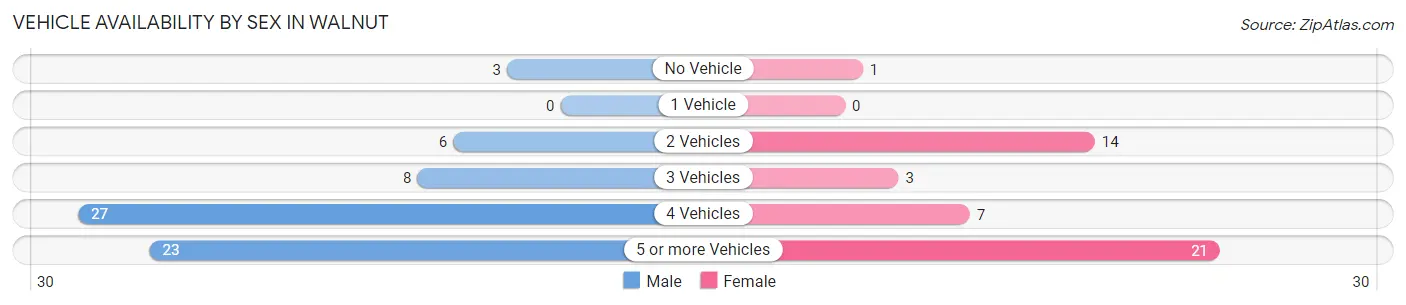
| Vehicles Available | Male | Female |
| No Vehicle | 3 (4.5%) | 1 (2.2%) |
| 1 Vehicle | 0 (0.0%) | 0 (0.0%) |
| 2 Vehicles | 6 (9.0%) | 14 (30.4%) |
| 3 Vehicles | 8 (11.9%) | 3 (6.5%) |
| 4 Vehicles | 27 (40.3%) | 7 (15.2%) |
| 5 or more Vehicles | 23 (34.3%) | 21 (45.7%) |
| Total | 67 (100.0%) | 46 (100.0%) |
Commute Time in Walnut
The most frequently occuring commute durations in Walnut are 30 to 34 minutes (44 commuters, 39.3%), 20 to 24 minutes (17 commuters, 15.2%), and 15 to 19 minutes (15 commuters, 13.4%).
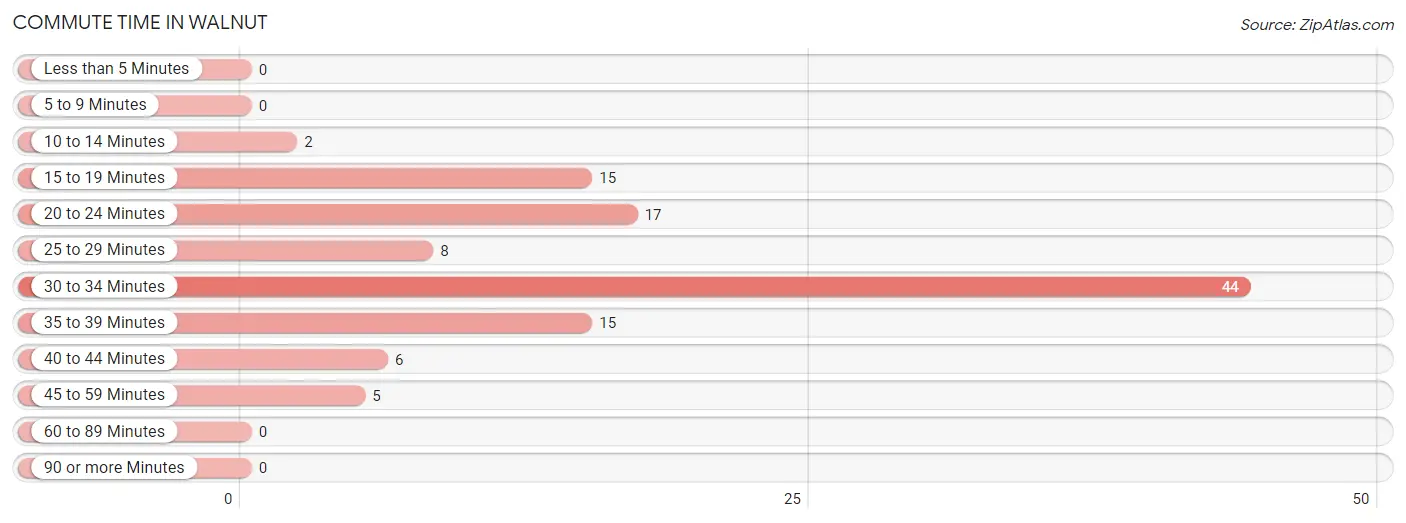
| Commute Time | # Commuters | % Commuters |
| Less than 5 Minutes | 0 | 0.0% |
| 5 to 9 Minutes | 0 | 0.0% |
| 10 to 14 Minutes | 2 | 1.8% |
| 15 to 19 Minutes | 15 | 13.4% |
| 20 to 24 Minutes | 17 | 15.2% |
| 25 to 29 Minutes | 8 | 7.1% |
| 30 to 34 Minutes | 44 | 39.3% |
| 35 to 39 Minutes | 15 | 13.4% |
| 40 to 44 Minutes | 6 | 5.4% |
| 45 to 59 Minutes | 5 | 4.5% |
| 60 to 89 Minutes | 0 | 0.0% |
| 90 or more Minutes | 0 | 0.0% |
Commute Time by Sex in Walnut
The most common commute times in Walnut are 30 to 34 minutes (37 commuters, 55.2%) for males and 35 to 39 minutes (14 commuters, 31.1%) for females.
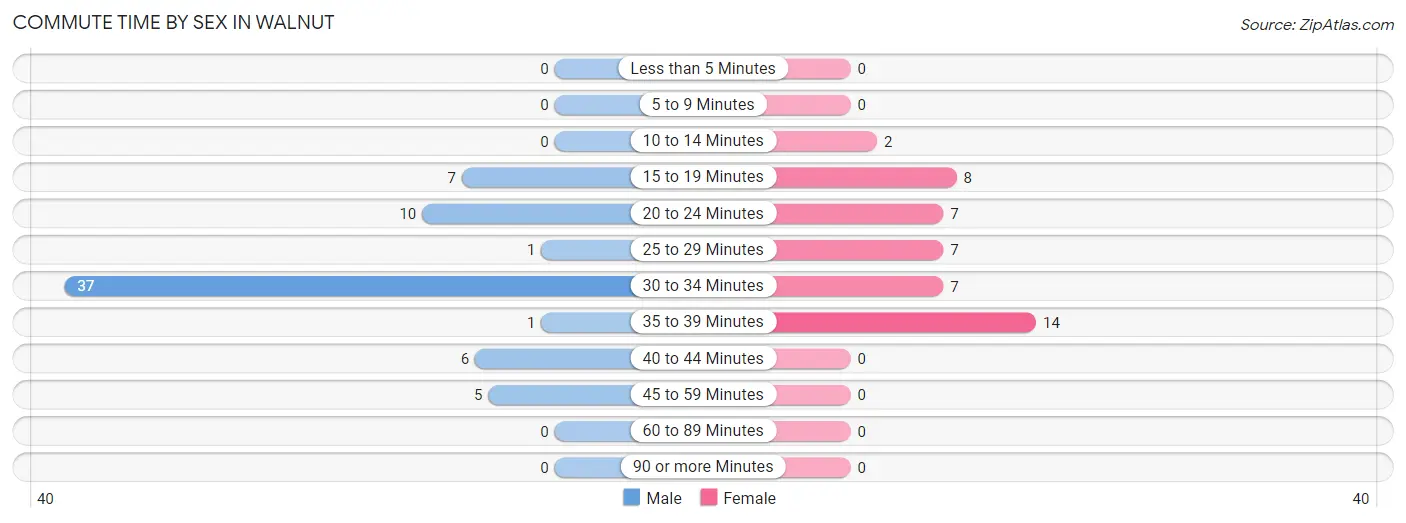
| Commute Time | Male | Female |
| Less than 5 Minutes | 0 (0.0%) | 0 (0.0%) |
| 5 to 9 Minutes | 0 (0.0%) | 0 (0.0%) |
| 10 to 14 Minutes | 0 (0.0%) | 2 (4.4%) |
| 15 to 19 Minutes | 7 (10.4%) | 8 (17.8%) |
| 20 to 24 Minutes | 10 (14.9%) | 7 (15.6%) |
| 25 to 29 Minutes | 1 (1.5%) | 7 (15.6%) |
| 30 to 34 Minutes | 37 (55.2%) | 7 (15.6%) |
| 35 to 39 Minutes | 1 (1.5%) | 14 (31.1%) |
| 40 to 44 Minutes | 6 (9.0%) | 0 (0.0%) |
| 45 to 59 Minutes | 5 (7.5%) | 0 (0.0%) |
| 60 to 89 Minutes | 0 (0.0%) | 0 (0.0%) |
| 90 or more Minutes | 0 (0.0%) | 0 (0.0%) |
Time of Departure to Work by Sex in Walnut
The most frequent times of departure to work in Walnut are 6:00 AM to 6:29 AM (36, 53.7%) for males and 7:30 AM to 7:59 AM (12, 26.7%) for females.
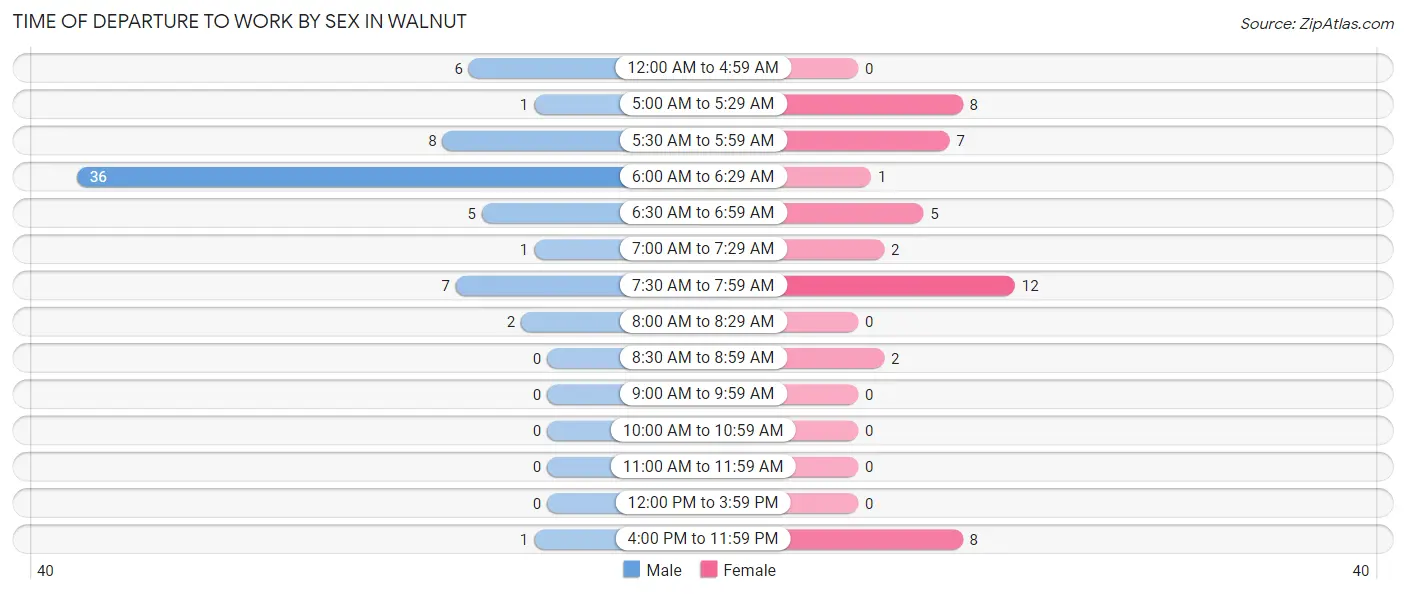
| Time of Departure | Male | Female |
| 12:00 AM to 4:59 AM | 6 (9.0%) | 0 (0.0%) |
| 5:00 AM to 5:29 AM | 1 (1.5%) | 8 (17.8%) |
| 5:30 AM to 5:59 AM | 8 (11.9%) | 7 (15.6%) |
| 6:00 AM to 6:29 AM | 36 (53.7%) | 1 (2.2%) |
| 6:30 AM to 6:59 AM | 5 (7.5%) | 5 (11.1%) |
| 7:00 AM to 7:29 AM | 1 (1.5%) | 2 (4.4%) |
| 7:30 AM to 7:59 AM | 7 (10.4%) | 12 (26.7%) |
| 8:00 AM to 8:29 AM | 2 (3.0%) | 0 (0.0%) |
| 8:30 AM to 8:59 AM | 0 (0.0%) | 2 (4.4%) |
| 9:00 AM to 9:59 AM | 0 (0.0%) | 0 (0.0%) |
| 10:00 AM to 10:59 AM | 0 (0.0%) | 0 (0.0%) |
| 11:00 AM to 11:59 AM | 0 (0.0%) | 0 (0.0%) |
| 12:00 PM to 3:59 PM | 0 (0.0%) | 0 (0.0%) |
| 4:00 PM to 11:59 PM | 1 (1.5%) | 8 (17.8%) |
| Total | 67 (100.0%) | 45 (100.0%) |
Housing Occupancy in Walnut
Occupancy by Ownership in Walnut
Of the total 71 dwellings in Walnut, owner-occupied units account for 68 (95.8%), while renter-occupied units make up 3 (4.2%).
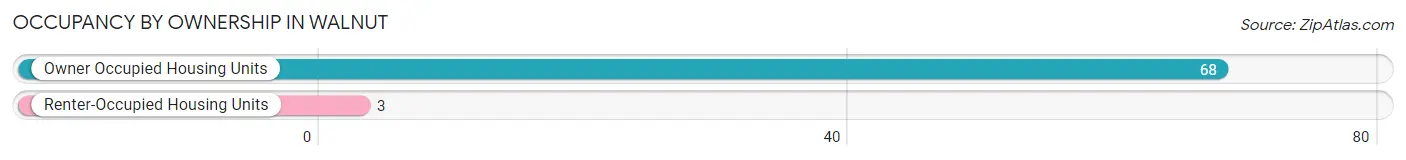
| Occupancy | # Housing Units | % Housing Units |
| Owner Occupied Housing Units | 68 | 95.8% |
| Renter-Occupied Housing Units | 3 | 4.2% |
| Total Occupied Housing Units | 71 | 100.0% |
Occupancy by Household Size in Walnut
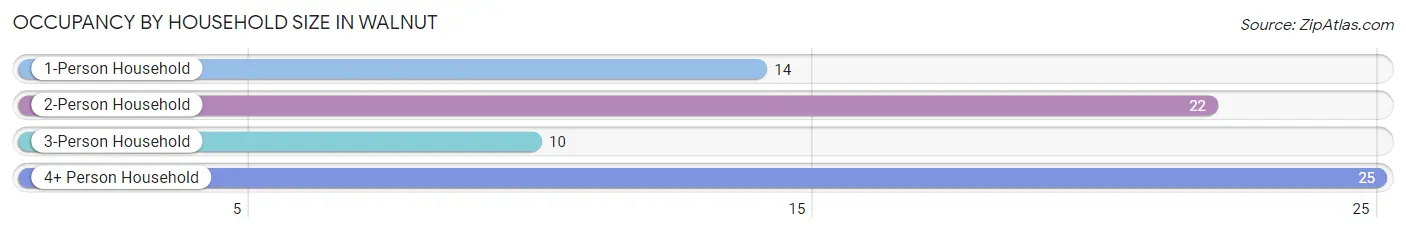
| Household Size | # Housing Units | % Housing Units |
| 1-Person Household | 14 | 19.7% |
| 2-Person Household | 22 | 31.0% |
| 3-Person Household | 10 | 14.1% |
| 4+ Person Household | 25 | 35.2% |
| Total Housing Units | 71 | 100.0% |
Occupancy by Ownership by Household Size in Walnut
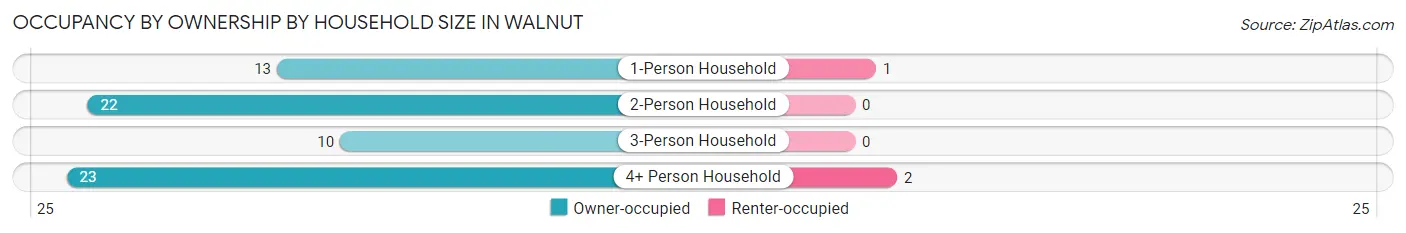
| Household Size | Owner-occupied | Renter-occupied |
| 1-Person Household | 13 (92.9%) | 1 (7.1%) |
| 2-Person Household | 22 (100.0%) | 0 (0.0%) |
| 3-Person Household | 10 (100.0%) | 0 (0.0%) |
| 4+ Person Household | 23 (92.0%) | 2 (8.0%) |
| Total Housing Units | 68 (95.8%) | 3 (4.2%) |
Occupancy by Educational Attainment in Walnut
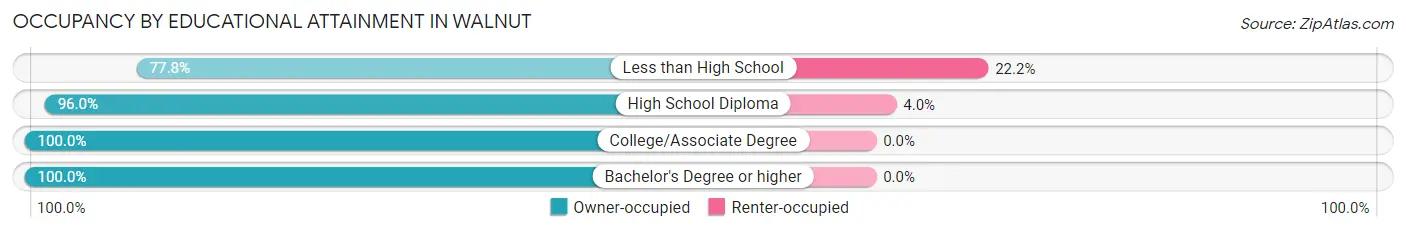
| Household Size | Owner-occupied | Renter-occupied |
| Less than High School | 7 (77.8%) | 2 (22.2%) |
| High School Diploma | 24 (96.0%) | 1 (4.0%) |
| College/Associate Degree | 34 (100.0%) | 0 (0.0%) |
| Bachelor's Degree or higher | 3 (100.0%) | 0 (0.0%) |
Occupancy by Age of Householder in Walnut
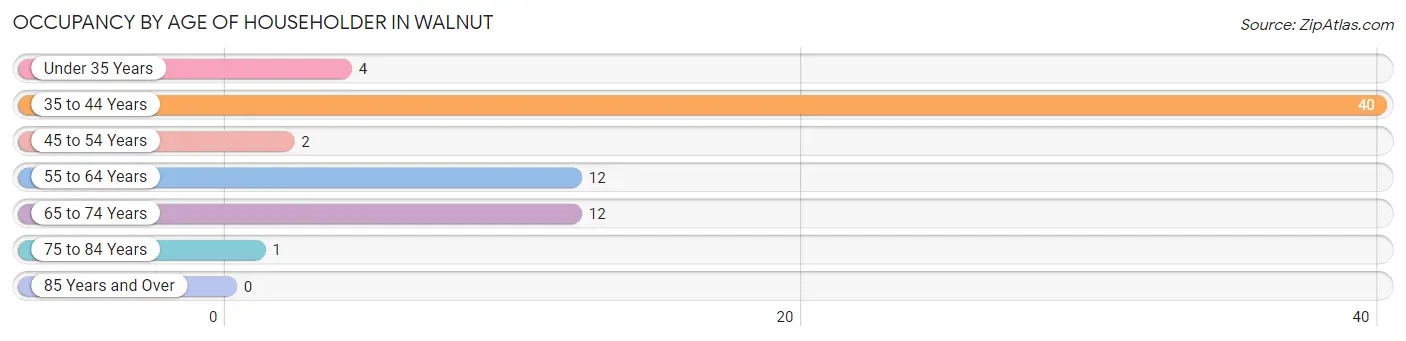
| Age Bracket | # Households | % Households |
| Under 35 Years | 4 | 5.6% |
| 35 to 44 Years | 40 | 56.3% |
| 45 to 54 Years | 2 | 2.8% |
| 55 to 64 Years | 12 | 16.9% |
| 65 to 74 Years | 12 | 16.9% |
| 75 to 84 Years | 1 | 1.4% |
| 85 Years and Over | 0 | 0.0% |
| Total | 71 | 100.0% |
Housing Finances in Walnut
Median Income by Occupancy in Walnut
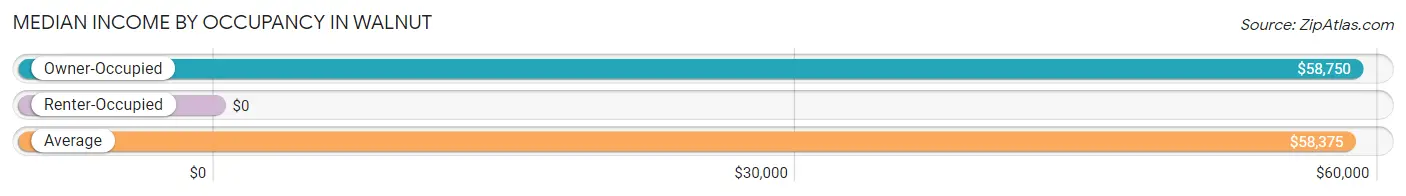
| Occupancy Type | # Households | Median Income |
| Owner-Occupied | 68 (95.8%) | $58,750 |
| Renter-Occupied | 3 (4.2%) | $0 |
| Average | 71 (100.0%) | $58,375 |
Occupancy by Householder Income Bracket in Walnut
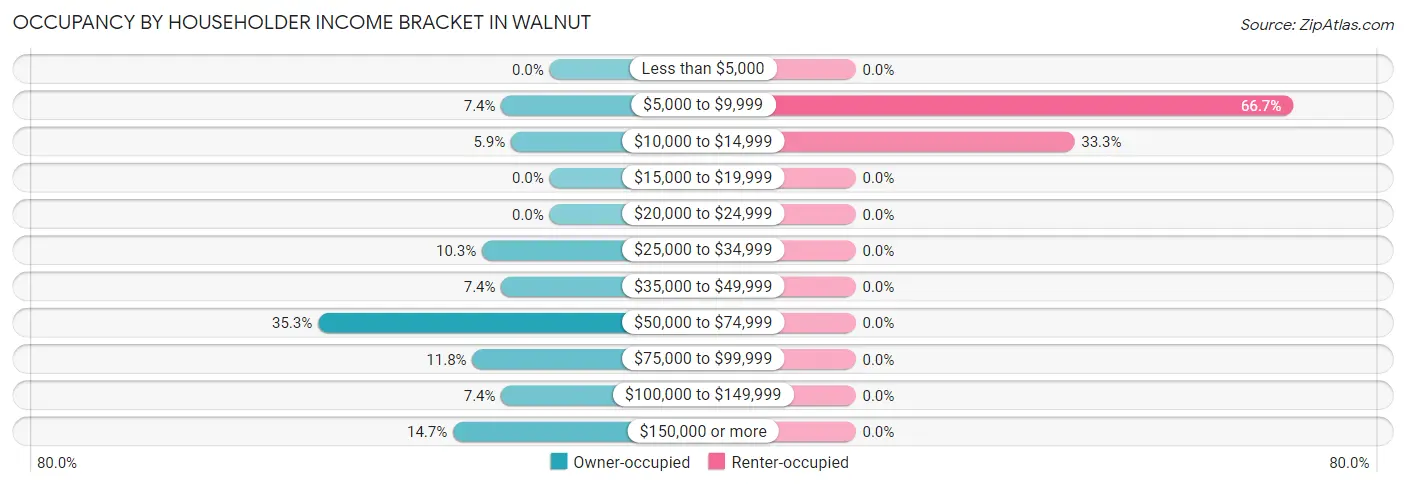
| Income Bracket | Owner-occupied | Renter-occupied |
| Less than $5,000 | 0 (0.0%) | 0 (0.0%) |
| $5,000 to $9,999 | 5 (7.3%) | 2 (66.7%) |
| $10,000 to $14,999 | 4 (5.9%) | 1 (33.3%) |
| $15,000 to $19,999 | 0 (0.0%) | 0 (0.0%) |
| $20,000 to $24,999 | 0 (0.0%) | 0 (0.0%) |
| $25,000 to $34,999 | 7 (10.3%) | 0 (0.0%) |
| $35,000 to $49,999 | 5 (7.3%) | 0 (0.0%) |
| $50,000 to $74,999 | 24 (35.3%) | 0 (0.0%) |
| $75,000 to $99,999 | 8 (11.8%) | 0 (0.0%) |
| $100,000 to $149,999 | 5 (7.3%) | 0 (0.0%) |
| $150,000 or more | 10 (14.7%) | 0 (0.0%) |
| Total | 68 (100.0%) | 3 (100.0%) |
Monthly Housing Cost Tiers in Walnut
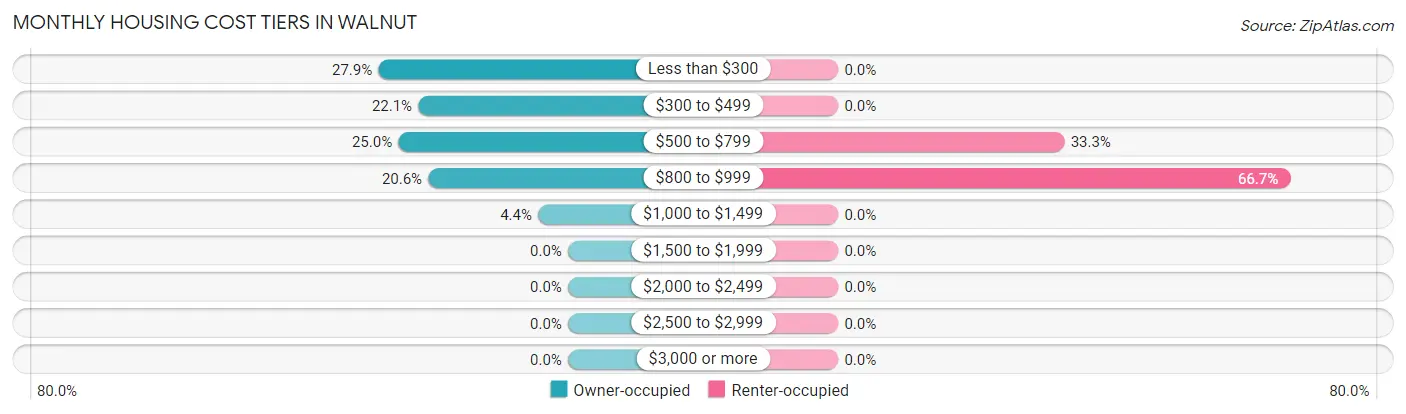
| Monthly Cost | Owner-occupied | Renter-occupied |
| Less than $300 | 19 (27.9%) | 0 (0.0%) |
| $300 to $499 | 15 (22.1%) | 0 (0.0%) |
| $500 to $799 | 17 (25.0%) | 1 (33.3%) |
| $800 to $999 | 14 (20.6%) | 2 (66.7%) |
| $1,000 to $1,499 | 3 (4.4%) | 0 (0.0%) |
| $1,500 to $1,999 | 0 (0.0%) | 0 (0.0%) |
| $2,000 to $2,499 | 0 (0.0%) | 0 (0.0%) |
| $2,500 to $2,999 | 0 (0.0%) | 0 (0.0%) |
| $3,000 or more | 0 (0.0%) | 0 (0.0%) |
| Total | 68 (100.0%) | 3 (100.0%) |
Physical Housing Characteristics in Walnut
Housing Structures in Walnut
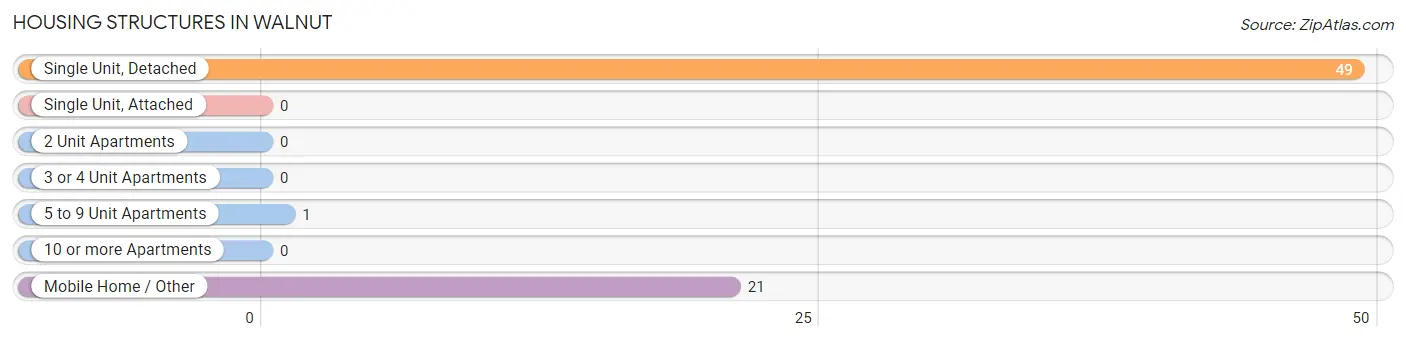
| Structure Type | # Housing Units | % Housing Units |
| Single Unit, Detached | 49 | 69.0% |
| Single Unit, Attached | 0 | 0.0% |
| 2 Unit Apartments | 0 | 0.0% |
| 3 or 4 Unit Apartments | 0 | 0.0% |
| 5 to 9 Unit Apartments | 1 | 1.4% |
| 10 or more Apartments | 0 | 0.0% |
| Mobile Home / Other | 21 | 29.6% |
| Total | 71 | 100.0% |
Housing Structures by Occupancy in Walnut
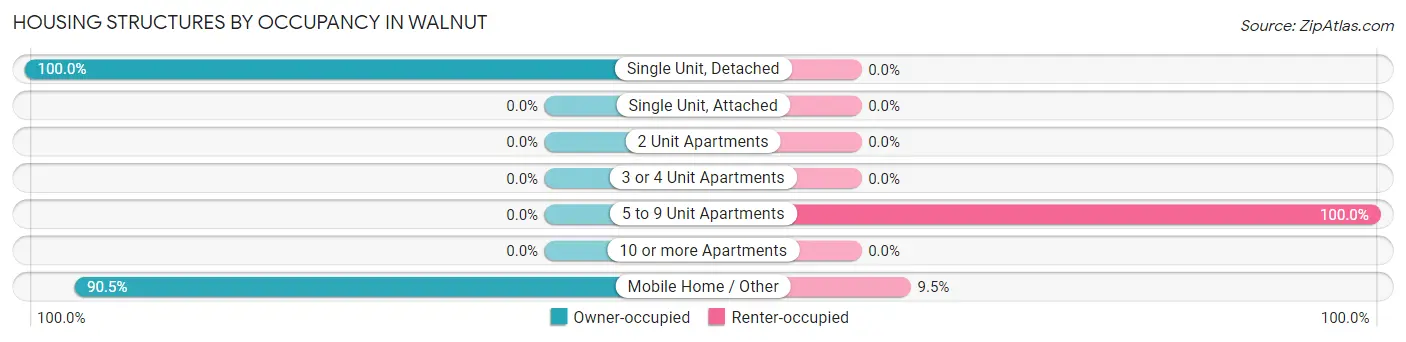
| Structure Type | Owner-occupied | Renter-occupied |
| Single Unit, Detached | 49 (100.0%) | 0 (0.0%) |
| Single Unit, Attached | 0 (0.0%) | 0 (0.0%) |
| 2 Unit Apartments | 0 (0.0%) | 0 (0.0%) |
| 3 or 4 Unit Apartments | 0 (0.0%) | 0 (0.0%) |
| 5 to 9 Unit Apartments | 0 (0.0%) | 1 (100.0%) |
| 10 or more Apartments | 0 (0.0%) | 0 (0.0%) |
| Mobile Home / Other | 19 (90.5%) | 2 (9.5%) |
| Total | 68 (95.8%) | 3 (4.2%) |
Housing Structures by Number of Rooms in Walnut
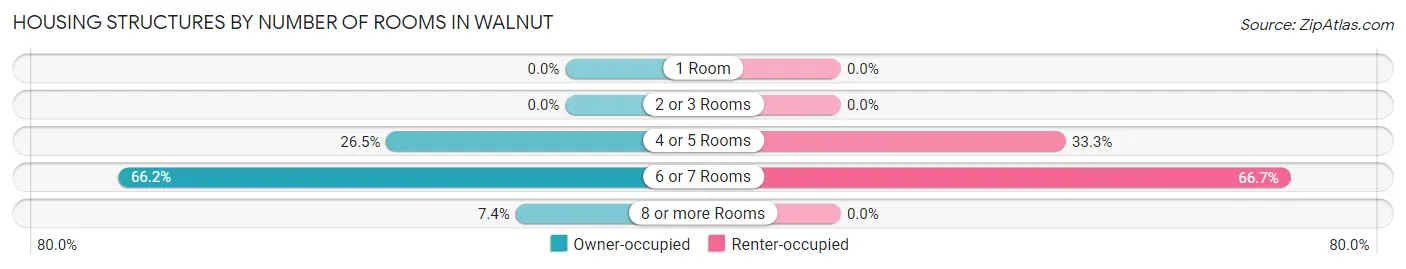
| Number of Rooms | Owner-occupied | Renter-occupied |
| 1 Room | 0 (0.0%) | 0 (0.0%) |
| 2 or 3 Rooms | 0 (0.0%) | 0 (0.0%) |
| 4 or 5 Rooms | 18 (26.5%) | 1 (33.3%) |
| 6 or 7 Rooms | 45 (66.2%) | 2 (66.7%) |
| 8 or more Rooms | 5 (7.3%) | 0 (0.0%) |
| Total | 68 (100.0%) | 3 (100.0%) |
Housing Structure by Heating Type in Walnut
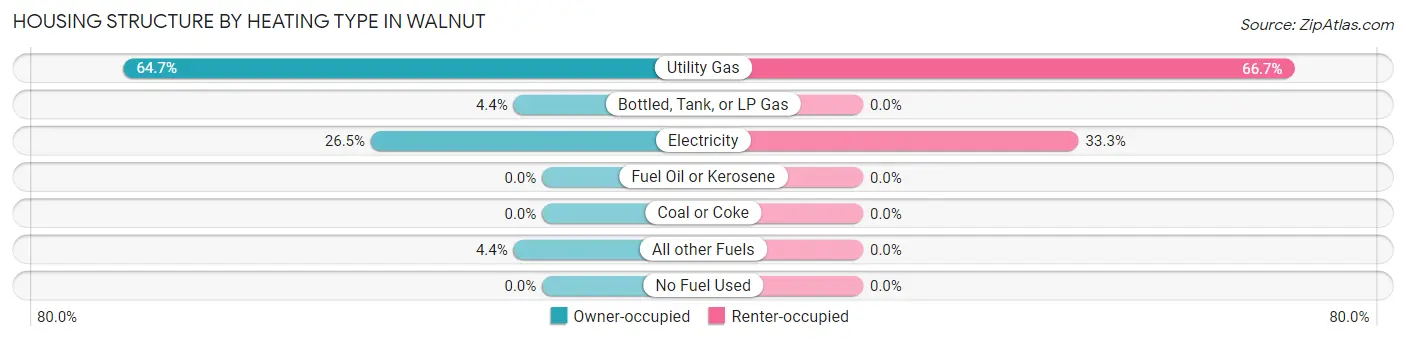
| Heating Type | Owner-occupied | Renter-occupied |
| Utility Gas | 44 (64.7%) | 2 (66.7%) |
| Bottled, Tank, or LP Gas | 3 (4.4%) | 0 (0.0%) |
| Electricity | 18 (26.5%) | 1 (33.3%) |
| Fuel Oil or Kerosene | 0 (0.0%) | 0 (0.0%) |
| Coal or Coke | 0 (0.0%) | 0 (0.0%) |
| All other Fuels | 3 (4.4%) | 0 (0.0%) |
| No Fuel Used | 0 (0.0%) | 0 (0.0%) |
| Total | 68 (100.0%) | 3 (100.0%) |
Household Vehicle Usage in Walnut
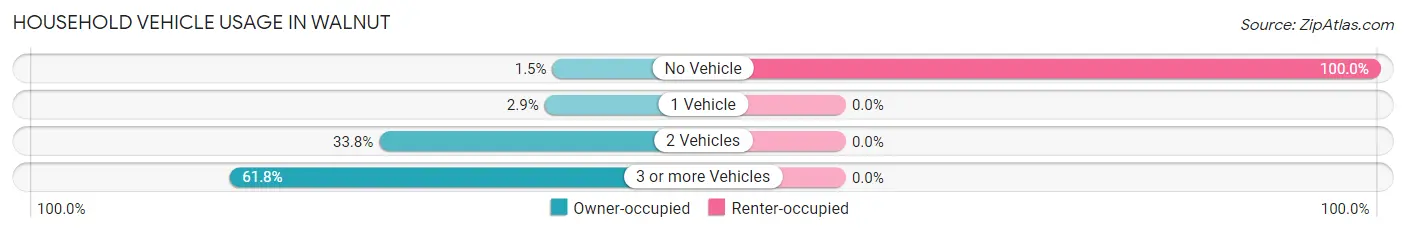
| Vehicles per Household | Owner-occupied | Renter-occupied |
| No Vehicle | 1 (1.5%) | 3 (100.0%) |
| 1 Vehicle | 2 (2.9%) | 0 (0.0%) |
| 2 Vehicles | 23 (33.8%) | 0 (0.0%) |
| 3 or more Vehicles | 42 (61.8%) | 0 (0.0%) |
| Total | 68 (100.0%) | 3 (100.0%) |
Real Estate & Mortgages in Walnut
Real Estate and Mortgage Overview in Walnut
| Characteristic | Without Mortgage | With Mortgage |
| Housing Units | 39 | 29 |
| Median Property Value | $9,999 | $28,000 |
| Median Household Income | $59,792 | $1 |
| Monthly Housing Costs | $306 | $0 |
| Real Estate Taxes | $199 | $0 |
Property Value by Mortgage Status in Walnut
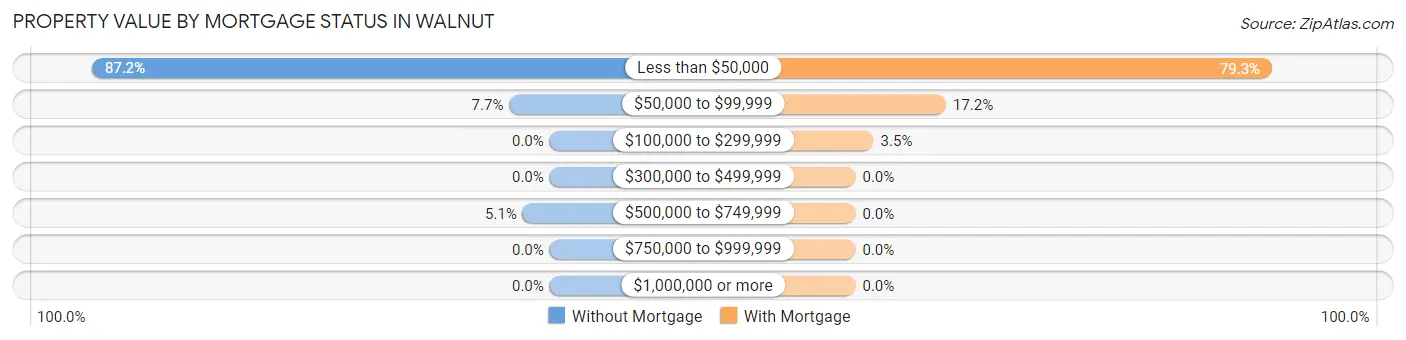
| Property Value | Without Mortgage | With Mortgage |
| Less than $50,000 | 34 (87.2%) | 23 (79.3%) |
| $50,000 to $99,999 | 3 (7.7%) | 5 (17.2%) |
| $100,000 to $299,999 | 0 (0.0%) | 1 (3.5%) |
| $300,000 to $499,999 | 0 (0.0%) | 0 (0.0%) |
| $500,000 to $749,999 | 2 (5.1%) | 0 (0.0%) |
| $750,000 to $999,999 | 0 (0.0%) | 0 (0.0%) |
| $1,000,000 or more | 0 (0.0%) | 0 (0.0%) |
| Total | 39 (100.0%) | 29 (100.0%) |
Household Income by Mortgage Status in Walnut
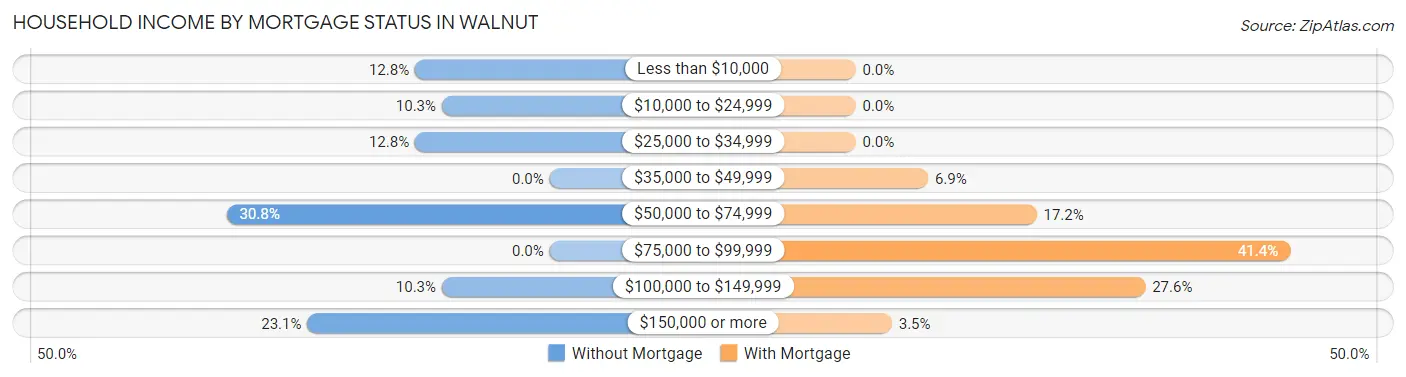
| Household Income | Without Mortgage | With Mortgage |
| Less than $10,000 | 5 (12.8%) | 0 (0.0%) |
| $10,000 to $24,999 | 4 (10.3%) | 0 (0.0%) |
| $25,000 to $34,999 | 5 (12.8%) | 0 (0.0%) |
| $35,000 to $49,999 | 0 (0.0%) | 2 (6.9%) |
| $50,000 to $74,999 | 12 (30.8%) | 5 (17.2%) |
| $75,000 to $99,999 | 0 (0.0%) | 12 (41.4%) |
| $100,000 to $149,999 | 4 (10.3%) | 8 (27.6%) |
| $150,000 or more | 9 (23.1%) | 1 (3.5%) |
| Total | 39 (100.0%) | 29 (100.0%) |
Property Value to Household Income Ratio in Walnut
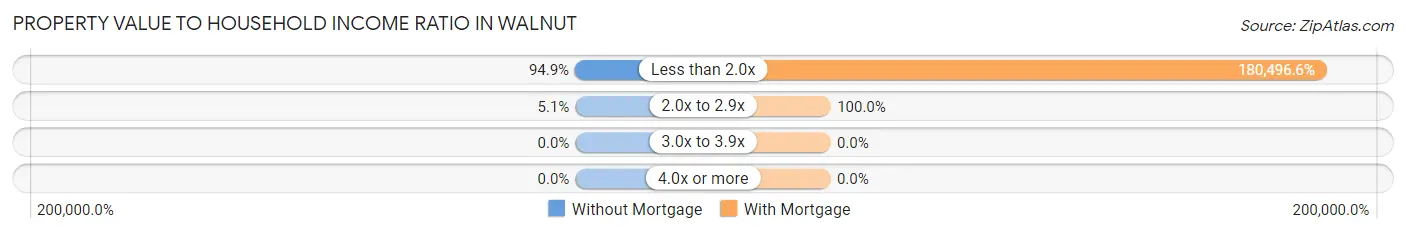
| Value-to-Income Ratio | Without Mortgage | With Mortgage |
| Less than 2.0x | 37 (94.9%) | 52,344 (180,496.6%) |
| 2.0x to 2.9x | 2 (5.1%) | 29 (100.0%) |
| 3.0x to 3.9x | 0 (0.0%) | 0 (0.0%) |
| 4.0x or more | 0 (0.0%) | 0 (0.0%) |
| Total | 39 (100.0%) | 29 (100.0%) |
Real Estate Taxes by Mortgage Status in Walnut
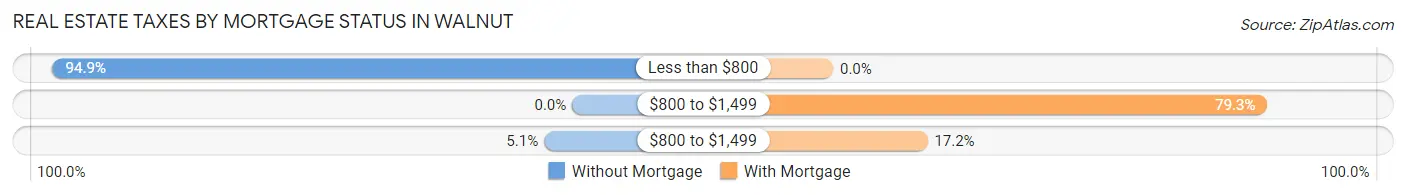
| Property Taxes | Without Mortgage | With Mortgage |
| Less than $800 | 37 (94.9%) | 0 (0.0%) |
| $800 to $1,499 | 0 (0.0%) | 23 (79.3%) |
| $800 to $1,499 | 2 (5.1%) | 5 (17.2%) |
| Total | 39 (100.0%) | 29 (100.0%) |
Health & Disability in Walnut
Health Insurance Coverage by Age in Walnut
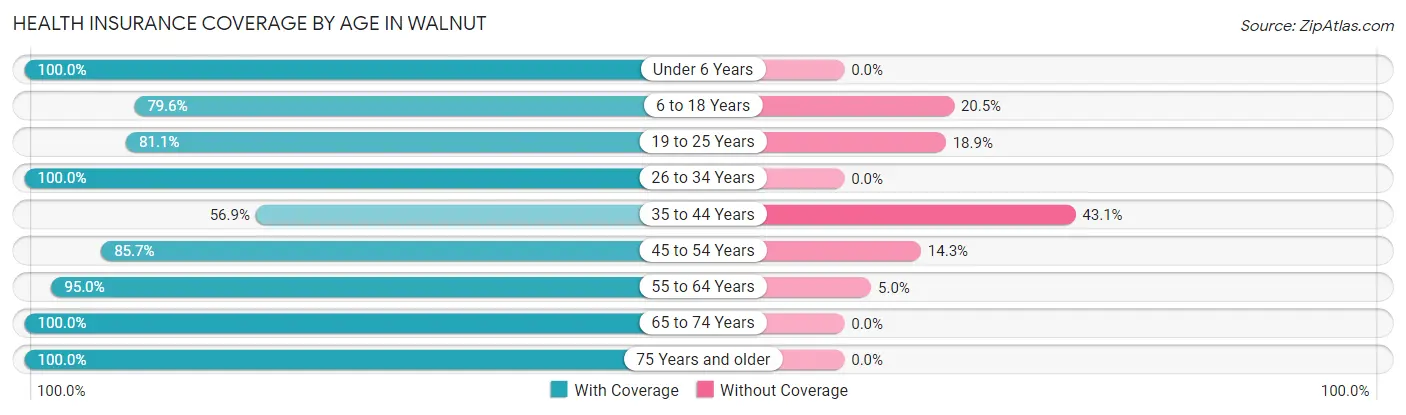
| Age Bracket | With Coverage | Without Coverage |
| Under 6 Years | 3 (100.0%) | 0 (0.0%) |
| 6 to 18 Years | 35 (79.5%) | 9 (20.4%) |
| 19 to 25 Years | 30 (81.1%) | 7 (18.9%) |
| 26 to 34 Years | 5 (100.0%) | 0 (0.0%) |
| 35 to 44 Years | 33 (56.9%) | 25 (43.1%) |
| 45 to 54 Years | 12 (85.7%) | 2 (14.3%) |
| 55 to 64 Years | 19 (95.0%) | 1 (5.0%) |
| 65 to 74 Years | 17 (100.0%) | 0 (0.0%) |
| 75 Years and older | 3 (100.0%) | 0 (0.0%) |
| Total | 157 (78.1%) | 44 (21.9%) |
Health Insurance Coverage by Citizenship Status in Walnut
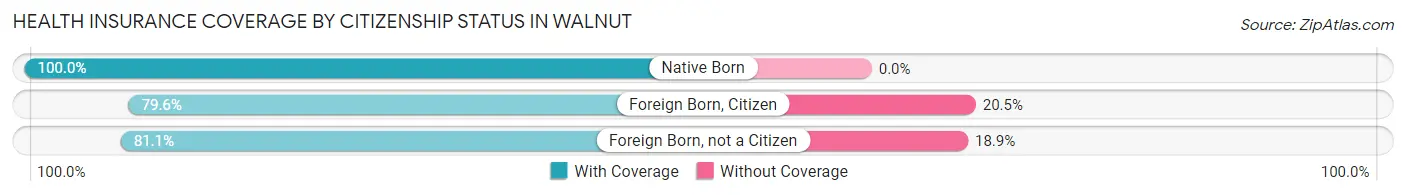
| Citizenship Status | With Coverage | Without Coverage |
| Native Born | 3 (100.0%) | 0 (0.0%) |
| Foreign Born, Citizen | 35 (79.5%) | 9 (20.4%) |
| Foreign Born, not a Citizen | 30 (81.1%) | 7 (18.9%) |
Health Insurance Coverage by Household Income in Walnut
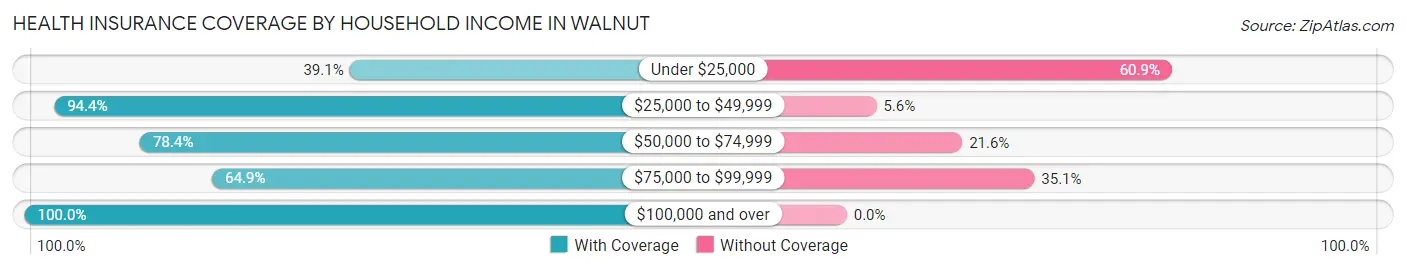
| Household Income | With Coverage | Without Coverage |
| Under $25,000 | 9 (39.1%) | 14 (60.9%) |
| $25,000 to $49,999 | 17 (94.4%) | 1 (5.6%) |
| $50,000 to $74,999 | 58 (78.4%) | 16 (21.6%) |
| $75,000 to $99,999 | 24 (64.9%) | 13 (35.1%) |
| $100,000 and over | 49 (100.0%) | 0 (0.0%) |
Public vs Private Health Insurance Coverage by Age in Walnut
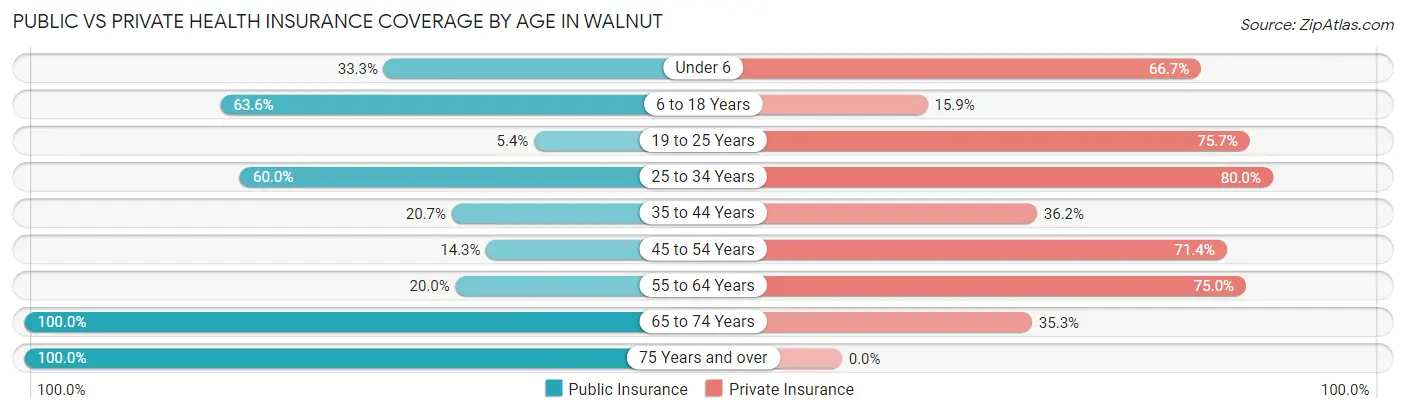
| Age Bracket | Public Insurance | Private Insurance |
| Under 6 | 1 (33.3%) | 2 (66.7%) |
| 6 to 18 Years | 28 (63.6%) | 7 (15.9%) |
| 19 to 25 Years | 2 (5.4%) | 28 (75.7%) |
| 25 to 34 Years | 3 (60.0%) | 4 (80.0%) |
| 35 to 44 Years | 12 (20.7%) | 21 (36.2%) |
| 45 to 54 Years | 2 (14.3%) | 10 (71.4%) |
| 55 to 64 Years | 4 (20.0%) | 15 (75.0%) |
| 65 to 74 Years | 17 (100.0%) | 6 (35.3%) |
| 75 Years and over | 3 (100.0%) | 0 (0.0%) |
| Total | 72 (35.8%) | 93 (46.3%) |
Disability Status by Sex by Age in Walnut
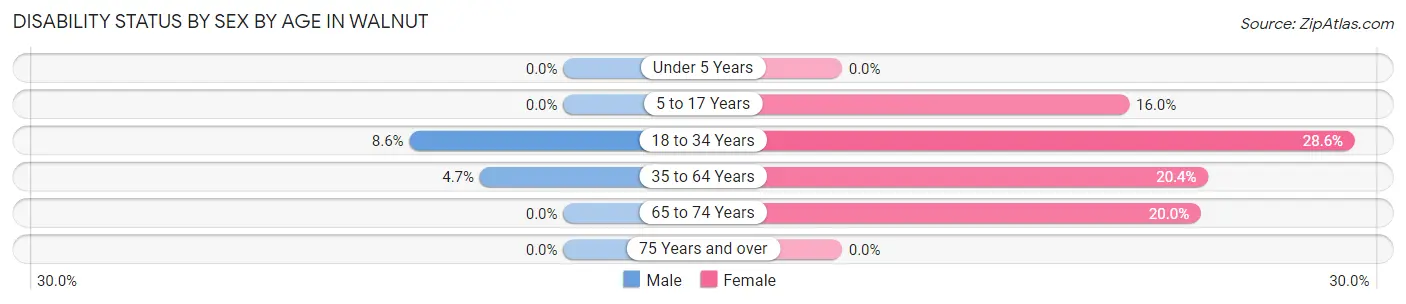
| Age Bracket | Male | Female |
| Under 5 Years | 0 (0.0%) | 0 (0.0%) |
| 5 to 17 Years | 0 (0.0%) | 4 (16.0%) |
| 18 to 34 Years | 3 (8.6%) | 2 (28.6%) |
| 35 to 64 Years | 2 (4.6%) | 10 (20.4%) |
| 65 to 74 Years | 0 (0.0%) | 1 (20.0%) |
| 75 Years and over | 0 (0.0%) | 0 (0.0%) |
Disability Class by Sex by Age in Walnut
Disability Class: Hearing Difficulty
| Age Bracket | Male | Female |
| Under 5 Years | 0 (0.0%) | 0 (0.0%) |
| 5 to 17 Years | 0 (0.0%) | 0 (0.0%) |
| 18 to 34 Years | 0 (0.0%) | 0 (0.0%) |
| 35 to 64 Years | 0 (0.0%) | 0 (0.0%) |
| 65 to 74 Years | 0 (0.0%) | 0 (0.0%) |
| 75 Years and over | 0 (0.0%) | 0 (0.0%) |
Disability Class: Vision Difficulty
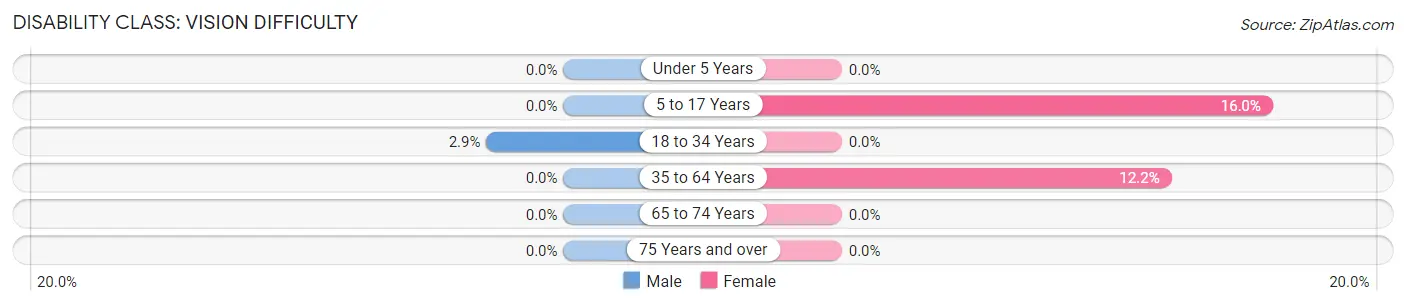
| Age Bracket | Male | Female |
| Under 5 Years | 0 (0.0%) | 0 (0.0%) |
| 5 to 17 Years | 0 (0.0%) | 4 (16.0%) |
| 18 to 34 Years | 1 (2.9%) | 0 (0.0%) |
| 35 to 64 Years | 0 (0.0%) | 6 (12.2%) |
| 65 to 74 Years | 0 (0.0%) | 0 (0.0%) |
| 75 Years and over | 0 (0.0%) | 0 (0.0%) |
Disability Class: Cognitive Difficulty
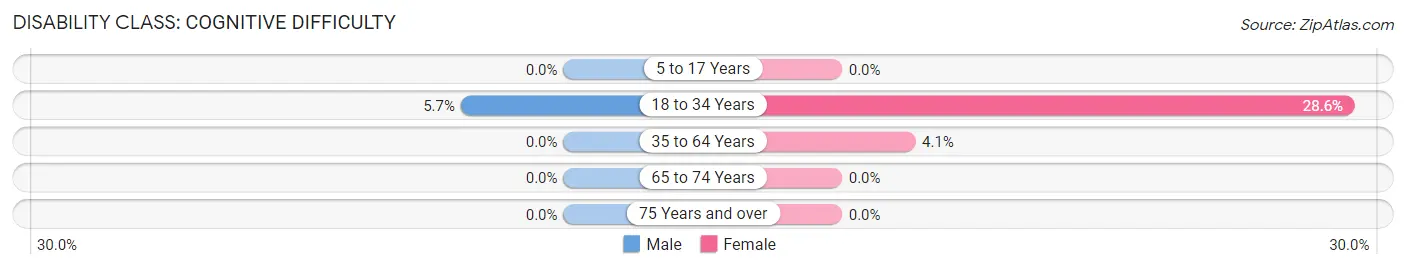
| Age Bracket | Male | Female |
| 5 to 17 Years | 0 (0.0%) | 0 (0.0%) |
| 18 to 34 Years | 2 (5.7%) | 2 (28.6%) |
| 35 to 64 Years | 0 (0.0%) | 2 (4.1%) |
| 65 to 74 Years | 0 (0.0%) | 0 (0.0%) |
| 75 Years and over | 0 (0.0%) | 0 (0.0%) |
Disability Class: Ambulatory Difficulty
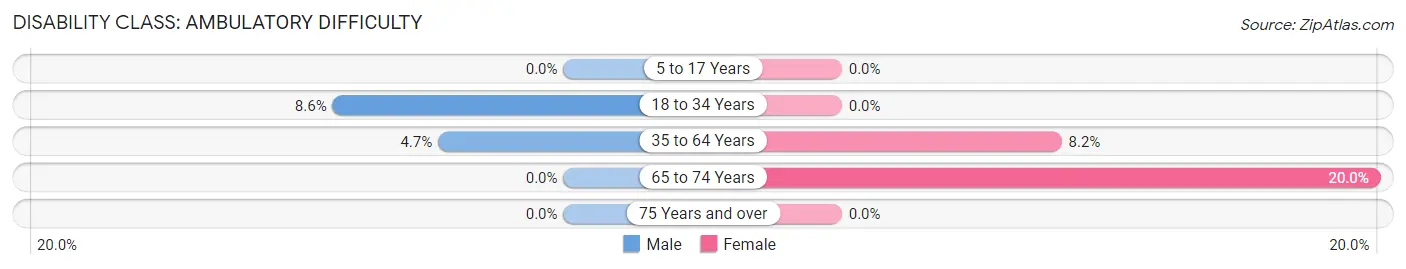
| Age Bracket | Male | Female |
| 5 to 17 Years | 0 (0.0%) | 0 (0.0%) |
| 18 to 34 Years | 3 (8.6%) | 0 (0.0%) |
| 35 to 64 Years | 2 (4.6%) | 4 (8.2%) |
| 65 to 74 Years | 0 (0.0%) | 1 (20.0%) |
| 75 Years and over | 0 (0.0%) | 0 (0.0%) |
Disability Class: Self-Care Difficulty
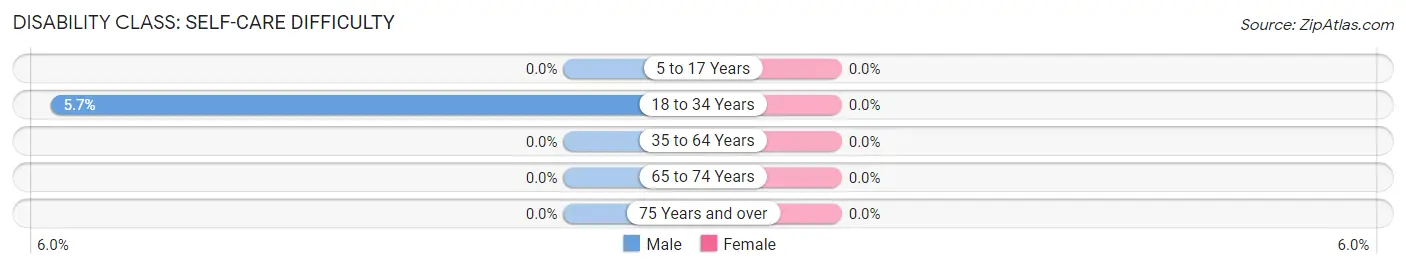
| Age Bracket | Male | Female |
| 5 to 17 Years | 0 (0.0%) | 0 (0.0%) |
| 18 to 34 Years | 2 (5.7%) | 0 (0.0%) |
| 35 to 64 Years | 0 (0.0%) | 0 (0.0%) |
| 65 to 74 Years | 0 (0.0%) | 0 (0.0%) |
| 75 Years and over | 0 (0.0%) | 0 (0.0%) |
Technology Access in Walnut
Computing Device Access in Walnut
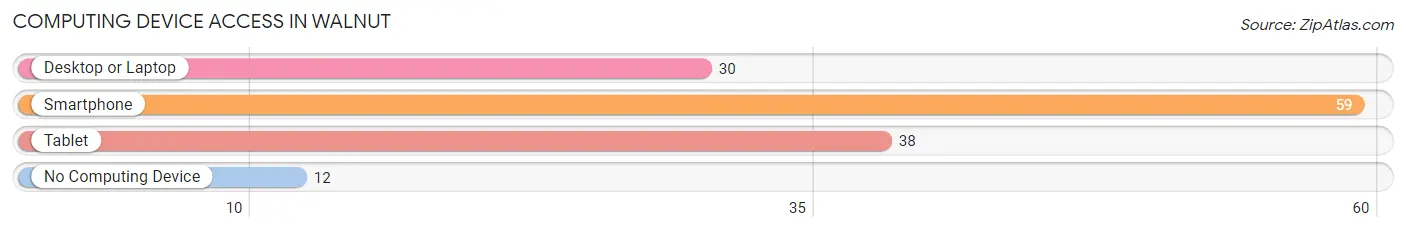
| Device Type | # Households | % Households |
| Desktop or Laptop | 30 | 42.2% |
| Smartphone | 59 | 83.1% |
| Tablet | 38 | 53.5% |
| No Computing Device | 12 | 16.9% |
| Total | 71 | 100.0% |
Internet Access in Walnut
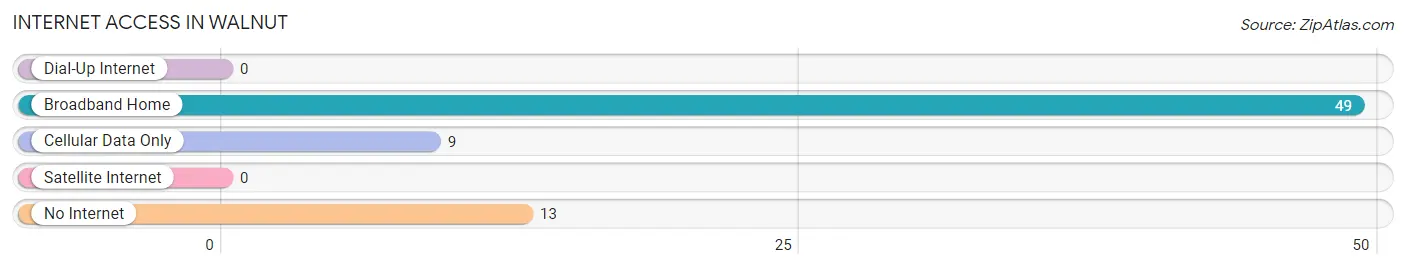
| Internet Type | # Households | % Households |
| Dial-Up Internet | 0 | 0.0% |
| Broadband Home | 49 | 69.0% |
| Cellular Data Only | 9 | 12.7% |
| Satellite Internet | 0 | 0.0% |
| No Internet | 13 | 18.3% |
| Total | 71 | 100.0% |
Walnut Summary
Walnut, Kansas is a small town located in the northeast corner of the state, in the county of Anderson. It is situated on the banks of the Neosho River, and is surrounded by rolling hills and farmland. The town has a population of just over 500 people, and is known for its small-town charm and friendly atmosphere.
Walnut was founded in 1867 by a group of settlers from Ohio. The town was named after the walnut trees that grew in abundance in the area. The settlers were attracted to the area due to its fertile soil and abundant water supply. The town quickly grew and prospered, and by the early 1900s, it had become a thriving agricultural center.
The economy of Walnut is largely based on agriculture. The town is home to several large farms, as well as a number of smaller family-owned operations. The town is also home to a number of businesses, including a grocery store, a hardware store, a bank, and a few restaurants.
The geography of Walnut is typical of the Midwest. The town is located in the rolling hills of the Ozark Plateau, and is surrounded by farmland. The Neosho River runs through the town, providing a source of water for the area. The town is also located near several state parks, including the Neosho State Park and the Anderson State Park.
The demographics of Walnut are typical of a small rural town. The population is predominantly white, with a small percentage of African Americans and Hispanics. The median household income is slightly below the national average, and the poverty rate is slightly higher than the national average.
Walnut is a small town with a big heart. The town is known for its friendly atmosphere and its commitment to preserving its rural character. The town is home to a number of festivals and events throughout the year, including the Walnut Festival, which is held every summer. The town also hosts a number of community events, such as the Walnut Community Fair and the Walnut County Fair.
Walnut is a great place to live and work. The town offers a variety of amenities, including a low cost of living, a safe and friendly atmosphere, and a strong sense of community. The town is also home to a number of schools, including a public elementary school, a middle school, and a high school. The town is also home to a number of churches, including the Walnut United Methodist Church and the Walnut Baptist Church.
Walnut is a great place to visit and explore. The town is home to a number of attractions, including the Walnut Historical Museum, the Walnut County Courthouse, and the Walnut Creek Nature Center. The town is also home to a number of parks, including the Walnut Creek Park and the Walnut Creek Nature Preserve. The town is also home to a number of restaurants, including the Walnut Cafe and the Walnut Grill.
Walnut is a great place to call home. The town offers a variety of amenities, a safe and friendly atmosphere, and a strong sense of community. The town is also home to a number of attractions, including the Walnut Historical Museum, the Walnut County Courthouse, and the Walnut Creek Nature Center. The town is also home to a number of parks, including the Walnut Creek Park and the Walnut Creek Nature Preserve. The town is also home to a number of restaurants, including the Walnut Cafe and the Walnut Grill.
Common Questions
What is Per Capita Income in Walnut?
Per Capita income in Walnut is $27,168.
What is the Median Family Income in Walnut?
Median Family Income in Walnut is $58,375.
What is the Median Household income in Walnut?
Median Household Income in Walnut is $58,375.
What is Income or Wage Gap in Walnut?
Income or Wage Gap in Walnut is 59.7%.
Women in Walnut earn 40.3 cents for every dollar earned by a man.
What is Family Income Deficit in Walnut?
Family Income Deficit in Walnut is $11,967.
Families that are below poverty line in Walnut earn $11,967 less on average than the poverty threshold level.
What is Inequality or Gini Index in Walnut?
Inequality or Gini Index in Walnut is 0.42.
What is the Total Population of Walnut?
Total Population of Walnut is 201.
What is the Total Male Population of Walnut?
Total Male Population of Walnut is 113.
What is the Total Female Population of Walnut?
Total Female Population of Walnut is 88.
What is the Ratio of Males per 100 Females in Walnut?
There are 128.41 Males per 100 Females in Walnut.
What is the Ratio of Females per 100 Males in Walnut?
There are 77.88 Females per 100 Males in Walnut.
What is the Median Population Age in Walnut?
Median Population Age in Walnut is 40.0 Years.
What is the Average Family Size in Walnut
Average Family Size in Walnut is 2.9 People.
What is the Average Household Size in Walnut
Average Household Size in Walnut is 2.8 People.
How Large is the Labor Force in Walnut?
There are 120 People in the Labor Forcein in Walnut.
What is the Percentage of People in the Labor Force in Walnut?
73.6% of People are in the Labor Force in Walnut.
What is the Unemployment Rate in Walnut?
Unemployment Rate in Walnut is 5.8%.