Cambodian vs Immigrants from England 2 or more Vehicles in Household
COMPARE
Cambodian
Immigrants from England
2 or more Vehicles in Household
2 or more Vehicles in Household Comparison
Cambodians
Immigrants from England
53.3%
2 OR MORE VEHICLES IN HOUSEHOLD
2.3/ 100
METRIC RATING
239th/ 347
METRIC RANK
58.1%
2 OR MORE VEHICLES IN HOUSEHOLD
99.3/ 100
METRIC RATING
80th/ 347
METRIC RANK
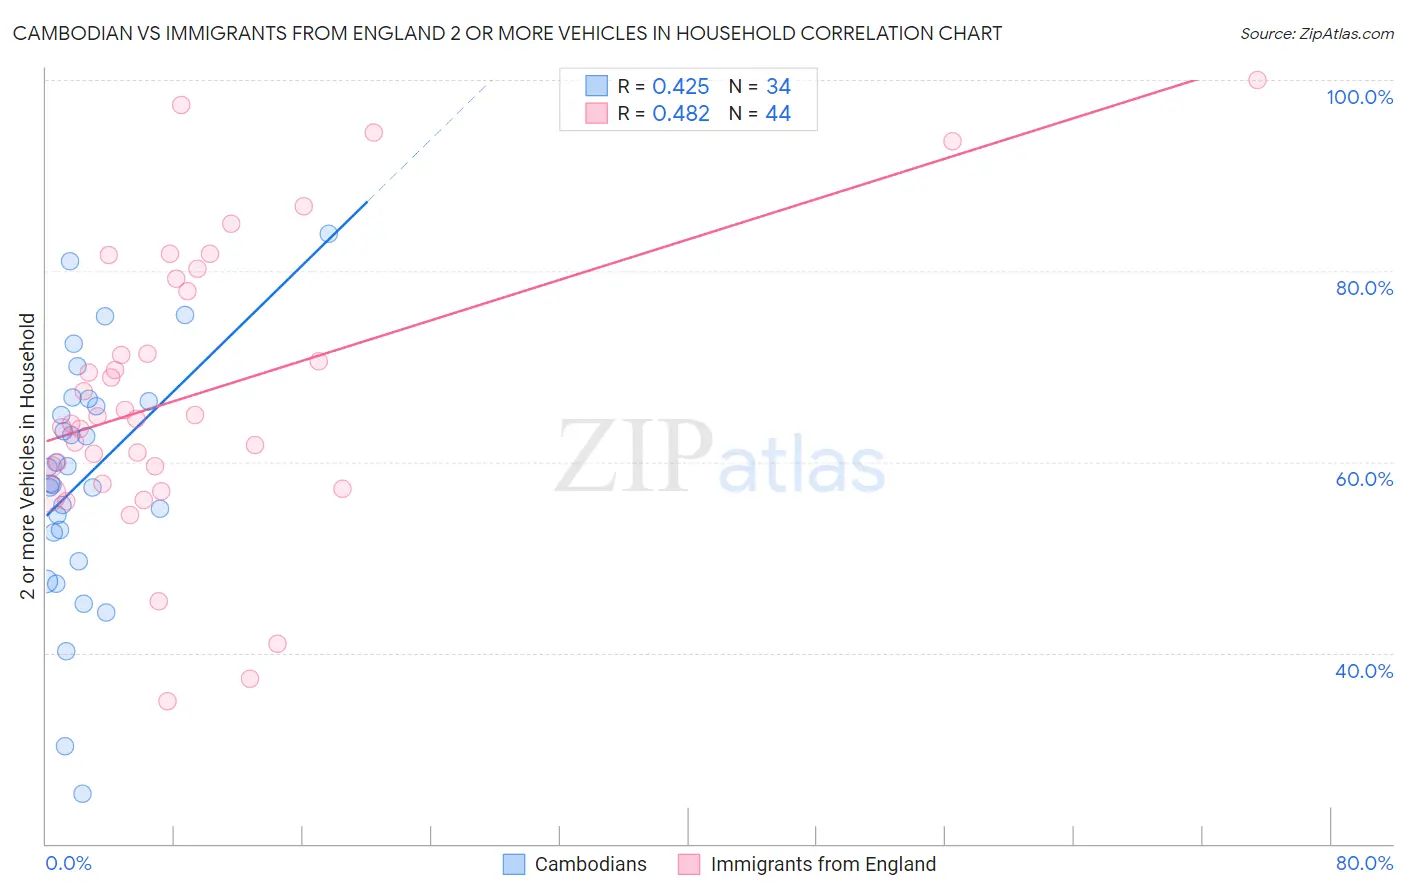
Cambodian vs Immigrants from England 2 or more Vehicles in Household Correlation Chart
The statistical analysis conducted on geographies consisting of 102,491,174 people shows a moderate positive correlation between the proportion of Cambodians and percentage of households with 2 or more vehicles available in the United States with a correlation coefficient (R) of 0.425 and weighted average of 53.3%. Similarly, the statistical analysis conducted on geographies consisting of 391,775,119 people shows a moderate positive correlation between the proportion of Immigrants from England and percentage of households with 2 or more vehicles available in the United States with a correlation coefficient (R) of 0.482 and weighted average of 58.1%, a difference of 9.1%.
2 or more Vehicles in Household Correlation Summary
| Measurement | Cambodian | Immigrants from England |
| Minimum | 25.3% | 34.9% |
| Maximum | 83.9% | 100.0% |
| Range | 58.6% | 65.1% |
| Mean | 58.4% | 67.2% |
| Median | 58.6% | 64.7% |
| Interquartile 25% (IQ1) | 52.7% | 58.6% |
| Interquartile 75% (IQ3) | 66.4% | 78.6% |
| Interquartile Range (IQR) | 13.8% | 19.9% |
| Standard Deviation (Sample) | 12.9% | 14.9% |
| Standard Deviation (Population) | 12.7% | 14.7% |
Similar Demographics by 2 or more Vehicles in Household
Demographics Similar to Cambodians by 2 or more Vehicles in Household
In terms of 2 or more vehicles in household, the demographic groups most similar to Cambodians are Immigrants from Armenia (53.3%, a difference of 0.010%), Macedonian (53.3%, a difference of 0.070%), Immigrants from Europe (53.2%, a difference of 0.070%), Immigrants from Sierra Leone (53.2%, a difference of 0.10%), and Immigrants from Eastern Asia (53.2%, a difference of 0.10%).
| Demographics | Rating | Rank | 2 or more Vehicles in Household |
| Immigrants | Guatemala | 3.2 /100 | #232 | Tragic 53.5% |
| Ugandans | 3.2 /100 | #233 | Tragic 53.5% |
| Immigrants | Switzerland | 3.0 /100 | #234 | Tragic 53.4% |
| Immigrants | Middle Africa | 3.0 /100 | #235 | Tragic 53.4% |
| Indonesians | 2.7 /100 | #236 | Tragic 53.4% |
| Macedonians | 2.4 /100 | #237 | Tragic 53.3% |
| Immigrants | Armenia | 2.3 /100 | #238 | Tragic 53.3% |
| Cambodians | 2.3 /100 | #239 | Tragic 53.3% |
| Immigrants | Europe | 2.1 /100 | #240 | Tragic 53.2% |
| Immigrants | Sierra Leone | 2.1 /100 | #241 | Tragic 53.2% |
| Immigrants | Eastern Asia | 2.1 /100 | #242 | Tragic 53.2% |
| Ethiopians | 1.7 /100 | #243 | Tragic 53.1% |
| Indians (Asian) | 1.7 /100 | #244 | Tragic 53.1% |
| Immigrants | Ethiopia | 1.5 /100 | #245 | Tragic 53.0% |
| Immigrants | Nigeria | 1.2 /100 | #246 | Tragic 52.9% |
Demographics Similar to Immigrants from England by 2 or more Vehicles in Household
In terms of 2 or more vehicles in household, the demographic groups most similar to Immigrants from England are Immigrants from Iraq (58.1%, a difference of 0.010%), Iranian (58.1%, a difference of 0.10%), Delaware (58.2%, a difference of 0.14%), Icelander (58.0%, a difference of 0.14%), and Maltese (58.0%, a difference of 0.17%).
| Demographics | Rating | Rank | 2 or more Vehicles in Household |
| Bolivians | 99.6 /100 | #73 | Exceptional 58.3% |
| Immigrants | Afghanistan | 99.6 /100 | #74 | Exceptional 58.3% |
| Poles | 99.5 /100 | #75 | Exceptional 58.3% |
| Creek | 99.5 /100 | #76 | Exceptional 58.3% |
| Slovenes | 99.5 /100 | #77 | Exceptional 58.3% |
| Lithuanians | 99.5 /100 | #78 | Exceptional 58.2% |
| Delaware | 99.4 /100 | #79 | Exceptional 58.2% |
| Immigrants | England | 99.3 /100 | #80 | Exceptional 58.1% |
| Immigrants | Iraq | 99.3 /100 | #81 | Exceptional 58.1% |
| Iranians | 99.3 /100 | #82 | Exceptional 58.1% |
| Icelanders | 99.2 /100 | #83 | Exceptional 58.0% |
| Maltese | 99.2 /100 | #84 | Exceptional 58.0% |
| Slovaks | 99.2 /100 | #85 | Exceptional 58.0% |
| Potawatomi | 99.1 /100 | #86 | Exceptional 58.0% |
| Thais | 99.1 /100 | #87 | Exceptional 57.9% |