Afghan vs Immigrants from England 2 or more Vehicles in Household
COMPARE
Afghan
Immigrants from England
2 or more Vehicles in Household
2 or more Vehicles in Household Comparison
Afghans
Immigrants from England
59.0%
2 OR MORE VEHICLES IN HOUSEHOLD
99.9/ 100
METRIC RATING
57th/ 347
METRIC RANK
58.1%
2 OR MORE VEHICLES IN HOUSEHOLD
99.3/ 100
METRIC RATING
80th/ 347
METRIC RANK
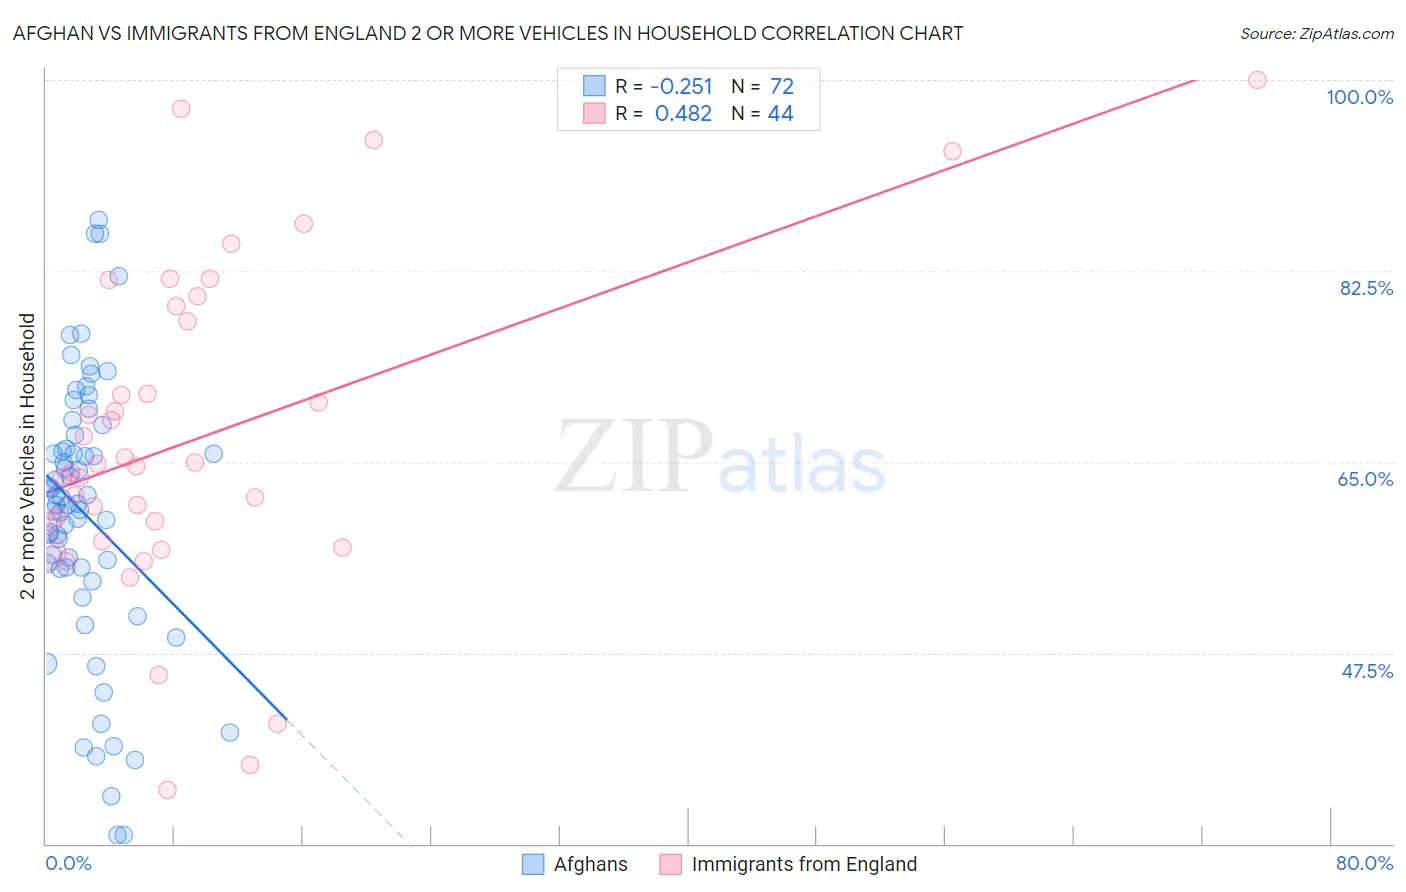
Afghan vs Immigrants from England 2 or more Vehicles in Household Correlation Chart
The statistical analysis conducted on geographies consisting of 148,831,306 people shows a weak negative correlation between the proportion of Afghans and percentage of households with 2 or more vehicles available in the United States with a correlation coefficient (R) of -0.251 and weighted average of 59.0%. Similarly, the statistical analysis conducted on geographies consisting of 391,775,119 people shows a moderate positive correlation between the proportion of Immigrants from England and percentage of households with 2 or more vehicles available in the United States with a correlation coefficient (R) of 0.482 and weighted average of 58.1%, a difference of 1.5%.
2 or more Vehicles in Household Correlation Summary
| Measurement | Afghan | Immigrants from England |
| Minimum | 30.8% | 34.9% |
| Maximum | 87.1% | 100.0% |
| Range | 56.3% | 65.1% |
| Mean | 60.2% | 67.2% |
| Median | 61.1% | 64.7% |
| Interquartile 25% (IQ1) | 55.3% | 58.6% |
| Interquartile 75% (IQ3) | 66.8% | 78.6% |
| Interquartile Range (IQR) | 11.5% | 19.9% |
| Standard Deviation (Sample) | 12.6% | 14.9% |
| Standard Deviation (Population) | 12.5% | 14.7% |
Similar Demographics by 2 or more Vehicles in Household
Demographics Similar to Afghans by 2 or more Vehicles in Household
In terms of 2 or more vehicles in household, the demographic groups most similar to Afghans are Chickasaw (59.0%, a difference of 0.0%), Luxembourger (59.1%, a difference of 0.11%), Bhutanese (59.1%, a difference of 0.14%), Immigrants from Scotland (58.9%, a difference of 0.18%), and Spanish American (58.9%, a difference of 0.21%).
| Demographics | Rating | Rank | 2 or more Vehicles in Household |
| Choctaw | 99.9 /100 | #50 | Exceptional 59.3% |
| Spaniards | 99.9 /100 | #51 | Exceptional 59.2% |
| Immigrants | Laos | 99.9 /100 | #52 | Exceptional 59.2% |
| Celtics | 99.9 /100 | #53 | Exceptional 59.2% |
| Bhutanese | 99.9 /100 | #54 | Exceptional 59.1% |
| Luxembourgers | 99.9 /100 | #55 | Exceptional 59.1% |
| Chickasaw | 99.9 /100 | #56 | Exceptional 59.0% |
| Afghans | 99.9 /100 | #57 | Exceptional 59.0% |
| Immigrants | Scotland | 99.8 /100 | #58 | Exceptional 58.9% |
| Spanish Americans | 99.8 /100 | #59 | Exceptional 58.9% |
| French Canadians | 99.8 /100 | #60 | Exceptional 58.9% |
| Osage | 99.8 /100 | #61 | Exceptional 58.8% |
| Immigrants | Nonimmigrants | 99.8 /100 | #62 | Exceptional 58.8% |
| Mexican American Indians | 99.8 /100 | #63 | Exceptional 58.7% |
| Portuguese | 99.7 /100 | #64 | Exceptional 58.6% |
Demographics Similar to Immigrants from England by 2 or more Vehicles in Household
In terms of 2 or more vehicles in household, the demographic groups most similar to Immigrants from England are Immigrants from Iraq (58.1%, a difference of 0.010%), Iranian (58.1%, a difference of 0.10%), Delaware (58.2%, a difference of 0.14%), Icelander (58.0%, a difference of 0.14%), and Maltese (58.0%, a difference of 0.17%).
| Demographics | Rating | Rank | 2 or more Vehicles in Household |
| Bolivians | 99.6 /100 | #73 | Exceptional 58.3% |
| Immigrants | Afghanistan | 99.6 /100 | #74 | Exceptional 58.3% |
| Poles | 99.5 /100 | #75 | Exceptional 58.3% |
| Creek | 99.5 /100 | #76 | Exceptional 58.3% |
| Slovenes | 99.5 /100 | #77 | Exceptional 58.3% |
| Lithuanians | 99.5 /100 | #78 | Exceptional 58.2% |
| Delaware | 99.4 /100 | #79 | Exceptional 58.2% |
| Immigrants | England | 99.3 /100 | #80 | Exceptional 58.1% |
| Immigrants | Iraq | 99.3 /100 | #81 | Exceptional 58.1% |
| Iranians | 99.3 /100 | #82 | Exceptional 58.1% |
| Icelanders | 99.2 /100 | #83 | Exceptional 58.0% |
| Maltese | 99.2 /100 | #84 | Exceptional 58.0% |
| Slovaks | 99.2 /100 | #85 | Exceptional 58.0% |
| Potawatomi | 99.1 /100 | #86 | Exceptional 58.0% |
| Thais | 99.1 /100 | #87 | Exceptional 57.9% |