Yakama vs Asian Single Mother Households
COMPARE
Yakama
Asian
Single Mother Households
Single Mother Households Comparison
Yakama
Asians
8.4%
SINGLE MOTHER HOUSEHOLDS
0.0/ 100
METRIC RATING
328th/ 347
METRIC RANK
5.6%
SINGLE MOTHER HOUSEHOLDS
98.5/ 100
METRIC RATING
69th/ 347
METRIC RANK
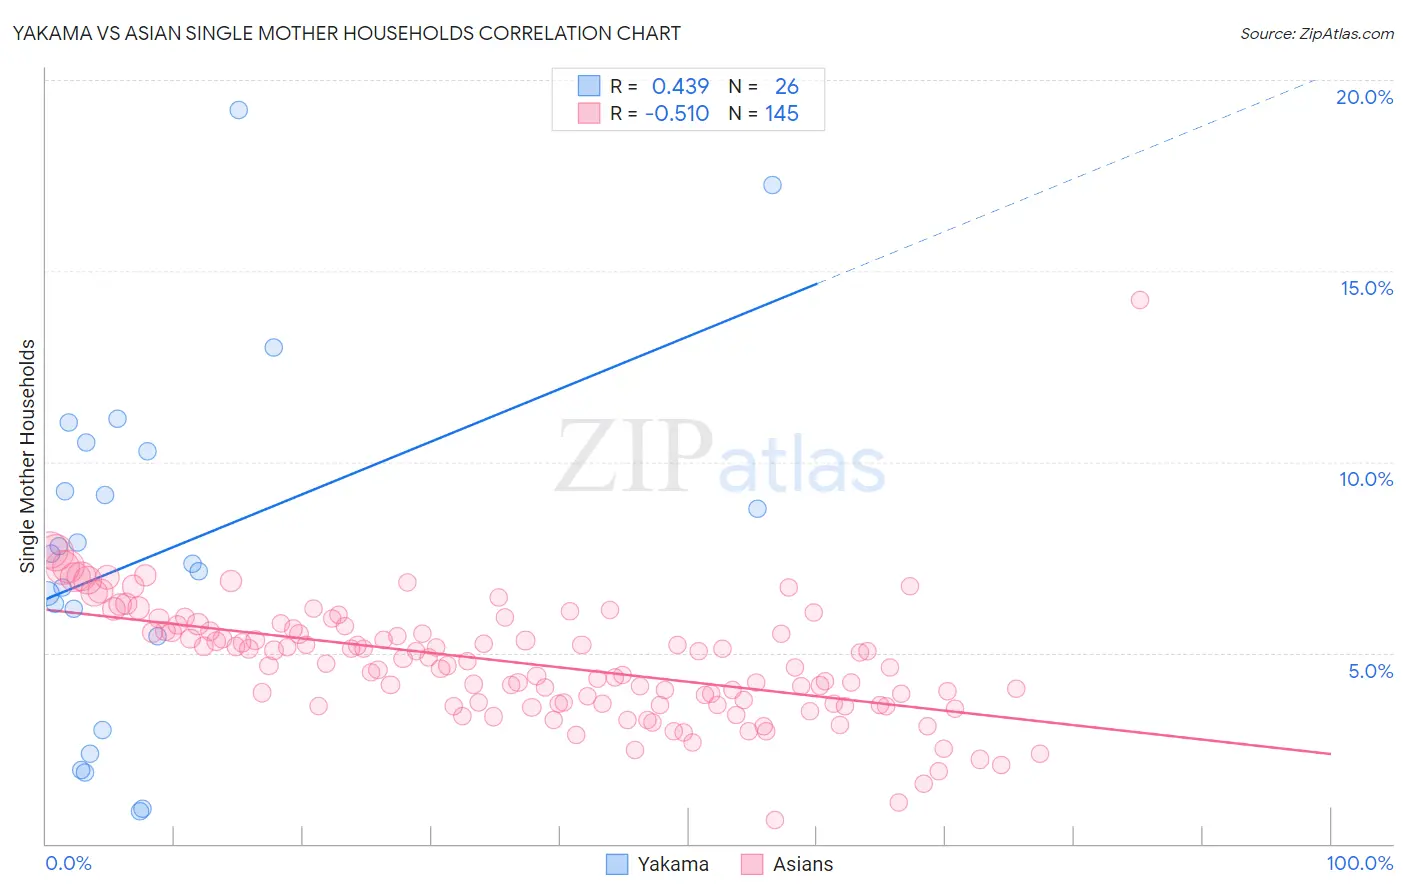
Yakama vs Asian Single Mother Households Correlation Chart
The statistical analysis conducted on geographies consisting of 19,909,884 people shows a moderate positive correlation between the proportion of Yakama and percentage of single mother households in the United States with a correlation coefficient (R) of 0.439 and weighted average of 8.4%. Similarly, the statistical analysis conducted on geographies consisting of 547,100,295 people shows a substantial negative correlation between the proportion of Asians and percentage of single mother households in the United States with a correlation coefficient (R) of -0.510 and weighted average of 5.6%, a difference of 50.4%.
Single Mother Households Correlation Summary
| Measurement | Yakama | Asian |
| Minimum | 0.86% | 0.61% |
| Maximum | 19.2% | 14.2% |
| Range | 18.4% | 13.6% |
| Mean | 7.7% | 4.7% |
| Median | 7.5% | 4.7% |
| Interquartile 25% (IQ1) | 5.4% | 3.7% |
| Interquartile 75% (IQ3) | 10.3% | 5.6% |
| Interquartile Range (IQR) | 4.8% | 1.9% |
| Standard Deviation (Sample) | 4.6% | 1.6% |
| Standard Deviation (Population) | 4.5% | 1.6% |
Similar Demographics by Single Mother Households
Demographics Similar to Yakama by Single Mother Households
In terms of single mother households, the demographic groups most similar to Yakama are Immigrants from Haiti (8.4%, a difference of 0.18%), British West Indian (8.4%, a difference of 0.32%), Immigrants from Caribbean (8.4%, a difference of 0.45%), Immigrants from Jamaica (8.4%, a difference of 0.63%), and Hopi (8.5%, a difference of 0.75%).
| Demographics | Rating | Rank | Single Mother Households |
| Immigrants | Senegal | 0.0 /100 | #321 | Tragic 8.3% |
| Pima | 0.0 /100 | #322 | Tragic 8.3% |
| Haitians | 0.0 /100 | #323 | Tragic 8.3% |
| Immigrants | Jamaica | 0.0 /100 | #324 | Tragic 8.4% |
| Immigrants | Caribbean | 0.0 /100 | #325 | Tragic 8.4% |
| British West Indians | 0.0 /100 | #326 | Tragic 8.4% |
| Immigrants | Haiti | 0.0 /100 | #327 | Tragic 8.4% |
| Yakama | 0.0 /100 | #328 | Tragic 8.4% |
| Hopi | 0.0 /100 | #329 | Tragic 8.5% |
| Inupiat | 0.0 /100 | #330 | Tragic 8.5% |
| Sioux | 0.0 /100 | #331 | Tragic 8.5% |
| U.S. Virgin Islanders | 0.0 /100 | #332 | Tragic 8.6% |
| Liberians | 0.0 /100 | #333 | Tragic 8.6% |
| Immigrants | Liberia | 0.0 /100 | #334 | Tragic 8.7% |
| Immigrants | Dominica | 0.0 /100 | #335 | Tragic 8.7% |
Demographics Similar to Asians by Single Mother Households
In terms of single mother households, the demographic groups most similar to Asians are Immigrants from Bulgaria (5.6%, a difference of 0.020%), Immigrants from Eastern Europe (5.6%, a difference of 0.080%), Immigrants from Kazakhstan (5.6%, a difference of 0.080%), Italian (5.6%, a difference of 0.090%), and Immigrants from Canada (5.6%, a difference of 0.11%).
| Demographics | Rating | Rank | Single Mother Households |
| Poles | 98.6 /100 | #62 | Exceptional 5.6% |
| Immigrants | North Macedonia | 98.6 /100 | #63 | Exceptional 5.6% |
| Immigrants | France | 98.6 /100 | #64 | Exceptional 5.6% |
| Greeks | 98.6 /100 | #65 | Exceptional 5.6% |
| Immigrants | Canada | 98.5 /100 | #66 | Exceptional 5.6% |
| Italians | 98.5 /100 | #67 | Exceptional 5.6% |
| Immigrants | Bulgaria | 98.5 /100 | #68 | Exceptional 5.6% |
| Asians | 98.5 /100 | #69 | Exceptional 5.6% |
| Immigrants | Eastern Europe | 98.4 /100 | #70 | Exceptional 5.6% |
| Immigrants | Kazakhstan | 98.4 /100 | #71 | Exceptional 5.6% |
| Immigrants | Netherlands | 98.4 /100 | #72 | Exceptional 5.6% |
| Immigrants | Asia | 98.4 /100 | #73 | Exceptional 5.6% |
| Immigrants | North America | 98.3 /100 | #74 | Exceptional 5.6% |
| Slovenes | 98.3 /100 | #75 | Exceptional 5.6% |
| New Zealanders | 98.2 /100 | #76 | Exceptional 5.6% |