Yakama vs Lebanese 4 or more Vehicles in Household
COMPARE
Yakama
Lebanese
4 or more Vehicles in Household
4 or more Vehicles in Household Comparison
Yakama
Lebanese
12.9%
4 OR MORE VEHICLES IN HOUSEHOLD
100/ 100
METRIC RATING
1st/ 347
METRIC RANK
6.4%
4 OR MORE VEHICLES IN HOUSEHOLD
55.8/ 100
METRIC RATING
168th/ 347
METRIC RANK
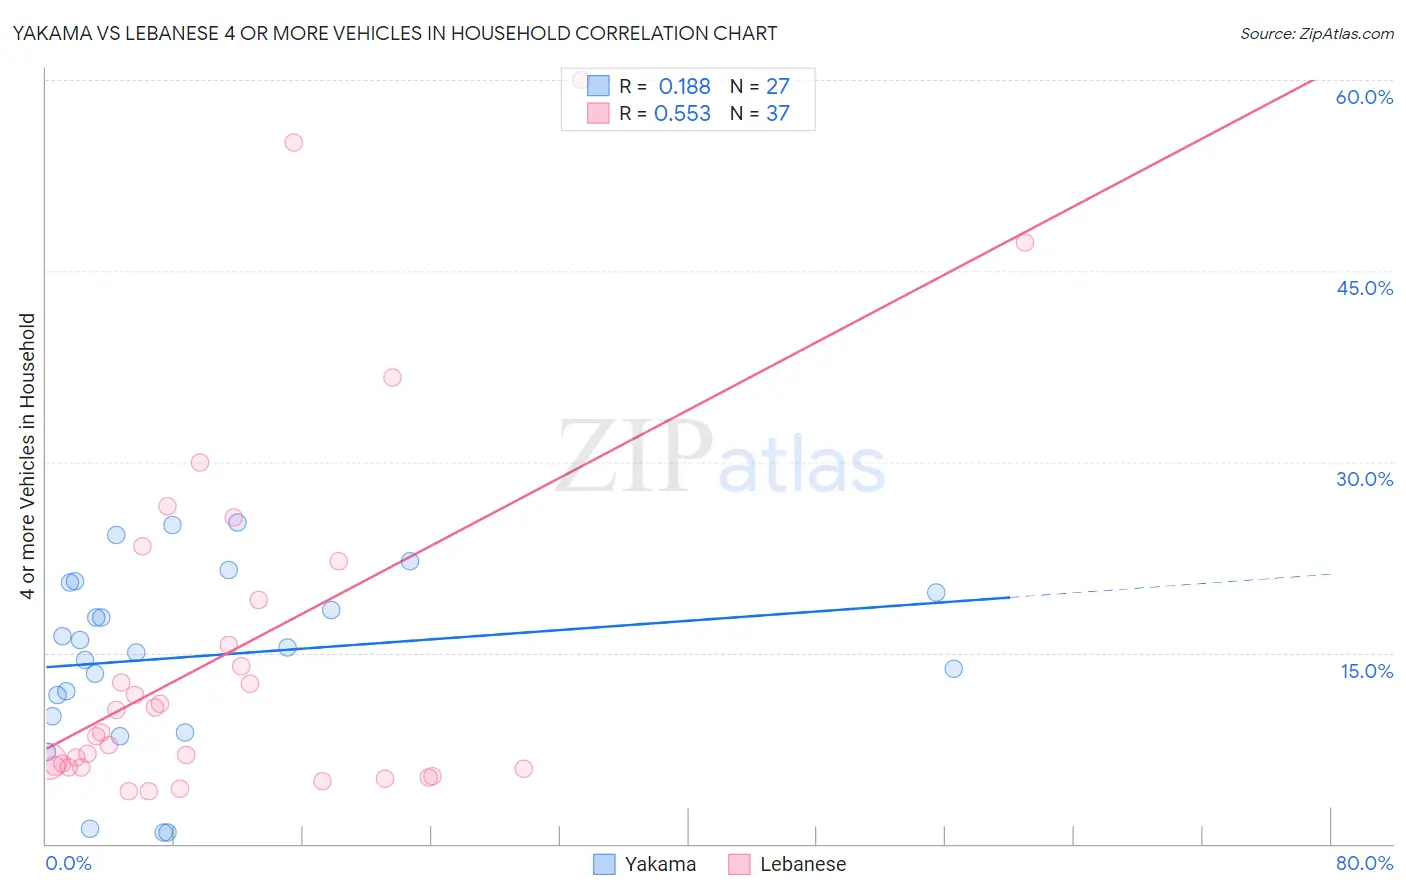
Yakama vs Lebanese 4 or more Vehicles in Household Correlation Chart
The statistical analysis conducted on geographies consisting of 19,917,241 people shows a poor positive correlation between the proportion of Yakama and percentage of households with 4 or more vehicles available in the United States with a correlation coefficient (R) of 0.188 and weighted average of 12.9%. Similarly, the statistical analysis conducted on geographies consisting of 399,865,958 people shows a substantial positive correlation between the proportion of Lebanese and percentage of households with 4 or more vehicles available in the United States with a correlation coefficient (R) of 0.553 and weighted average of 6.4%, a difference of 103.3%.
4 or more Vehicles in Household Correlation Summary
| Measurement | Yakama | Lebanese |
| Minimum | 0.86% | 4.1% |
| Maximum | 25.2% | 60.0% |
| Range | 24.4% | 55.9% |
| Mean | 14.8% | 15.1% |
| Median | 15.4% | 8.8% |
| Interquartile 25% (IQ1) | 10.0% | 6.0% |
| Interquartile 75% (IQ3) | 20.5% | 20.7% |
| Interquartile Range (IQR) | 10.5% | 14.7% |
| Standard Deviation (Sample) | 7.0% | 14.3% |
| Standard Deviation (Population) | 6.9% | 14.1% |
Similar Demographics by 4 or more Vehicles in Household
Demographics Similar to Yakama by 4 or more Vehicles in Household
In terms of 4 or more vehicles in household, the demographic groups most similar to Yakama are Colville (11.1%, a difference of 16.1%), Spanish American Indian (10.8%, a difference of 20.1%), Tongan (10.0%, a difference of 28.9%), Immigrants from Fiji (9.6%, a difference of 34.4%), and Puget Sound Salish (9.4%, a difference of 37.8%).
| Demographics | Rating | Rank | 4 or more Vehicles in Household |
| Yakama | 100 /100 | #1 | Exceptional 12.9% |
| Colville | 100.0 /100 | #2 | Exceptional 11.1% |
| Spanish American Indians | 100.0 /100 | #3 | Exceptional 10.8% |
| Tongans | 100.0 /100 | #4 | Exceptional 10.0% |
| Immigrants | Fiji | 100.0 /100 | #5 | Exceptional 9.6% |
| Puget Sound Salish | 100.0 /100 | #6 | Exceptional 9.4% |
| Native Hawaiians | 100.0 /100 | #7 | Exceptional 9.4% |
| Arapaho | 100.0 /100 | #8 | Exceptional 9.4% |
| Samoans | 100.0 /100 | #9 | Exceptional 9.2% |
| Paiute | 100.0 /100 | #10 | Exceptional 9.0% |
| Immigrants | Mexico | 100.0 /100 | #11 | Exceptional 9.0% |
| Mexicans | 100.0 /100 | #12 | Exceptional 8.9% |
| Hawaiians | 100.0 /100 | #13 | Exceptional 8.9% |
| Chinese | 100.0 /100 | #14 | Exceptional 8.8% |
| Shoshone | 100.0 /100 | #15 | Exceptional 8.8% |
Demographics Similar to Lebanese by 4 or more Vehicles in Household
In terms of 4 or more vehicles in household, the demographic groups most similar to Lebanese are Estonian (6.4%, a difference of 0.070%), Polish (6.4%, a difference of 0.11%), Immigrants from Denmark (6.4%, a difference of 0.20%), Immigrants from Syria (6.3%, a difference of 0.31%), and Immigrants from India (6.3%, a difference of 0.40%).
| Demographics | Rating | Rank | 4 or more Vehicles in Household |
| Immigrants | Cameroon | 64.4 /100 | #161 | Good 6.4% |
| Immigrants | Pakistan | 63.2 /100 | #162 | Good 6.4% |
| Chileans | 61.2 /100 | #163 | Good 6.4% |
| Hungarians | 61.1 /100 | #164 | Good 6.4% |
| Immigrants | Peru | 59.8 /100 | #165 | Average 6.4% |
| Immigrants | Denmark | 57.8 /100 | #166 | Average 6.4% |
| Poles | 56.9 /100 | #167 | Average 6.4% |
| Lebanese | 55.8 /100 | #168 | Average 6.4% |
| Estonians | 55.1 /100 | #169 | Average 6.4% |
| Immigrants | Syria | 52.8 /100 | #170 | Average 6.3% |
| Immigrants | India | 51.9 /100 | #171 | Average 6.3% |
| Immigrants | Lebanon | 51.7 /100 | #172 | Average 6.3% |
| Slovenes | 51.1 /100 | #173 | Average 6.3% |
| Lithuanians | 50.0 /100 | #174 | Average 6.3% |
| Immigrants | Western Europe | 48.8 /100 | #175 | Average 6.3% |