White/Caucasian vs German 2 or more Vehicles in Household
COMPARE
White/Caucasian
German
2 or more Vehicles in Household
2 or more Vehicles in Household Comparison
Whites/Caucasians
Germans
60.8%
2 OR MORE VEHICLES IN HOUSEHOLD
100.0/ 100
METRIC RATING
25th/ 347
METRIC RANK
61.6%
2 OR MORE VEHICLES IN HOUSEHOLD
100.0/ 100
METRIC RATING
12th/ 347
METRIC RANK
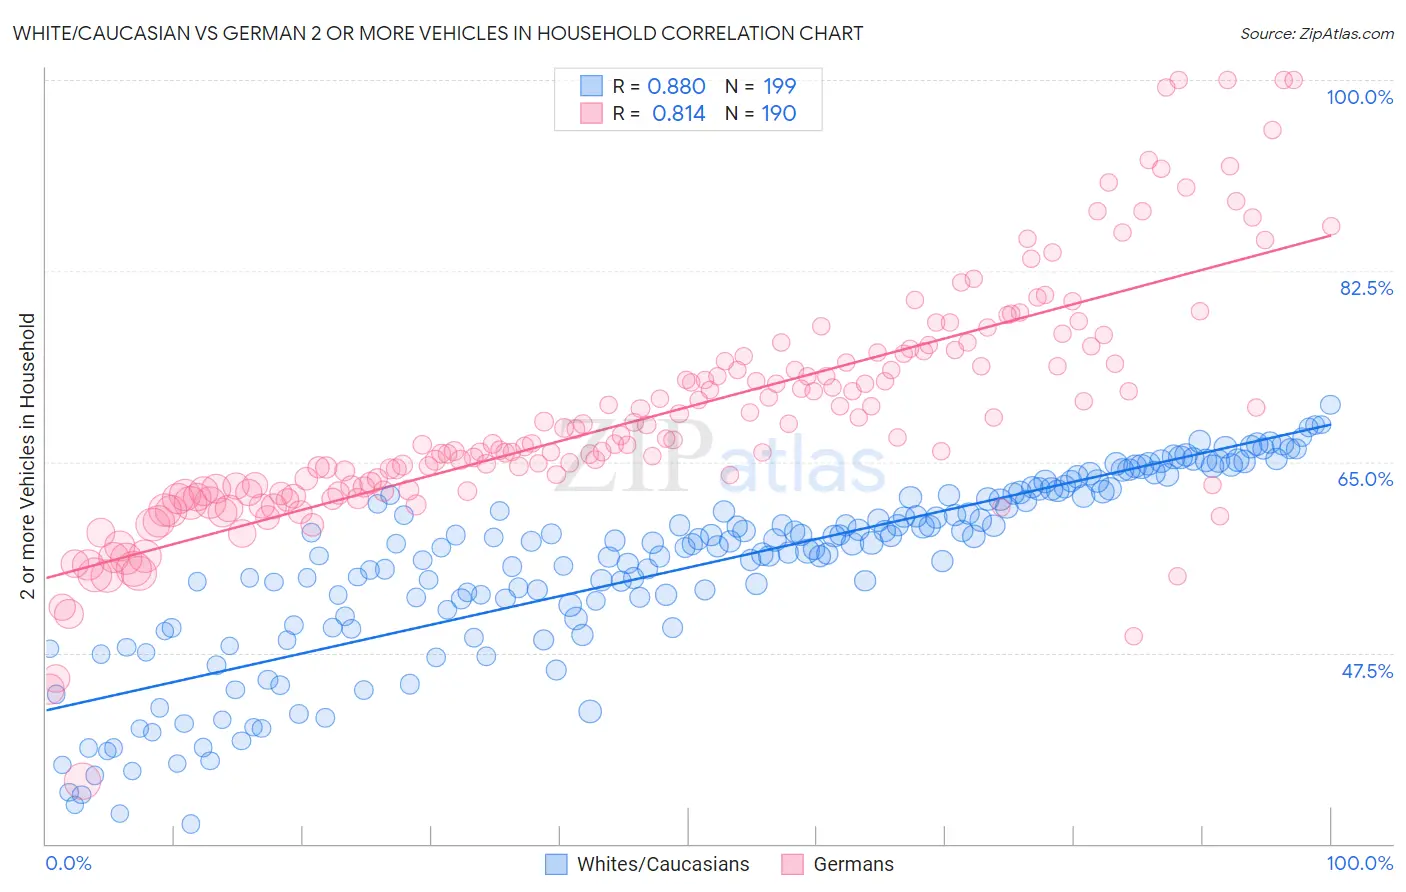
White/Caucasian vs German 2 or more Vehicles in Household Correlation Chart
The statistical analysis conducted on geographies consisting of 571,878,025 people shows a very strong positive correlation between the proportion of Whites/Caucasians and percentage of households with 2 or more vehicles available in the United States with a correlation coefficient (R) of 0.880 and weighted average of 60.8%. Similarly, the statistical analysis conducted on geographies consisting of 580,661,137 people shows a very strong positive correlation between the proportion of Germans and percentage of households with 2 or more vehicles available in the United States with a correlation coefficient (R) of 0.814 and weighted average of 61.6%, a difference of 1.2%.
2 or more Vehicles in Household Correlation Summary
| Measurement | White/Caucasian | German |
| Minimum | 31.8% | 35.8% |
| Maximum | 70.2% | 100.0% |
| Range | 38.4% | 64.2% |
| Mean | 55.3% | 69.3% |
| Median | 57.5% | 67.1% |
| Interquartile 25% (IQ1) | 50.1% | 62.3% |
| Interquartile 75% (IQ3) | 61.9% | 74.6% |
| Interquartile Range (IQR) | 11.8% | 12.3% |
| Standard Deviation (Sample) | 8.6% | 10.7% |
| Standard Deviation (Population) | 8.6% | 10.7% |
Demographics Similar to Whites/Caucasians and Germans by 2 or more Vehicles in Household
In terms of 2 or more vehicles in household, the demographic groups most similar to Whites/Caucasians are Welsh (60.8%, a difference of 0.050%), Immigrants from Vietnam (60.9%, a difference of 0.15%), Scotch-Irish (60.9%, a difference of 0.19%), Swiss (61.0%, a difference of 0.23%), and Korean (61.0%, a difference of 0.26%). Similarly, the demographic groups most similar to Germans are Dutch (61.6%, a difference of 0.11%), Samoan (61.5%, a difference of 0.12%), Czech (61.5%, a difference of 0.16%), Mexican (61.7%, a difference of 0.17%), and Nepalese (61.4%, a difference of 0.25%).
| Demographics | Rating | Rank | 2 or more Vehicles in Household |
| English | 100.0 /100 | #8 | Exceptional 61.9% |
| Swedes | 100.0 /100 | #9 | Exceptional 61.8% |
| Mexicans | 100.0 /100 | #10 | Exceptional 61.7% |
| Dutch | 100.0 /100 | #11 | Exceptional 61.6% |
| Germans | 100.0 /100 | #12 | Exceptional 61.6% |
| Samoans | 100.0 /100 | #13 | Exceptional 61.5% |
| Czechs | 100.0 /100 | #14 | Exceptional 61.5% |
| Nepalese | 100.0 /100 | #15 | Exceptional 61.4% |
| Native Hawaiians | 100.0 /100 | #16 | Exceptional 61.4% |
| Basques | 100.0 /100 | #17 | Exceptional 61.4% |
| Europeans | 100.0 /100 | #18 | Exceptional 61.4% |
| Scottish | 100.0 /100 | #19 | Exceptional 61.2% |
| Sri Lankans | 100.0 /100 | #20 | Exceptional 61.0% |
| Koreans | 100.0 /100 | #21 | Exceptional 61.0% |
| Swiss | 100.0 /100 | #22 | Exceptional 61.0% |
| Scotch-Irish | 100.0 /100 | #23 | Exceptional 60.9% |
| Immigrants | Vietnam | 100.0 /100 | #24 | Exceptional 60.9% |
| Whites/Caucasians | 100.0 /100 | #25 | Exceptional 60.8% |
| Welsh | 100.0 /100 | #26 | Exceptional 60.8% |
| Assyrians/Chaldeans/Syriacs | 100.0 /100 | #27 | Exceptional 60.5% |
| Guamanians/Chamorros | 100.0 /100 | #28 | Exceptional 60.5% |