White/Caucasian vs Cherokee 2 or more Vehicles in Household
COMPARE
White/Caucasian
Cherokee
2 or more Vehicles in Household
2 or more Vehicles in Household Comparison
Whites/Caucasians
Cherokee
60.8%
2 OR MORE VEHICLES IN HOUSEHOLD
100.0/ 100
METRIC RATING
25th/ 347
METRIC RANK
59.9%
2 OR MORE VEHICLES IN HOUSEHOLD
100.0/ 100
METRIC RATING
40th/ 347
METRIC RANK
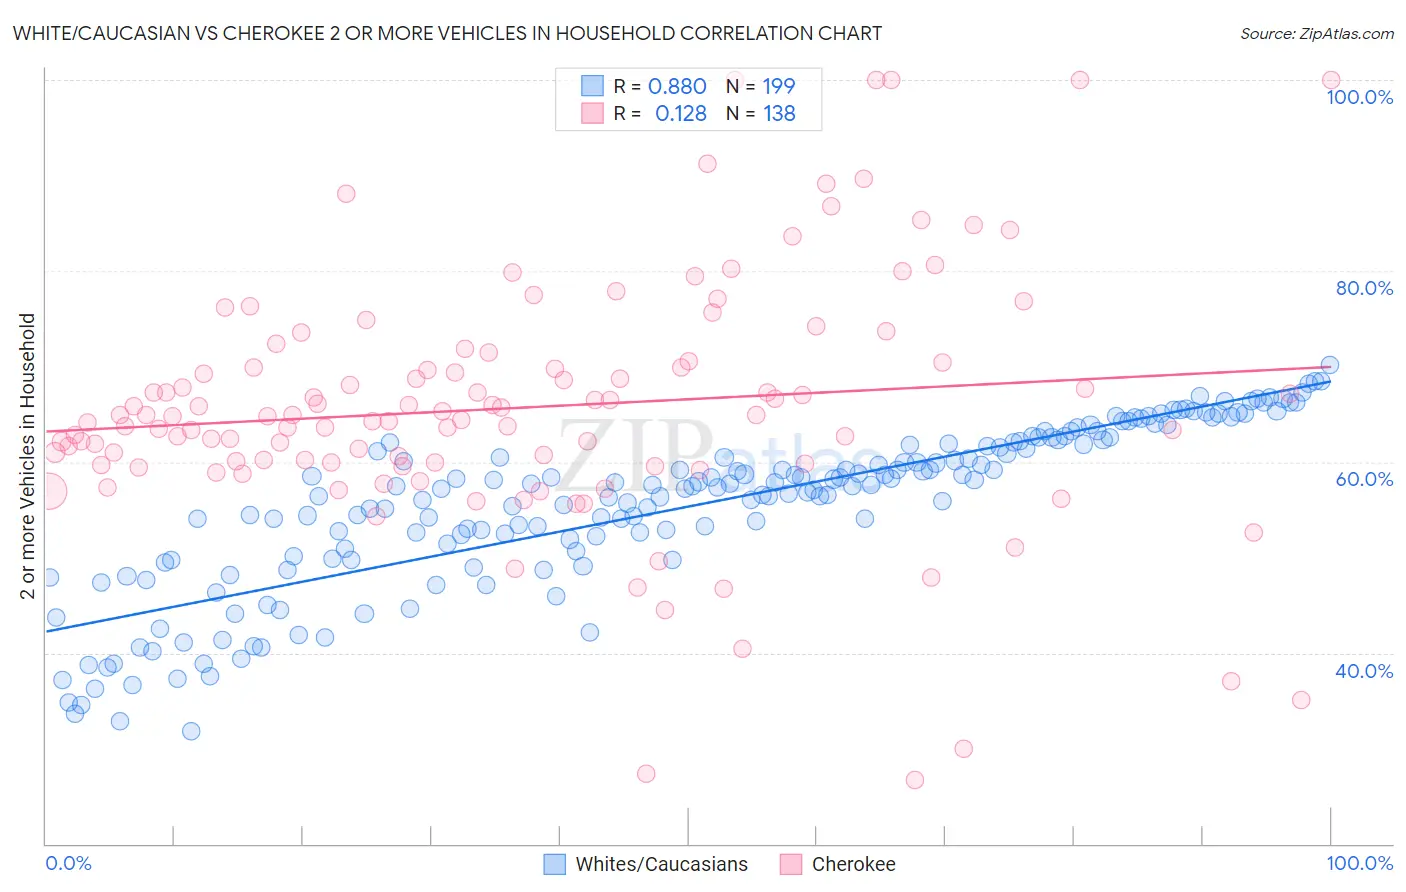
White/Caucasian vs Cherokee 2 or more Vehicles in Household Correlation Chart
The statistical analysis conducted on geographies consisting of 571,878,025 people shows a very strong positive correlation between the proportion of Whites/Caucasians and percentage of households with 2 or more vehicles available in the United States with a correlation coefficient (R) of 0.880 and weighted average of 60.8%. Similarly, the statistical analysis conducted on geographies consisting of 493,419,390 people shows a poor positive correlation between the proportion of Cherokee and percentage of households with 2 or more vehicles available in the United States with a correlation coefficient (R) of 0.128 and weighted average of 59.9%, a difference of 1.6%.
2 or more Vehicles in Household Correlation Summary
| Measurement | White/Caucasian | Cherokee |
| Minimum | 31.8% | 26.7% |
| Maximum | 70.2% | 100.0% |
| Range | 38.4% | 73.3% |
| Mean | 55.3% | 65.7% |
| Median | 57.5% | 64.8% |
| Interquartile 25% (IQ1) | 50.1% | 59.8% |
| Interquartile 75% (IQ3) | 61.9% | 70.3% |
| Interquartile Range (IQR) | 11.8% | 10.6% |
| Standard Deviation (Sample) | 8.6% | 13.1% |
| Standard Deviation (Population) | 8.6% | 13.0% |
Demographics Similar to Whites/Caucasians and Cherokee by 2 or more Vehicles in Household
In terms of 2 or more vehicles in household, the demographic groups most similar to Whites/Caucasians are Welsh (60.8%, a difference of 0.050%), Immigrants from Vietnam (60.9%, a difference of 0.15%), Scotch-Irish (60.9%, a difference of 0.19%), Swiss (61.0%, a difference of 0.23%), and Assyrian/Chaldean/Syriac (60.5%, a difference of 0.47%). Similarly, the demographic groups most similar to Cherokee are Northern European (59.9%, a difference of 0.020%), Malaysian (59.8%, a difference of 0.030%), British (60.0%, a difference of 0.28%), American (60.0%, a difference of 0.29%), and Irish (60.1%, a difference of 0.35%).
| Demographics | Rating | Rank | 2 or more Vehicles in Household |
| Swiss | 100.0 /100 | #22 | Exceptional 61.0% |
| Scotch-Irish | 100.0 /100 | #23 | Exceptional 60.9% |
| Immigrants | Vietnam | 100.0 /100 | #24 | Exceptional 60.9% |
| Whites/Caucasians | 100.0 /100 | #25 | Exceptional 60.8% |
| Welsh | 100.0 /100 | #26 | Exceptional 60.8% |
| Assyrians/Chaldeans/Syriacs | 100.0 /100 | #27 | Exceptional 60.5% |
| Guamanians/Chamorros | 100.0 /100 | #28 | Exceptional 60.5% |
| Hawaiians | 100.0 /100 | #29 | Exceptional 60.4% |
| Finns | 100.0 /100 | #30 | Exceptional 60.3% |
| Spanish American Indians | 100.0 /100 | #31 | Exceptional 60.3% |
| Arapaho | 100.0 /100 | #32 | Exceptional 60.2% |
| Immigrants | Mexico | 100.0 /100 | #33 | Exceptional 60.2% |
| Spanish | 100.0 /100 | #34 | Exceptional 60.2% |
| Immigrants | Philippines | 100.0 /100 | #35 | Exceptional 60.1% |
| Chinese | 100.0 /100 | #36 | Exceptional 60.1% |
| Irish | 100.0 /100 | #37 | Exceptional 60.1% |
| Americans | 100.0 /100 | #38 | Exceptional 60.0% |
| British | 100.0 /100 | #39 | Exceptional 60.0% |
| Cherokee | 100.0 /100 | #40 | Exceptional 59.9% |
| Northern Europeans | 100.0 /100 | #41 | Exceptional 59.9% |
| Malaysians | 100.0 /100 | #42 | Exceptional 59.8% |