White/Caucasian vs Immigrants from Indonesia 2 or more Vehicles in Household
COMPARE
White/Caucasian
Immigrants from Indonesia
2 or more Vehicles in Household
2 or more Vehicles in Household Comparison
Whites/Caucasians
Immigrants from Indonesia
60.8%
2 OR MORE VEHICLES IN HOUSEHOLD
100.0/ 100
METRIC RATING
25th/ 347
METRIC RANK
57.6%
2 OR MORE VEHICLES IN HOUSEHOLD
98.2/ 100
METRIC RATING
104th/ 347
METRIC RANK
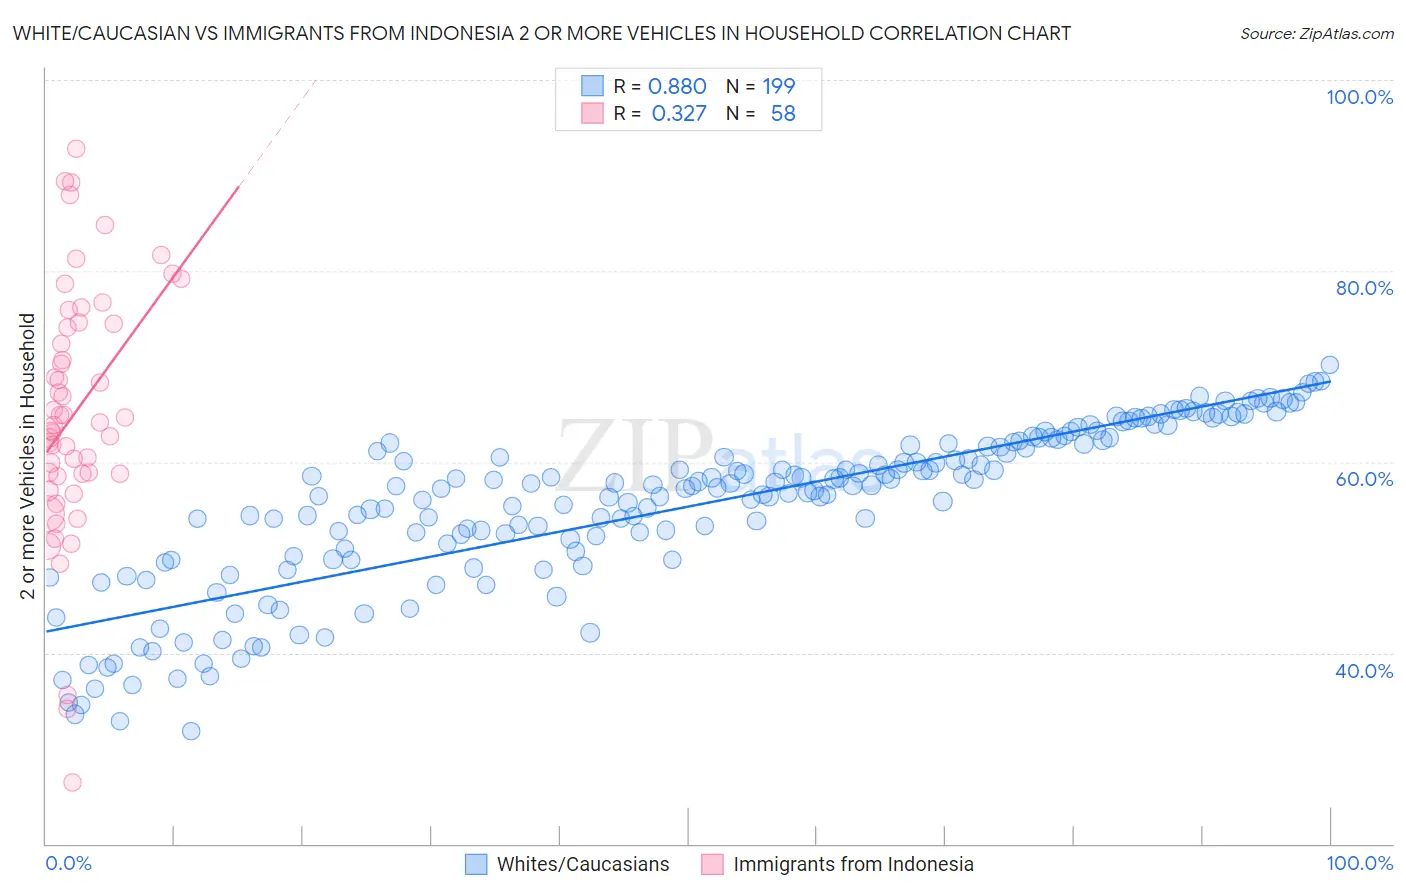
White/Caucasian vs Immigrants from Indonesia 2 or more Vehicles in Household Correlation Chart
The statistical analysis conducted on geographies consisting of 571,878,025 people shows a very strong positive correlation between the proportion of Whites/Caucasians and percentage of households with 2 or more vehicles available in the United States with a correlation coefficient (R) of 0.880 and weighted average of 60.8%. Similarly, the statistical analysis conducted on geographies consisting of 215,617,231 people shows a mild positive correlation between the proportion of Immigrants from Indonesia and percentage of households with 2 or more vehicles available in the United States with a correlation coefficient (R) of 0.327 and weighted average of 57.6%, a difference of 5.7%.
2 or more Vehicles in Household Correlation Summary
| Measurement | White/Caucasian | Immigrants from Indonesia |
| Minimum | 31.8% | 26.4% |
| Maximum | 70.2% | 92.7% |
| Range | 38.4% | 66.4% |
| Mean | 55.3% | 65.2% |
| Median | 57.5% | 64.0% |
| Interquartile 25% (IQ1) | 50.1% | 58.7% |
| Interquartile 75% (IQ3) | 61.9% | 74.4% |
| Interquartile Range (IQR) | 11.8% | 15.7% |
| Standard Deviation (Sample) | 8.6% | 13.1% |
| Standard Deviation (Population) | 8.6% | 13.0% |
Similar Demographics by 2 or more Vehicles in Household
Demographics Similar to Whites/Caucasians by 2 or more Vehicles in Household
In terms of 2 or more vehicles in household, the demographic groups most similar to Whites/Caucasians are Welsh (60.8%, a difference of 0.050%), Immigrants from Vietnam (60.9%, a difference of 0.15%), Scotch-Irish (60.9%, a difference of 0.19%), Swiss (61.0%, a difference of 0.23%), and Korean (61.0%, a difference of 0.26%).
| Demographics | Rating | Rank | 2 or more Vehicles in Household |
| Europeans | 100.0 /100 | #18 | Exceptional 61.4% |
| Scottish | 100.0 /100 | #19 | Exceptional 61.2% |
| Sri Lankans | 100.0 /100 | #20 | Exceptional 61.0% |
| Koreans | 100.0 /100 | #21 | Exceptional 61.0% |
| Swiss | 100.0 /100 | #22 | Exceptional 61.0% |
| Scotch-Irish | 100.0 /100 | #23 | Exceptional 60.9% |
| Immigrants | Vietnam | 100.0 /100 | #24 | Exceptional 60.9% |
| Whites/Caucasians | 100.0 /100 | #25 | Exceptional 60.8% |
| Welsh | 100.0 /100 | #26 | Exceptional 60.8% |
| Assyrians/Chaldeans/Syriacs | 100.0 /100 | #27 | Exceptional 60.5% |
| Guamanians/Chamorros | 100.0 /100 | #28 | Exceptional 60.5% |
| Hawaiians | 100.0 /100 | #29 | Exceptional 60.4% |
| Finns | 100.0 /100 | #30 | Exceptional 60.3% |
| Spanish American Indians | 100.0 /100 | #31 | Exceptional 60.3% |
| Arapaho | 100.0 /100 | #32 | Exceptional 60.2% |
Demographics Similar to Immigrants from Indonesia by 2 or more Vehicles in Household
In terms of 2 or more vehicles in household, the demographic groups most similar to Immigrants from Indonesia are Immigrants from Bolivia (57.6%, a difference of 0.0%), Jordanian (57.6%, a difference of 0.0%), Immigrants from Korea (57.6%, a difference of 0.0%), Immigrants from Oceania (57.5%, a difference of 0.020%), and Immigrants from Netherlands (57.5%, a difference of 0.040%).
| Demographics | Rating | Rank | 2 or more Vehicles in Household |
| Slavs | 98.8 /100 | #97 | Exceptional 57.8% |
| Palestinians | 98.6 /100 | #98 | Exceptional 57.7% |
| Cajuns | 98.5 /100 | #99 | Exceptional 57.7% |
| Fijians | 98.4 /100 | #100 | Exceptional 57.6% |
| Lebanese | 98.3 /100 | #101 | Exceptional 57.6% |
| Immigrants | Bolivia | 98.2 /100 | #102 | Exceptional 57.6% |
| Jordanians | 98.2 /100 | #103 | Exceptional 57.6% |
| Immigrants | Indonesia | 98.2 /100 | #104 | Exceptional 57.6% |
| Immigrants | Korea | 98.2 /100 | #105 | Exceptional 57.6% |
| Immigrants | Oceania | 98.2 /100 | #106 | Exceptional 57.5% |
| Immigrants | Netherlands | 98.2 /100 | #107 | Exceptional 57.5% |
| Immigrants | Canada | 98.1 /100 | #108 | Exceptional 57.5% |
| Immigrants | North America | 98.1 /100 | #109 | Exceptional 57.5% |
| Japanese | 98.0 /100 | #110 | Exceptional 57.5% |
| Greeks | 98.0 /100 | #111 | Exceptional 57.5% |