White/Caucasian vs Immigrants from Indonesia Family Households with Children
COMPARE
White/Caucasian
Immigrants from Indonesia
Family Households with Children
Family Households with Children Comparison
Whites/Caucasians
Immigrants from Indonesia
27.4%
FAMILY HOUSEHOLDS WITH CHILDREN
50.0/ 100
METRIC RATING
174th/ 347
METRIC RANK
28.5%
FAMILY HOUSEHOLDS WITH CHILDREN
99.9/ 100
METRIC RATING
72nd/ 347
METRIC RANK
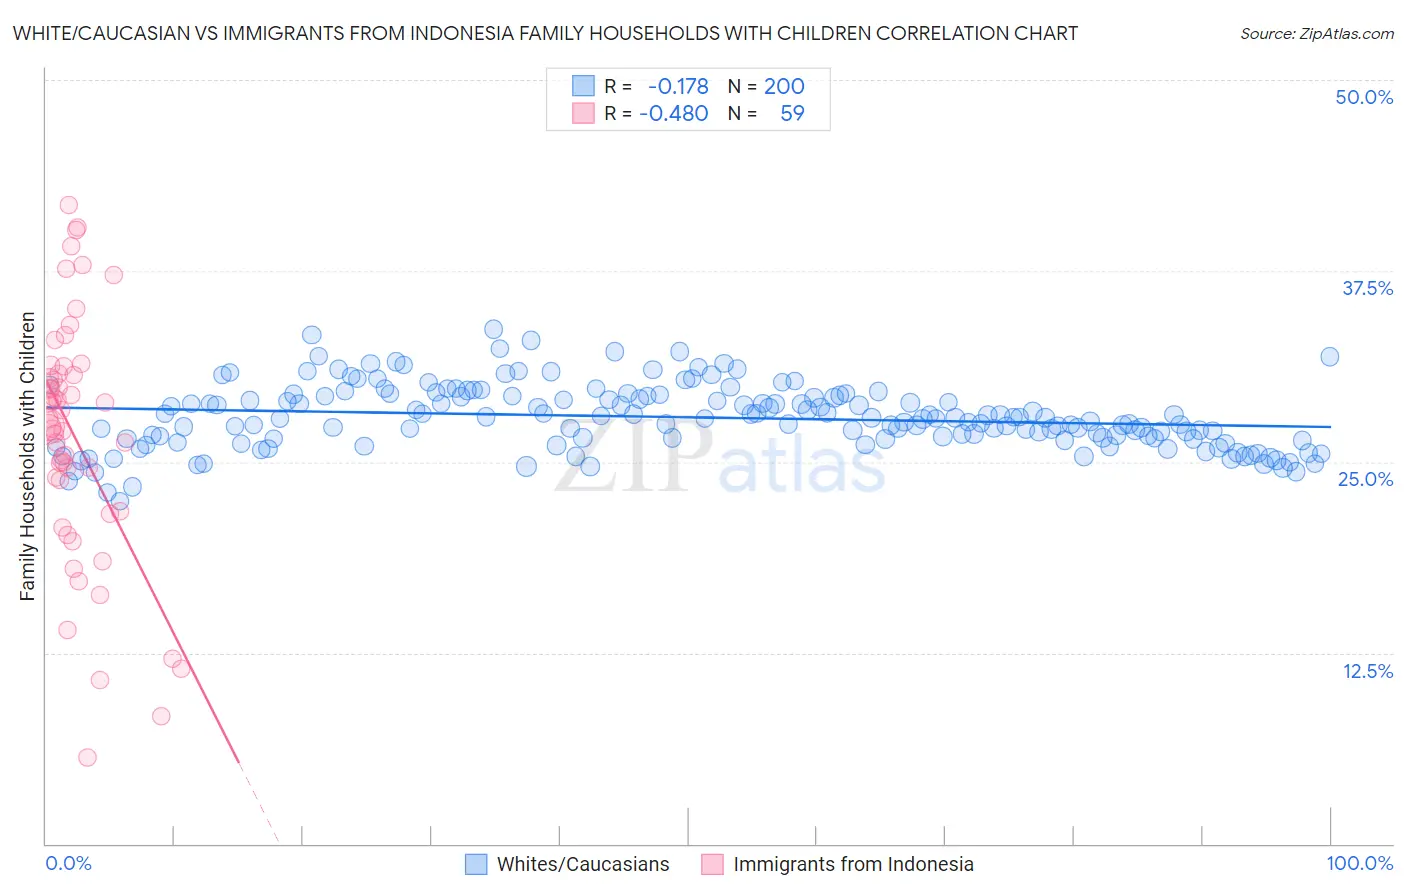
White/Caucasian vs Immigrants from Indonesia Family Households with Children Correlation Chart
The statistical analysis conducted on geographies consisting of 583,762,337 people shows a poor negative correlation between the proportion of Whites/Caucasians and percentage of family households with children in the United States with a correlation coefficient (R) of -0.178 and weighted average of 27.4%. Similarly, the statistical analysis conducted on geographies consisting of 215,654,509 people shows a moderate negative correlation between the proportion of Immigrants from Indonesia and percentage of family households with children in the United States with a correlation coefficient (R) of -0.480 and weighted average of 28.5%, a difference of 3.8%.
Family Households with Children Correlation Summary
| Measurement | White/Caucasian | Immigrants from Indonesia |
| Minimum | 22.4% | 5.7% |
| Maximum | 33.7% | 41.8% |
| Range | 11.3% | 36.1% |
| Mean | 27.9% | 26.6% |
| Median | 27.8% | 27.4% |
| Interquartile 25% (IQ1) | 26.5% | 21.7% |
| Interquartile 75% (IQ3) | 29.3% | 30.8% |
| Interquartile Range (IQR) | 2.8% | 9.0% |
| Standard Deviation (Sample) | 2.1% | 8.0% |
| Standard Deviation (Population) | 2.1% | 7.9% |
Similar Demographics by Family Households with Children
Demographics Similar to Whites/Caucasians by Family Households with Children
In terms of family households with children, the demographic groups most similar to Whites/Caucasians are British (27.4%, a difference of 0.0%), Immigrants from China (27.4%, a difference of 0.010%), Ugandan (27.4%, a difference of 0.020%), Spanish American (27.4%, a difference of 0.020%), and Immigrants from Argentina (27.5%, a difference of 0.050%).
| Demographics | Rating | Rank | Family Households with Children |
| Dominicans | 61.1 /100 | #167 | Good 27.5% |
| Immigrants | Kuwait | 60.9 /100 | #168 | Good 27.5% |
| Seminole | 56.9 /100 | #169 | Average 27.5% |
| Cherokee | 56.7 /100 | #170 | Average 27.5% |
| Blackfeet | 54.3 /100 | #171 | Average 27.5% |
| Israelis | 53.9 /100 | #172 | Average 27.5% |
| Immigrants | Argentina | 52.2 /100 | #173 | Average 27.5% |
| Whites/Caucasians | 50.0 /100 | #174 | Average 27.4% |
| British | 49.9 /100 | #175 | Average 27.4% |
| Immigrants | China | 49.6 /100 | #176 | Average 27.4% |
| Ugandans | 49.2 /100 | #177 | Average 27.4% |
| Spanish Americans | 48.9 /100 | #178 | Average 27.4% |
| Turks | 46.9 /100 | #179 | Average 27.4% |
| Immigrants | Turkey | 46.9 /100 | #180 | Average 27.4% |
| Aleuts | 46.7 /100 | #181 | Average 27.4% |
Demographics Similar to Immigrants from Indonesia by Family Households with Children
In terms of family households with children, the demographic groups most similar to Immigrants from Indonesia are Burmese (28.5%, a difference of 0.010%), Immigrants from Honduras (28.5%, a difference of 0.020%), Iraqi (28.5%, a difference of 0.030%), Laotian (28.5%, a difference of 0.040%), and Immigrants from Korea (28.5%, a difference of 0.080%).
| Demographics | Rating | Rank | Family Households with Children |
| Hondurans | 99.9 /100 | #65 | Exceptional 28.5% |
| Immigrants | Egypt | 99.9 /100 | #66 | Exceptional 28.5% |
| Ghanaians | 99.9 /100 | #67 | Exceptional 28.5% |
| Houma | 99.9 /100 | #68 | Exceptional 28.5% |
| Immigrants | Korea | 99.9 /100 | #69 | Exceptional 28.5% |
| Immigrants | Honduras | 99.9 /100 | #70 | Exceptional 28.5% |
| Burmese | 99.9 /100 | #71 | Exceptional 28.5% |
| Immigrants | Indonesia | 99.9 /100 | #72 | Exceptional 28.5% |
| Iraqis | 99.9 /100 | #73 | Exceptional 28.5% |
| Laotians | 99.9 /100 | #74 | Exceptional 28.5% |
| Immigrants | Jordan | 99.9 /100 | #75 | Exceptional 28.4% |
| Immigrants | Sri Lanka | 99.9 /100 | #76 | Exceptional 28.4% |
| Nigerians | 99.8 /100 | #77 | Exceptional 28.4% |
| Immigrants | Nepal | 99.8 /100 | #78 | Exceptional 28.4% |
| Immigrants | Iraq | 99.8 /100 | #79 | Exceptional 28.4% |