White/Caucasian vs Immigrants from Indonesia Vision Disability
COMPARE
White/Caucasian
Immigrants from Indonesia
Vision Disability
Vision Disability Comparison
Whites/Caucasians
Immigrants from Indonesia
2.4%
VISION DISABILITY
0.2/ 100
METRIC RATING
259th/ 347
METRIC RANK
2.0%
VISION DISABILITY
99.7/ 100
METRIC RATING
44th/ 347
METRIC RANK
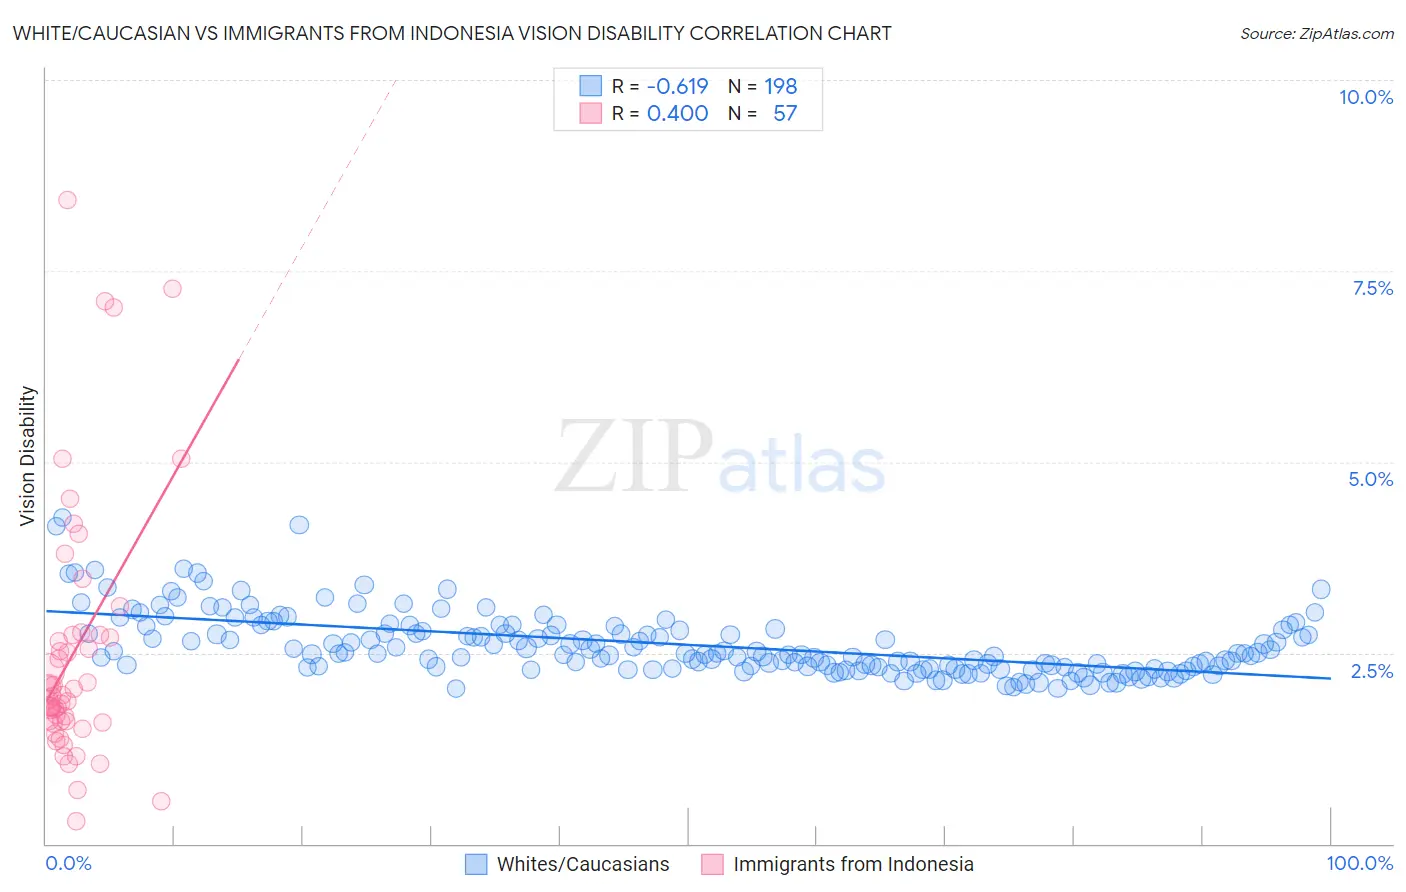
White/Caucasian vs Immigrants from Indonesia Vision Disability Correlation Chart
The statistical analysis conducted on geographies consisting of 580,529,348 people shows a significant negative correlation between the proportion of Whites/Caucasians and percentage of population with vision disability in the United States with a correlation coefficient (R) of -0.619 and weighted average of 2.4%. Similarly, the statistical analysis conducted on geographies consisting of 215,759,467 people shows a moderate positive correlation between the proportion of Immigrants from Indonesia and percentage of population with vision disability in the United States with a correlation coefficient (R) of 0.400 and weighted average of 2.0%, a difference of 20.7%.
Vision Disability Correlation Summary
| Measurement | White/Caucasian | Immigrants from Indonesia |
| Minimum | 2.0% | 0.29% |
| Maximum | 4.3% | 8.4% |
| Range | 2.2% | 8.1% |
| Mean | 2.6% | 2.5% |
| Median | 2.5% | 1.9% |
| Interquartile 25% (IQ1) | 2.3% | 1.6% |
| Interquartile 75% (IQ3) | 2.8% | 2.7% |
| Interquartile Range (IQR) | 0.50% | 1.1% |
| Standard Deviation (Sample) | 0.41% | 1.7% |
| Standard Deviation (Population) | 0.41% | 1.7% |
Similar Demographics by Vision Disability
Demographics Similar to Whites/Caucasians by Vision Disability
In terms of vision disability, the demographic groups most similar to Whites/Caucasians are British West Indian (2.4%, a difference of 0.010%), West Indian (2.4%, a difference of 0.040%), Immigrants from Haiti (2.4%, a difference of 0.12%), Belizean (2.4%, a difference of 0.17%), and Fijian (2.4%, a difference of 0.38%).
| Demographics | Rating | Rank | Vision Disability |
| Immigrants | Micronesia | 0.3 /100 | #252 | Tragic 2.4% |
| Japanese | 0.3 /100 | #253 | Tragic 2.4% |
| Haitians | 0.3 /100 | #254 | Tragic 2.4% |
| Immigrants | Guatemala | 0.3 /100 | #255 | Tragic 2.4% |
| Immigrants | Haiti | 0.2 /100 | #256 | Tragic 2.4% |
| West Indians | 0.2 /100 | #257 | Tragic 2.4% |
| British West Indians | 0.2 /100 | #258 | Tragic 2.4% |
| Whites/Caucasians | 0.2 /100 | #259 | Tragic 2.4% |
| Belizeans | 0.2 /100 | #260 | Tragic 2.4% |
| Fijians | 0.1 /100 | #261 | Tragic 2.4% |
| Jamaicans | 0.1 /100 | #262 | Tragic 2.4% |
| Immigrants | Belize | 0.1 /100 | #263 | Tragic 2.4% |
| Immigrants | Liberia | 0.1 /100 | #264 | Tragic 2.4% |
| Immigrants | Jamaica | 0.1 /100 | #265 | Tragic 2.4% |
| Mexican American Indians | 0.1 /100 | #266 | Tragic 2.4% |
Demographics Similar to Immigrants from Indonesia by Vision Disability
In terms of vision disability, the demographic groups most similar to Immigrants from Indonesia are Eastern European (2.0%, a difference of 0.020%), Ethiopian (2.0%, a difference of 0.030%), Immigrants from Sweden (2.0%, a difference of 0.070%), Immigrants from Ethiopia (2.0%, a difference of 0.090%), and Immigrants from Bulgaria (2.0%, a difference of 0.090%).
| Demographics | Rating | Rank | Vision Disability |
| Bhutanese | 99.8 /100 | #37 | Exceptional 2.0% |
| Immigrants | Kuwait | 99.8 /100 | #38 | Exceptional 2.0% |
| Zimbabweans | 99.7 /100 | #39 | Exceptional 2.0% |
| Immigrants | Ireland | 99.7 /100 | #40 | Exceptional 2.0% |
| Cypriots | 99.7 /100 | #41 | Exceptional 2.0% |
| Immigrants | Ethiopia | 99.7 /100 | #42 | Exceptional 2.0% |
| Eastern Europeans | 99.7 /100 | #43 | Exceptional 2.0% |
| Immigrants | Indonesia | 99.7 /100 | #44 | Exceptional 2.0% |
| Ethiopians | 99.7 /100 | #45 | Exceptional 2.0% |
| Immigrants | Sweden | 99.7 /100 | #46 | Exceptional 2.0% |
| Immigrants | Bulgaria | 99.7 /100 | #47 | Exceptional 2.0% |
| Israelis | 99.6 /100 | #48 | Exceptional 2.0% |
| Latvians | 99.5 /100 | #49 | Exceptional 2.0% |
| Afghans | 99.5 /100 | #50 | Exceptional 2.0% |
| Tongans | 99.5 /100 | #51 | Exceptional 2.0% |