White/Caucasian vs Immigrants from Indonesia Unemployment Among Ages 65 to 74 years
COMPARE
White/Caucasian
Immigrants from Indonesia
Unemployment Among Ages 65 to 74 years
Unemployment Among Ages 65 to 74 years Comparison
Whites/Caucasians
Immigrants from Indonesia
5.4%
UNEMPLOYMENT AMONG AGES 65 TO 74 YEARS
57.2/ 100
METRIC RATING
168th/ 347
METRIC RANK
5.3%
UNEMPLOYMENT AMONG AGES 65 TO 74 YEARS
72.9/ 100
METRIC RATING
151st/ 347
METRIC RANK
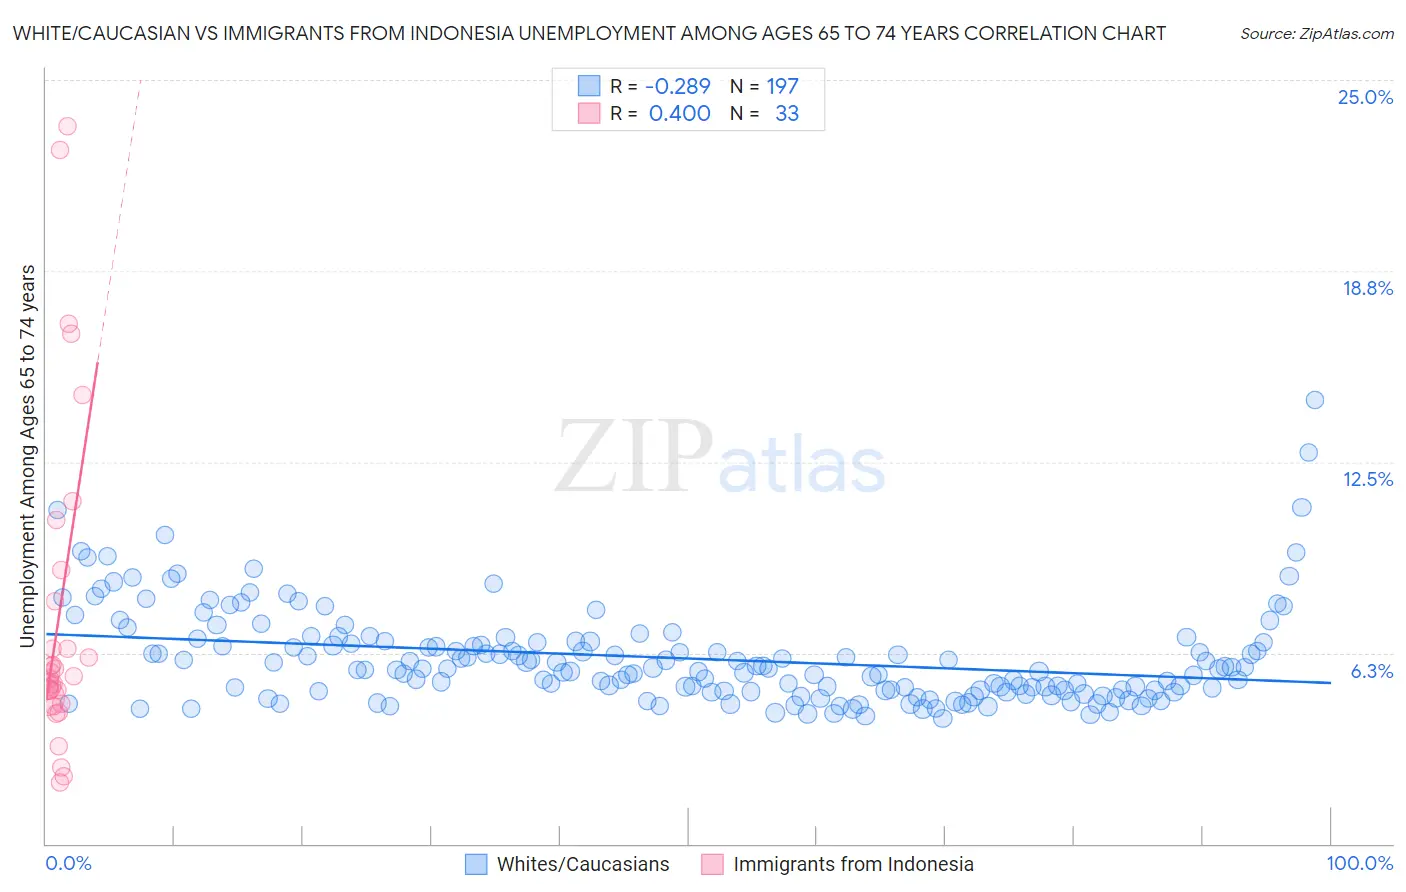
White/Caucasian vs Immigrants from Indonesia Unemployment Among Ages 65 to 74 years Correlation Chart
The statistical analysis conducted on geographies consisting of 448,882,925 people shows a weak negative correlation between the proportion of Whites/Caucasians and unemployment rate among population between the ages 65 and 74 in the United States with a correlation coefficient (R) of -0.289 and weighted average of 5.4%. Similarly, the statistical analysis conducted on geographies consisting of 203,239,136 people shows a moderate positive correlation between the proportion of Immigrants from Indonesia and unemployment rate among population between the ages 65 and 74 in the United States with a correlation coefficient (R) of 0.400 and weighted average of 5.3%, a difference of 0.59%.
Unemployment Among Ages 65 to 74 years Correlation Summary
| Measurement | White/Caucasian | Immigrants from Indonesia |
| Minimum | 4.1% | 2.0% |
| Maximum | 14.5% | 23.5% |
| Range | 10.4% | 21.5% |
| Mean | 6.1% | 7.5% |
| Median | 5.7% | 5.5% |
| Interquartile 25% (IQ1) | 5.0% | 4.7% |
| Interquartile 75% (IQ3) | 6.6% | 8.4% |
| Interquartile Range (IQR) | 1.6% | 3.8% |
| Standard Deviation (Sample) | 1.6% | 5.4% |
| Standard Deviation (Population) | 1.6% | 5.4% |
Demographics Similar to Whites/Caucasians and Immigrants from Indonesia by Unemployment Among Ages 65 to 74 years
In terms of unemployment among ages 65 to 74 years, the demographic groups most similar to Whites/Caucasians are Laotian (5.4%, a difference of 0.050%), Slovak (5.3%, a difference of 0.10%), Indian (Asian) (5.3%, a difference of 0.10%), Immigrants from Bosnia and Herzegovina (5.3%, a difference of 0.11%), and Immigrants from Philippines (5.3%, a difference of 0.14%). Similarly, the demographic groups most similar to Immigrants from Indonesia are Immigrants from Poland (5.3%, a difference of 0.010%), Spanish (5.3%, a difference of 0.010%), Immigrants from Romania (5.3%, a difference of 0.020%), Immigrants from Cabo Verde (5.3%, a difference of 0.020%), and Polish (5.3%, a difference of 0.020%).
| Demographics | Rating | Rank | Unemployment Among Ages 65 to 74 years |
| Immigrants | Romania | 73.5 /100 | #149 | Good 5.3% |
| Immigrants | Poland | 73.2 /100 | #150 | Good 5.3% |
| Immigrants | Indonesia | 72.9 /100 | #151 | Good 5.3% |
| Spanish | 72.6 /100 | #152 | Good 5.3% |
| Immigrants | Cabo Verde | 72.5 /100 | #153 | Good 5.3% |
| Poles | 72.4 /100 | #154 | Good 5.3% |
| Immigrants | Cameroon | 72.1 /100 | #155 | Good 5.3% |
| Dutch | 72.0 /100 | #156 | Good 5.3% |
| Immigrants | Eastern Europe | 71.5 /100 | #157 | Good 5.3% |
| Immigrants | France | 71.0 /100 | #158 | Good 5.3% |
| Immigrants | Czechoslovakia | 66.3 /100 | #159 | Good 5.3% |
| Bangladeshis | 65.8 /100 | #160 | Good 5.3% |
| Immigrants | Italy | 63.7 /100 | #161 | Good 5.3% |
| Immigrants | Eastern Asia | 62.5 /100 | #162 | Good 5.3% |
| Mongolians | 62.3 /100 | #163 | Good 5.3% |
| Immigrants | Philippines | 61.2 /100 | #164 | Good 5.3% |
| Immigrants | Bosnia and Herzegovina | 60.2 /100 | #165 | Good 5.3% |
| Slovaks | 60.0 /100 | #166 | Good 5.3% |
| Indians (Asian) | 59.9 /100 | #167 | Average 5.3% |
| Whites/Caucasians | 57.2 /100 | #168 | Average 5.4% |
| Laotians | 55.7 /100 | #169 | Average 5.4% |