West Indian vs Delaware In Labor Force | Age 20-64
COMPARE
West Indian
Delaware
In Labor Force | Age 20-64
In Labor Force | Age 20-64 Comparison
West Indians
Delaware
78.3%
IN LABOR FORCE | AGE 20-64
0.0/ 100
METRIC RATING
268th/ 347
METRIC RANK
77.8%
IN LABOR FORCE | AGE 20-64
0.0/ 100
METRIC RATING
293rd/ 347
METRIC RANK
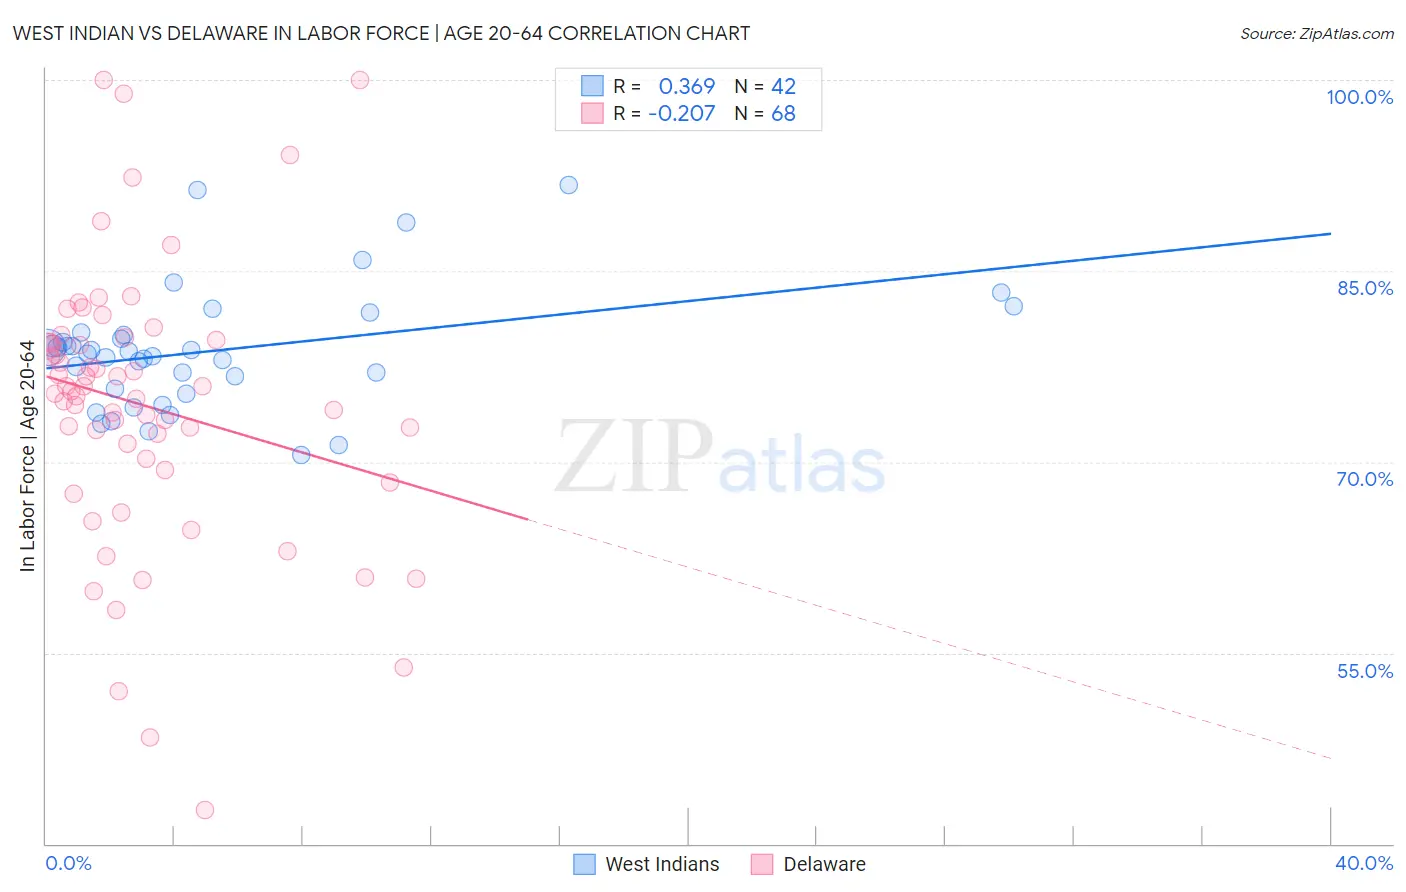
West Indian vs Delaware In Labor Force | Age 20-64 Correlation Chart
The statistical analysis conducted on geographies consisting of 254,049,696 people shows a mild positive correlation between the proportion of West Indians and labor force participation rate among population between the ages 20 and 64 in the United States with a correlation coefficient (R) of 0.369 and weighted average of 78.3%. Similarly, the statistical analysis conducted on geographies consisting of 96,240,999 people shows a weak negative correlation between the proportion of Delaware and labor force participation rate among population between the ages 20 and 64 in the United States with a correlation coefficient (R) of -0.207 and weighted average of 77.8%, a difference of 0.72%.
In Labor Force | Age 20-64 Correlation Summary
| Measurement | West Indian | Delaware |
| Minimum | 70.5% | 42.7% |
| Maximum | 91.8% | 100.0% |
| Range | 21.3% | 57.3% |
| Mean | 78.7% | 74.5% |
| Median | 78.6% | 75.4% |
| Interquartile 25% (IQ1) | 75.7% | 69.8% |
| Interquartile 75% (IQ3) | 80.0% | 79.5% |
| Interquartile Range (IQR) | 4.3% | 9.7% |
| Standard Deviation (Sample) | 4.7% | 10.9% |
| Standard Deviation (Population) | 4.7% | 10.8% |
Similar Demographics by In Labor Force | Age 20-64
Demographics Similar to West Indians by In Labor Force | Age 20-64
In terms of in labor force | age 20-64, the demographic groups most similar to West Indians are U.S. Virgin Islander (78.4%, a difference of 0.020%), Bahamian (78.4%, a difference of 0.040%), British West Indian (78.4%, a difference of 0.050%), Immigrants from Barbados (78.3%, a difference of 0.050%), and Scotch-Irish (78.3%, a difference of 0.080%).
| Demographics | Rating | Rank | In Labor Force | Age 20-64 |
| Whites/Caucasians | 0.2 /100 | #261 | Tragic 78.5% |
| Fijians | 0.1 /100 | #262 | Tragic 78.4% |
| Pennsylvania Germans | 0.1 /100 | #263 | Tragic 78.4% |
| Spaniards | 0.1 /100 | #264 | Tragic 78.4% |
| British West Indians | 0.1 /100 | #265 | Tragic 78.4% |
| Bahamians | 0.1 /100 | #266 | Tragic 78.4% |
| U.S. Virgin Islanders | 0.1 /100 | #267 | Tragic 78.4% |
| West Indians | 0.0 /100 | #268 | Tragic 78.3% |
| Immigrants | Barbados | 0.0 /100 | #269 | Tragic 78.3% |
| Scotch-Irish | 0.0 /100 | #270 | Tragic 78.3% |
| Immigrants | Latin America | 0.0 /100 | #271 | Tragic 78.3% |
| Marshallese | 0.0 /100 | #272 | Tragic 78.3% |
| French American Indians | 0.0 /100 | #273 | Tragic 78.2% |
| Aleuts | 0.0 /100 | #274 | Tragic 78.2% |
| Spanish | 0.0 /100 | #275 | Tragic 78.2% |
Demographics Similar to Delaware by In Labor Force | Age 20-64
In terms of in labor force | age 20-64, the demographic groups most similar to Delaware are Immigrants from the Azores (77.8%, a difference of 0.040%), Spanish American (77.8%, a difference of 0.090%), Immigrants from Central America (77.7%, a difference of 0.090%), Immigrants from Grenada (77.7%, a difference of 0.12%), and Immigrants from Bangladesh (77.9%, a difference of 0.14%).
| Demographics | Rating | Rank | In Labor Force | Age 20-64 |
| Immigrants | Belize | 0.0 /100 | #286 | Tragic 78.0% |
| Vietnamese | 0.0 /100 | #287 | Tragic 78.0% |
| Hmong | 0.0 /100 | #288 | Tragic 77.9% |
| Africans | 0.0 /100 | #289 | Tragic 77.9% |
| Immigrants | Bangladesh | 0.0 /100 | #290 | Tragic 77.9% |
| Spanish Americans | 0.0 /100 | #291 | Tragic 77.8% |
| Immigrants | Azores | 0.0 /100 | #292 | Tragic 77.8% |
| Delaware | 0.0 /100 | #293 | Tragic 77.8% |
| Immigrants | Central America | 0.0 /100 | #294 | Tragic 77.7% |
| Immigrants | Grenada | 0.0 /100 | #295 | Tragic 77.7% |
| Immigrants | Dominican Republic | 0.0 /100 | #296 | Tragic 77.7% |
| Dominicans | 0.0 /100 | #297 | Tragic 77.7% |
| Cree | 0.0 /100 | #298 | Tragic 77.7% |
| Hispanics or Latinos | 0.0 /100 | #299 | Tragic 77.6% |
| Spanish American Indians | 0.0 /100 | #300 | Tragic 77.6% |