Vietnamese vs Scottish 4 or more Vehicles in Household
COMPARE
Vietnamese
Scottish
4 or more Vehicles in Household
4 or more Vehicles in Household Comparison
Vietnamese
Scottish
3.9%
4 OR MORE VEHICLES IN HOUSEHOLD
0.0/ 100
METRIC RATING
337th/ 347
METRIC RANK
7.4%
4 OR MORE VEHICLES IN HOUSEHOLD
99.9/ 100
METRIC RATING
70th/ 347
METRIC RANK
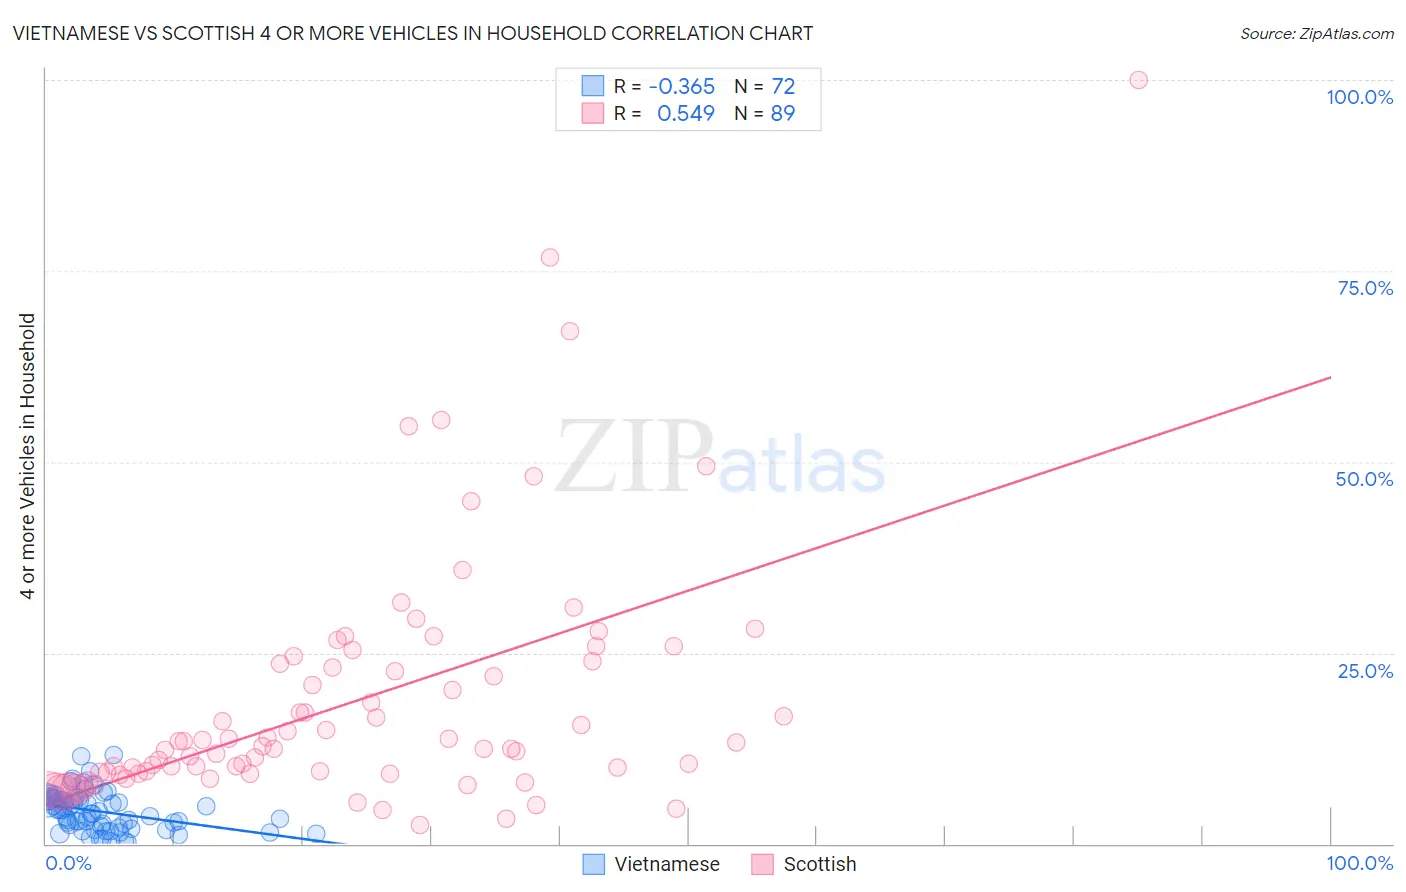
Vietnamese vs Scottish 4 or more Vehicles in Household Correlation Chart
The statistical analysis conducted on geographies consisting of 169,814,995 people shows a mild negative correlation between the proportion of Vietnamese and percentage of households with 4 or more vehicles available in the United States with a correlation coefficient (R) of -0.365 and weighted average of 3.9%. Similarly, the statistical analysis conducted on geographies consisting of 563,736,274 people shows a substantial positive correlation between the proportion of Scottish and percentage of households with 4 or more vehicles available in the United States with a correlation coefficient (R) of 0.549 and weighted average of 7.4%, a difference of 92.0%.
4 or more Vehicles in Household Correlation Summary
| Measurement | Vietnamese | Scottish |
| Minimum | 0.12% | 2.5% |
| Maximum | 11.6% | 100.0% |
| Range | 11.5% | 97.5% |
| Mean | 4.2% | 18.7% |
| Median | 4.1% | 12.8% |
| Interquartile 25% (IQ1) | 2.2% | 9.3% |
| Interquartile 75% (IQ3) | 5.8% | 23.8% |
| Interquartile Range (IQR) | 3.6% | 14.5% |
| Standard Deviation (Sample) | 2.5% | 16.4% |
| Standard Deviation (Population) | 2.5% | 16.3% |
Similar Demographics by 4 or more Vehicles in Household
Demographics Similar to Vietnamese by 4 or more Vehicles in Household
In terms of 4 or more vehicles in household, the demographic groups most similar to Vietnamese are Immigrants from Bangladesh (3.9%, a difference of 0.51%), Barbadian (3.9%, a difference of 0.69%), Immigrants from Cabo Verde (3.8%, a difference of 1.8%), Immigrants from Trinidad and Tobago (4.1%, a difference of 5.9%), and Immigrants from Albania (4.1%, a difference of 6.1%).
| Demographics | Rating | Rank | 4 or more Vehicles in Household |
| Immigrants | Ecuador | 0.0 /100 | #330 | Tragic 4.2% |
| West Indians | 0.0 /100 | #331 | Tragic 4.2% |
| Immigrants | Dominica | 0.0 /100 | #332 | Tragic 4.2% |
| Immigrants | Albania | 0.0 /100 | #333 | Tragic 4.1% |
| Immigrants | Trinidad and Tobago | 0.0 /100 | #334 | Tragic 4.1% |
| Barbadians | 0.0 /100 | #335 | Tragic 3.9% |
| Immigrants | Bangladesh | 0.0 /100 | #336 | Tragic 3.9% |
| Vietnamese | 0.0 /100 | #337 | Tragic 3.9% |
| Immigrants | Cabo Verde | 0.0 /100 | #338 | Tragic 3.8% |
| Immigrants | Uzbekistan | 0.0 /100 | #339 | Tragic 3.6% |
| Immigrants | Barbados | 0.0 /100 | #340 | Tragic 3.6% |
| Dominicans | 0.0 /100 | #341 | Tragic 3.5% |
| Guyanese | 0.0 /100 | #342 | Tragic 3.5% |
| British West Indians | 0.0 /100 | #343 | Tragic 3.5% |
| Immigrants | Guyana | 0.0 /100 | #344 | Tragic 3.4% |
Demographics Similar to Scottish by 4 or more Vehicles in Household
In terms of 4 or more vehicles in household, the demographic groups most similar to Scottish are German (7.5%, a difference of 0.070%), Chickasaw (7.4%, a difference of 0.13%), Scotch-Irish (7.4%, a difference of 0.43%), Portuguese (7.4%, a difference of 0.52%), and Welsh (7.5%, a difference of 0.67%).
| Demographics | Rating | Rank | 4 or more Vehicles in Household |
| Immigrants | Micronesia | 100.0 /100 | #63 | Exceptional 7.6% |
| Bangladeshis | 100.0 /100 | #64 | Exceptional 7.6% |
| Immigrants | Azores | 100.0 /100 | #65 | Exceptional 7.5% |
| Immigrants | Taiwan | 99.9 /100 | #66 | Exceptional 7.5% |
| Americans | 99.9 /100 | #67 | Exceptional 7.5% |
| Welsh | 99.9 /100 | #68 | Exceptional 7.5% |
| Germans | 99.9 /100 | #69 | Exceptional 7.5% |
| Scottish | 99.9 /100 | #70 | Exceptional 7.4% |
| Chickasaw | 99.9 /100 | #71 | Exceptional 7.4% |
| Scotch-Irish | 99.9 /100 | #72 | Exceptional 7.4% |
| Portuguese | 99.9 /100 | #73 | Exceptional 7.4% |
| Icelanders | 99.9 /100 | #74 | Exceptional 7.4% |
| Immigrants | Cambodia | 99.9 /100 | #75 | Exceptional 7.4% |
| Laotians | 99.9 /100 | #76 | Exceptional 7.4% |
| Apache | 99.9 /100 | #77 | Exceptional 7.4% |