Vietnamese vs Costa Rican 4 or more Vehicles in Household
COMPARE
Vietnamese
Costa Rican
4 or more Vehicles in Household
4 or more Vehicles in Household Comparison
Vietnamese
Costa Ricans
3.9%
4 OR MORE VEHICLES IN HOUSEHOLD
0.0/ 100
METRIC RATING
337th/ 347
METRIC RANK
6.8%
4 OR MORE VEHICLES IN HOUSEHOLD
95.5/ 100
METRIC RATING
119th/ 347
METRIC RANK
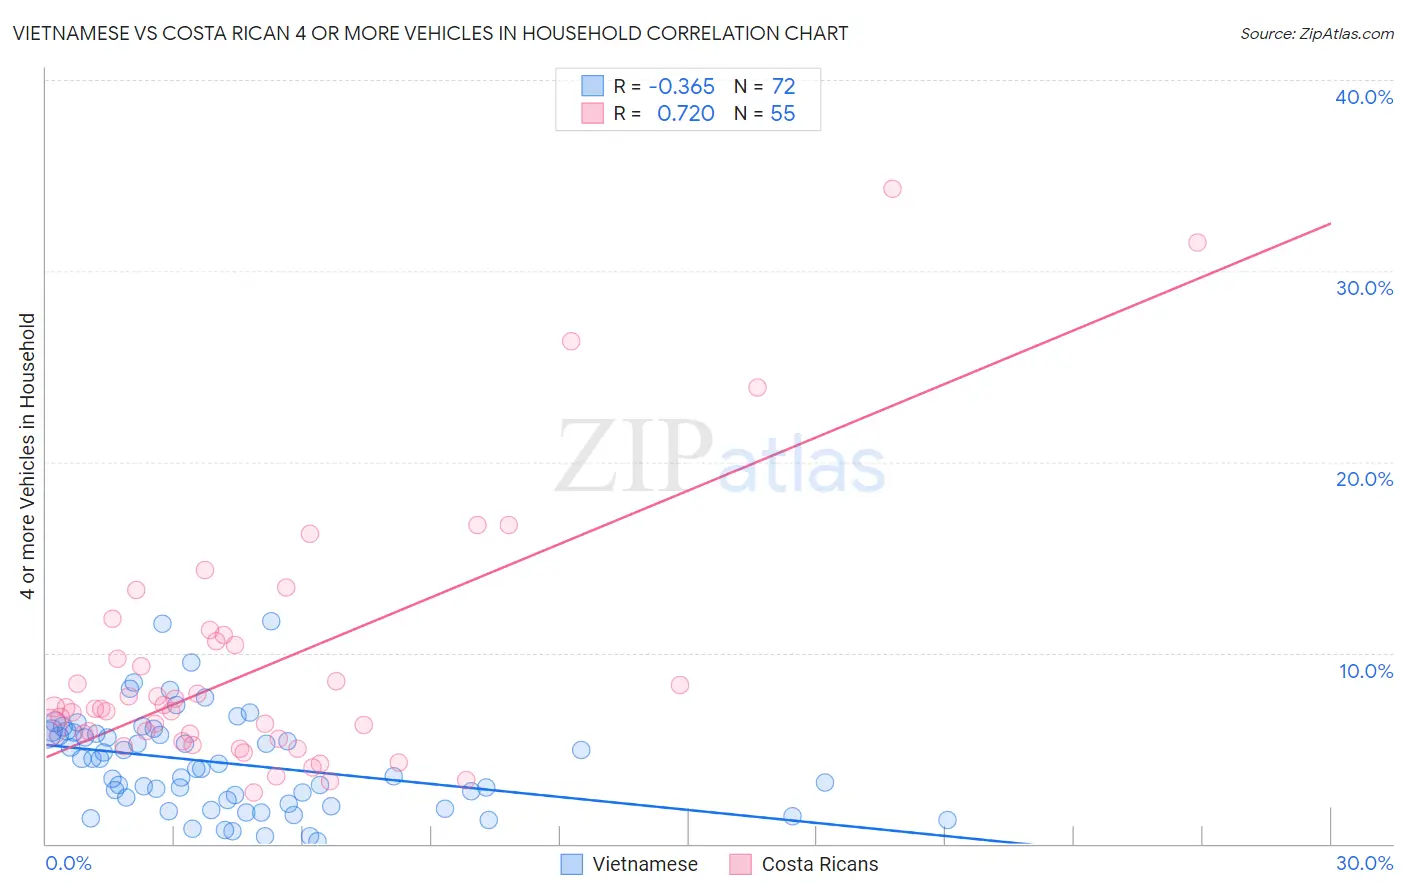
Vietnamese vs Costa Rican 4 or more Vehicles in Household Correlation Chart
The statistical analysis conducted on geographies consisting of 169,814,995 people shows a mild negative correlation between the proportion of Vietnamese and percentage of households with 4 or more vehicles available in the United States with a correlation coefficient (R) of -0.365 and weighted average of 3.9%. Similarly, the statistical analysis conducted on geographies consisting of 252,442,983 people shows a strong positive correlation between the proportion of Costa Ricans and percentage of households with 4 or more vehicles available in the United States with a correlation coefficient (R) of 0.720 and weighted average of 6.8%, a difference of 75.8%.
4 or more Vehicles in Household Correlation Summary
| Measurement | Vietnamese | Costa Rican |
| Minimum | 0.12% | 2.7% |
| Maximum | 11.6% | 34.3% |
| Range | 11.5% | 31.6% |
| Mean | 4.2% | 9.3% |
| Median | 4.1% | 7.1% |
| Interquartile 25% (IQ1) | 2.2% | 5.5% |
| Interquartile 75% (IQ3) | 5.8% | 10.6% |
| Interquartile Range (IQR) | 3.6% | 5.1% |
| Standard Deviation (Sample) | 2.5% | 6.6% |
| Standard Deviation (Population) | 2.5% | 6.5% |
Similar Demographics by 4 or more Vehicles in Household
Demographics Similar to Vietnamese by 4 or more Vehicles in Household
In terms of 4 or more vehicles in household, the demographic groups most similar to Vietnamese are Immigrants from Bangladesh (3.9%, a difference of 0.51%), Barbadian (3.9%, a difference of 0.69%), Immigrants from Cabo Verde (3.8%, a difference of 1.8%), Immigrants from Trinidad and Tobago (4.1%, a difference of 5.9%), and Immigrants from Albania (4.1%, a difference of 6.1%).
| Demographics | Rating | Rank | 4 or more Vehicles in Household |
| Immigrants | Ecuador | 0.0 /100 | #330 | Tragic 4.2% |
| West Indians | 0.0 /100 | #331 | Tragic 4.2% |
| Immigrants | Dominica | 0.0 /100 | #332 | Tragic 4.2% |
| Immigrants | Albania | 0.0 /100 | #333 | Tragic 4.1% |
| Immigrants | Trinidad and Tobago | 0.0 /100 | #334 | Tragic 4.1% |
| Barbadians | 0.0 /100 | #335 | Tragic 3.9% |
| Immigrants | Bangladesh | 0.0 /100 | #336 | Tragic 3.9% |
| Vietnamese | 0.0 /100 | #337 | Tragic 3.9% |
| Immigrants | Cabo Verde | 0.0 /100 | #338 | Tragic 3.8% |
| Immigrants | Uzbekistan | 0.0 /100 | #339 | Tragic 3.6% |
| Immigrants | Barbados | 0.0 /100 | #340 | Tragic 3.6% |
| Dominicans | 0.0 /100 | #341 | Tragic 3.5% |
| Guyanese | 0.0 /100 | #342 | Tragic 3.5% |
| British West Indians | 0.0 /100 | #343 | Tragic 3.5% |
| Immigrants | Guyana | 0.0 /100 | #344 | Tragic 3.4% |
Demographics Similar to Costa Ricans by 4 or more Vehicles in Household
In terms of 4 or more vehicles in household, the demographic groups most similar to Costa Ricans are Burmese (6.8%, a difference of 0.11%), French American Indian (6.8%, a difference of 0.11%), Immigrants from Guatemala (6.8%, a difference of 0.13%), Comanche (6.8%, a difference of 0.36%), and Tlingit-Haida (6.8%, a difference of 0.39%).
| Demographics | Rating | Rank | 4 or more Vehicles in Household |
| Hopi | 97.0 /100 | #112 | Exceptional 6.9% |
| Canadians | 96.4 /100 | #113 | Exceptional 6.9% |
| Bolivians | 96.3 /100 | #114 | Exceptional 6.8% |
| Tlingit-Haida | 96.2 /100 | #115 | Exceptional 6.8% |
| Immigrants | Guatemala | 95.8 /100 | #116 | Exceptional 6.8% |
| Burmese | 95.7 /100 | #117 | Exceptional 6.8% |
| French American Indians | 95.7 /100 | #118 | Exceptional 6.8% |
| Costa Ricans | 95.5 /100 | #119 | Exceptional 6.8% |
| Comanche | 94.8 /100 | #120 | Exceptional 6.8% |
| Immigrants | Germany | 94.7 /100 | #121 | Exceptional 6.8% |
| Immigrants | Nicaragua | 94.7 /100 | #122 | Exceptional 6.8% |
| Immigrants | Immigrants | 94.6 /100 | #123 | Exceptional 6.8% |
| Immigrants | Asia | 94.4 /100 | #124 | Exceptional 6.8% |
| Austrians | 94.1 /100 | #125 | Exceptional 6.8% |
| Belgians | 94.1 /100 | #126 | Exceptional 6.8% |