Vietnamese vs Scottish Single Mother Poverty
COMPARE
Vietnamese
Scottish
Single Mother Poverty
Single Mother Poverty Comparison
Vietnamese
Scottish
30.9%
SINGLE MOTHER POVERTY
0.7/ 100
METRIC RATING
250th/ 347
METRIC RANK
30.1%
SINGLE MOTHER POVERTY
6.0/ 100
METRIC RATING
226th/ 347
METRIC RANK
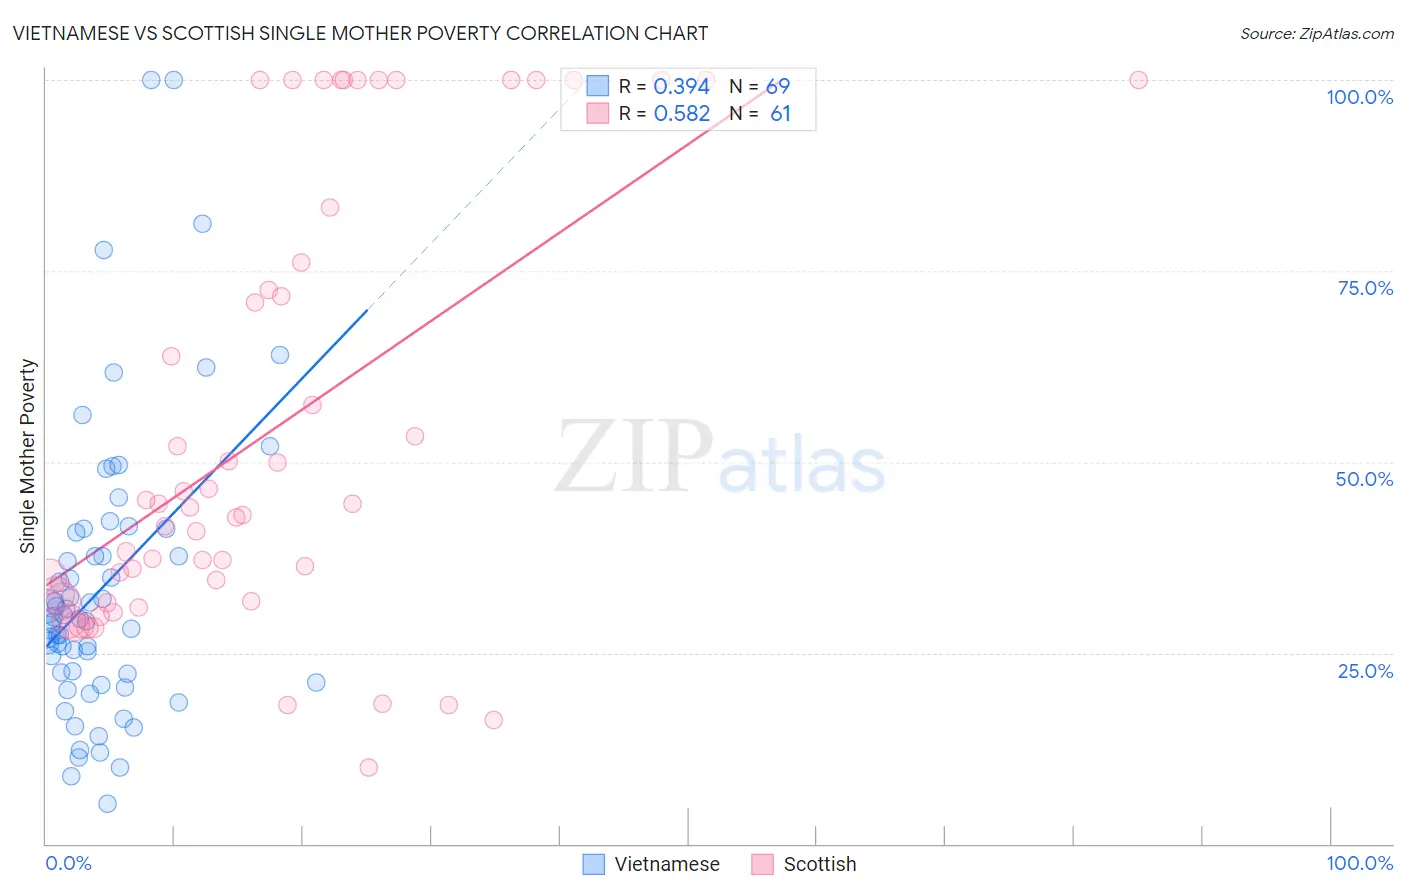
Vietnamese vs Scottish Single Mother Poverty Correlation Chart
The statistical analysis conducted on geographies consisting of 168,932,056 people shows a mild positive correlation between the proportion of Vietnamese and poverty level among single mothers in the United States with a correlation coefficient (R) of 0.394 and weighted average of 30.9%. Similarly, the statistical analysis conducted on geographies consisting of 539,065,597 people shows a substantial positive correlation between the proportion of Scottish and poverty level among single mothers in the United States with a correlation coefficient (R) of 0.582 and weighted average of 30.1%, a difference of 2.5%.
Single Mother Poverty Correlation Summary
| Measurement | Vietnamese | Scottish |
| Minimum | 5.3% | 10.0% |
| Maximum | 100.0% | 100.0% |
| Range | 94.7% | 90.0% |
| Mean | 33.6% | 54.2% |
| Median | 29.4% | 44.1% |
| Interquartile 25% (IQ1) | 21.7% | 31.8% |
| Interquartile 75% (IQ3) | 41.0% | 79.8% |
| Interquartile Range (IQR) | 19.2% | 48.0% |
| Standard Deviation (Sample) | 19.1% | 28.9% |
| Standard Deviation (Population) | 19.0% | 28.6% |
Similar Demographics by Single Mother Poverty
Demographics Similar to Vietnamese by Single Mother Poverty
In terms of single mother poverty, the demographic groups most similar to Vietnamese are Tlingit-Haida (30.9%, a difference of 0.12%), Alaska Native (30.9%, a difference of 0.13%), Cape Verdean (30.8%, a difference of 0.15%), Celtic (30.9%, a difference of 0.16%), and French Canadian (30.8%, a difference of 0.22%).
| Demographics | Rating | Rank | Single Mother Poverty |
| Bermudans | 1.6 /100 | #243 | Tragic 30.6% |
| French | 1.3 /100 | #244 | Tragic 30.7% |
| Barbadians | 1.3 /100 | #245 | Tragic 30.7% |
| Ecuadorians | 0.9 /100 | #246 | Tragic 30.8% |
| West Indians | 0.9 /100 | #247 | Tragic 30.8% |
| French Canadians | 0.9 /100 | #248 | Tragic 30.8% |
| Cape Verdeans | 0.8 /100 | #249 | Tragic 30.8% |
| Vietnamese | 0.7 /100 | #250 | Tragic 30.9% |
| Tlingit-Haida | 0.6 /100 | #251 | Tragic 30.9% |
| Alaska Natives | 0.6 /100 | #252 | Tragic 30.9% |
| Celtics | 0.6 /100 | #253 | Tragic 30.9% |
| Senegalese | 0.5 /100 | #254 | Tragic 31.0% |
| Belizeans | 0.5 /100 | #255 | Tragic 31.0% |
| Immigrants | West Indies | 0.4 /100 | #256 | Tragic 31.1% |
| Immigrants | Bahamas | 0.4 /100 | #257 | Tragic 31.1% |
Demographics Similar to Scottish by Single Mother Poverty
In terms of single mother poverty, the demographic groups most similar to Scottish are Immigrants from Liberia (30.1%, a difference of 0.030%), Spanish (30.1%, a difference of 0.060%), Immigrants from Sudan (30.1%, a difference of 0.090%), Spaniard (30.2%, a difference of 0.14%), and Immigrants from Cuba (30.1%, a difference of 0.16%).
| Demographics | Rating | Rank | Single Mother Poverty |
| Finns | 9.3 /100 | #219 | Tragic 30.0% |
| Germans | 8.8 /100 | #220 | Tragic 30.0% |
| Immigrants | Eritrea | 7.7 /100 | #221 | Tragic 30.0% |
| Sudanese | 7.6 /100 | #222 | Tragic 30.0% |
| Immigrants | Cuba | 6.9 /100 | #223 | Tragic 30.1% |
| Immigrants | Sudan | 6.5 /100 | #224 | Tragic 30.1% |
| Spanish | 6.3 /100 | #225 | Tragic 30.1% |
| Scottish | 6.0 /100 | #226 | Tragic 30.1% |
| Immigrants | Liberia | 5.9 /100 | #227 | Tragic 30.1% |
| Spaniards | 5.4 /100 | #228 | Tragic 30.2% |
| Immigrants | Barbados | 5.0 /100 | #229 | Tragic 30.2% |
| English | 4.8 /100 | #230 | Tragic 30.2% |
| Dutch | 4.3 /100 | #231 | Tragic 30.2% |
| Alaskan Athabascans | 4.1 /100 | #232 | Tragic 30.3% |
| Immigrants | Middle Africa | 3.5 /100 | #233 | Tragic 30.3% |