Immigrants from Denmark vs Scottish 4 or more Vehicles in Household
COMPARE
Immigrants from Denmark
Scottish
4 or more Vehicles in Household
4 or more Vehicles in Household Comparison
Immigrants from Denmark
Scottish
6.4%
4 OR MORE VEHICLES IN HOUSEHOLD
57.8/ 100
METRIC RATING
166th/ 347
METRIC RANK
7.4%
4 OR MORE VEHICLES IN HOUSEHOLD
99.9/ 100
METRIC RATING
70th/ 347
METRIC RANK
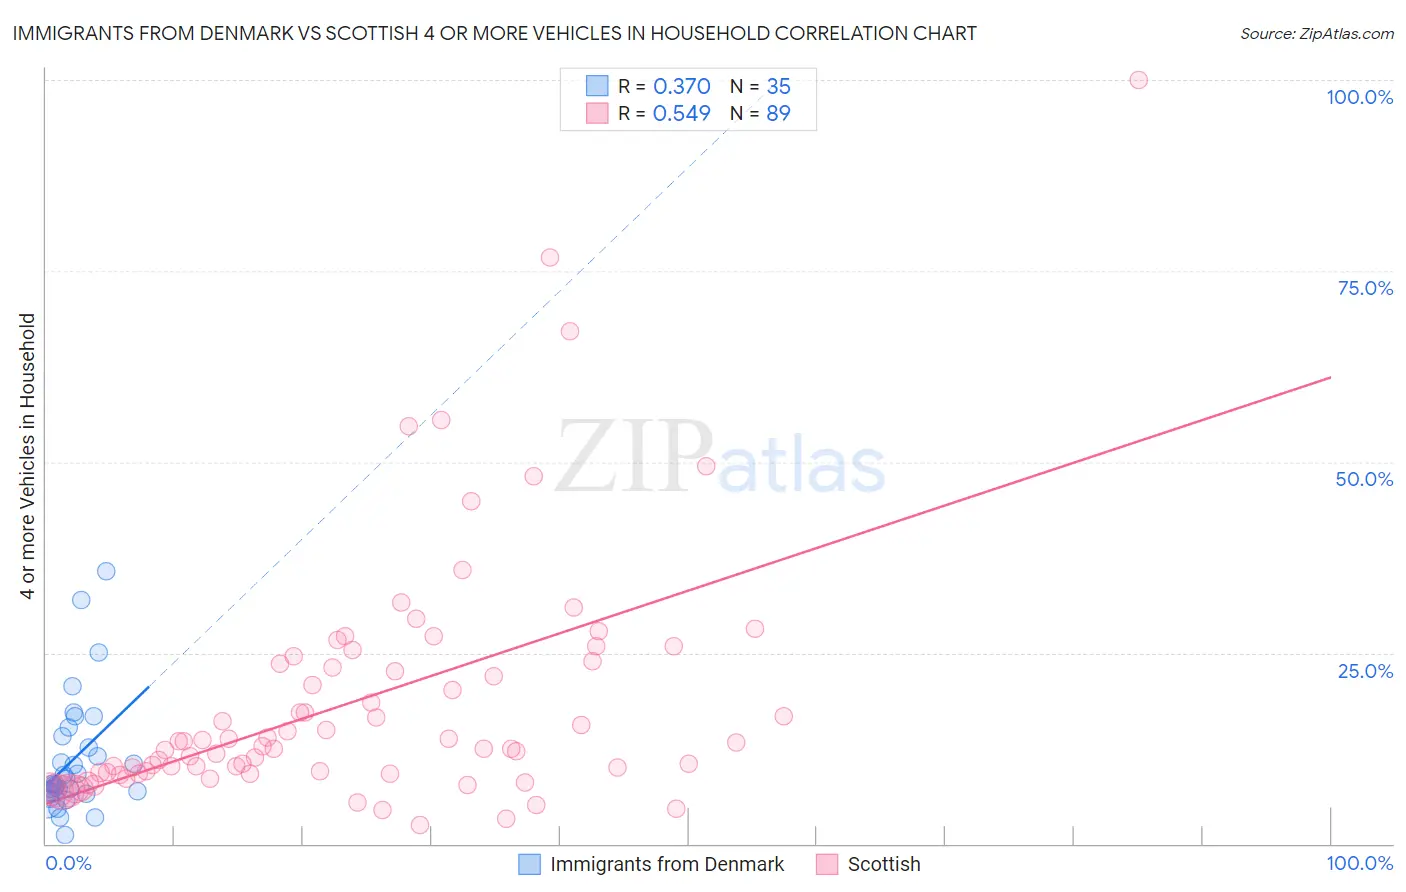
Immigrants from Denmark vs Scottish 4 or more Vehicles in Household Correlation Chart
The statistical analysis conducted on geographies consisting of 135,941,579 people shows a mild positive correlation between the proportion of Immigrants from Denmark and percentage of households with 4 or more vehicles available in the United States with a correlation coefficient (R) of 0.370 and weighted average of 6.4%. Similarly, the statistical analysis conducted on geographies consisting of 563,736,274 people shows a substantial positive correlation between the proportion of Scottish and percentage of households with 4 or more vehicles available in the United States with a correlation coefficient (R) of 0.549 and weighted average of 7.4%, a difference of 16.8%.
4 or more Vehicles in Household Correlation Summary
| Measurement | Immigrants from Denmark | Scottish |
| Minimum | 1.2% | 2.5% |
| Maximum | 35.6% | 100.0% |
| Range | 34.4% | 97.5% |
| Mean | 11.0% | 18.7% |
| Median | 7.8% | 12.8% |
| Interquartile 25% (IQ1) | 6.7% | 9.3% |
| Interquartile 75% (IQ3) | 14.0% | 23.8% |
| Interquartile Range (IQR) | 7.3% | 14.5% |
| Standard Deviation (Sample) | 7.6% | 16.4% |
| Standard Deviation (Population) | 7.5% | 16.3% |
Similar Demographics by 4 or more Vehicles in Household
Demographics Similar to Immigrants from Denmark by 4 or more Vehicles in Household
In terms of 4 or more vehicles in household, the demographic groups most similar to Immigrants from Denmark are Polish (6.4%, a difference of 0.10%), Lebanese (6.4%, a difference of 0.20%), Immigrants from Peru (6.4%, a difference of 0.21%), Estonian (6.4%, a difference of 0.28%), and Chilean (6.4%, a difference of 0.35%).
| Demographics | Rating | Rank | 4 or more Vehicles in Household |
| Indians (Asian) | 66.3 /100 | #159 | Good 6.4% |
| Palestinians | 65.8 /100 | #160 | Good 6.4% |
| Immigrants | Cameroon | 64.4 /100 | #161 | Good 6.4% |
| Immigrants | Pakistan | 63.2 /100 | #162 | Good 6.4% |
| Chileans | 61.2 /100 | #163 | Good 6.4% |
| Hungarians | 61.1 /100 | #164 | Good 6.4% |
| Immigrants | Peru | 59.8 /100 | #165 | Average 6.4% |
| Immigrants | Denmark | 57.8 /100 | #166 | Average 6.4% |
| Poles | 56.9 /100 | #167 | Average 6.4% |
| Lebanese | 55.8 /100 | #168 | Average 6.4% |
| Estonians | 55.1 /100 | #169 | Average 6.4% |
| Immigrants | Syria | 52.8 /100 | #170 | Average 6.3% |
| Immigrants | India | 51.9 /100 | #171 | Average 6.3% |
| Immigrants | Lebanon | 51.7 /100 | #172 | Average 6.3% |
| Slovenes | 51.1 /100 | #173 | Average 6.3% |
Demographics Similar to Scottish by 4 or more Vehicles in Household
In terms of 4 or more vehicles in household, the demographic groups most similar to Scottish are German (7.5%, a difference of 0.070%), Chickasaw (7.4%, a difference of 0.13%), Scotch-Irish (7.4%, a difference of 0.43%), Portuguese (7.4%, a difference of 0.52%), and Welsh (7.5%, a difference of 0.67%).
| Demographics | Rating | Rank | 4 or more Vehicles in Household |
| Immigrants | Micronesia | 100.0 /100 | #63 | Exceptional 7.6% |
| Bangladeshis | 100.0 /100 | #64 | Exceptional 7.6% |
| Immigrants | Azores | 100.0 /100 | #65 | Exceptional 7.5% |
| Immigrants | Taiwan | 99.9 /100 | #66 | Exceptional 7.5% |
| Americans | 99.9 /100 | #67 | Exceptional 7.5% |
| Welsh | 99.9 /100 | #68 | Exceptional 7.5% |
| Germans | 99.9 /100 | #69 | Exceptional 7.5% |
| Scottish | 99.9 /100 | #70 | Exceptional 7.4% |
| Chickasaw | 99.9 /100 | #71 | Exceptional 7.4% |
| Scotch-Irish | 99.9 /100 | #72 | Exceptional 7.4% |
| Portuguese | 99.9 /100 | #73 | Exceptional 7.4% |
| Icelanders | 99.9 /100 | #74 | Exceptional 7.4% |
| Immigrants | Cambodia | 99.9 /100 | #75 | Exceptional 7.4% |
| Laotians | 99.9 /100 | #76 | Exceptional 7.4% |
| Apache | 99.9 /100 | #77 | Exceptional 7.4% |