Immigrants from North America vs Scottish 4 or more Vehicles in Household
COMPARE
Immigrants from North America
Scottish
4 or more Vehicles in Household
4 or more Vehicles in Household Comparison
Immigrants from North America
Scottish
6.5%
4 OR MORE VEHICLES IN HOUSEHOLD
78.5/ 100
METRIC RATING
144th/ 347
METRIC RANK
7.4%
4 OR MORE VEHICLES IN HOUSEHOLD
99.9/ 100
METRIC RATING
70th/ 347
METRIC RANK
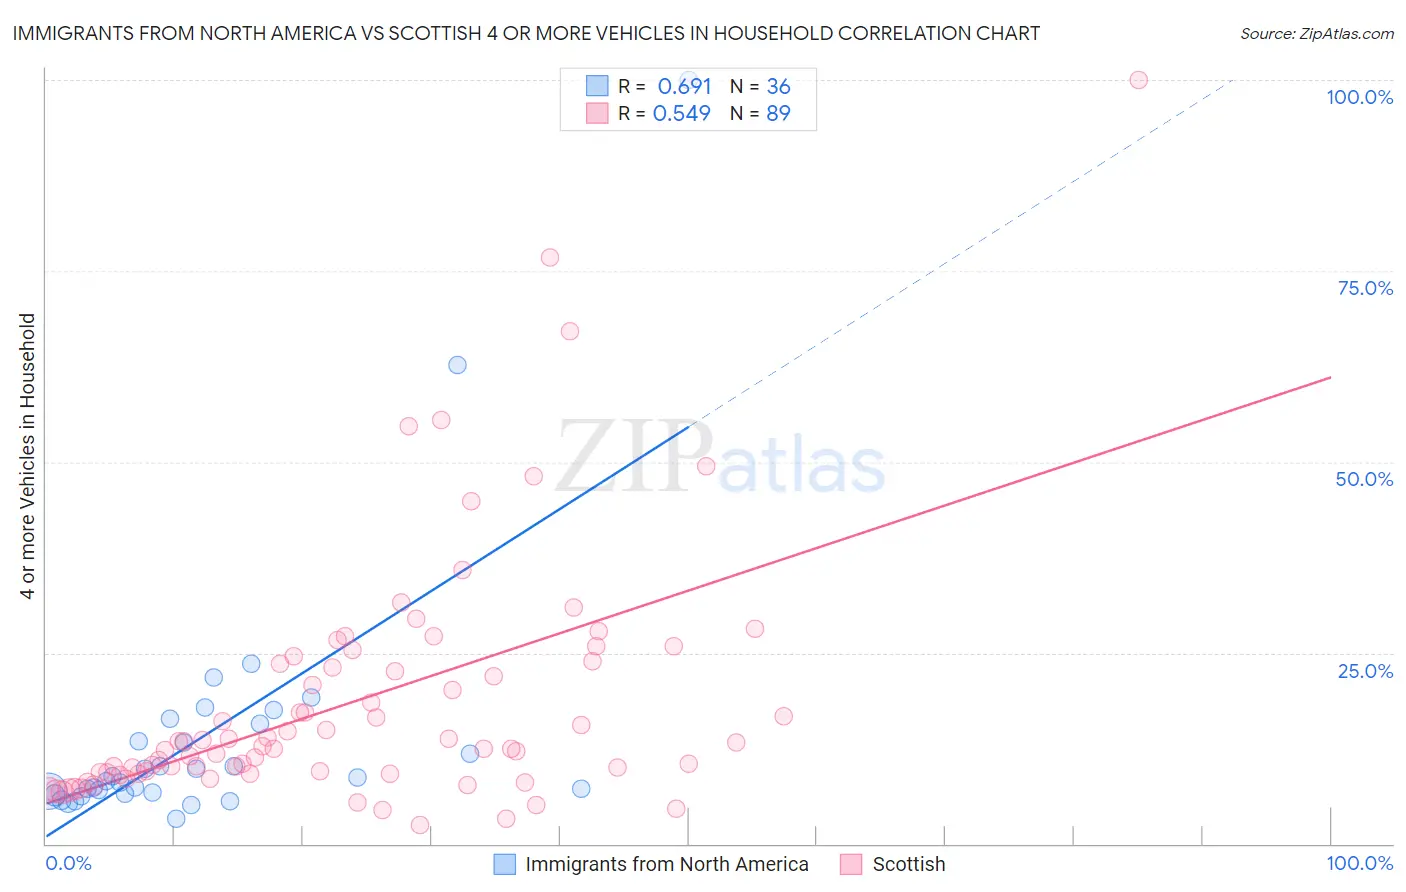
Immigrants from North America vs Scottish 4 or more Vehicles in Household Correlation Chart
The statistical analysis conducted on geographies consisting of 460,242,887 people shows a significant positive correlation between the proportion of Immigrants from North America and percentage of households with 4 or more vehicles available in the United States with a correlation coefficient (R) of 0.691 and weighted average of 6.5%. Similarly, the statistical analysis conducted on geographies consisting of 563,736,274 people shows a substantial positive correlation between the proportion of Scottish and percentage of households with 4 or more vehicles available in the United States with a correlation coefficient (R) of 0.549 and weighted average of 7.4%, a difference of 14.0%.
4 or more Vehicles in Household Correlation Summary
| Measurement | Immigrants from North America | Scottish |
| Minimum | 3.3% | 2.5% |
| Maximum | 100.0% | 100.0% |
| Range | 96.7% | 97.5% |
| Mean | 14.1% | 18.7% |
| Median | 8.4% | 12.8% |
| Interquartile 25% (IQ1) | 6.7% | 9.3% |
| Interquartile 75% (IQ3) | 14.6% | 23.8% |
| Interquartile Range (IQR) | 7.9% | 14.5% |
| Standard Deviation (Sample) | 17.9% | 16.4% |
| Standard Deviation (Population) | 17.6% | 16.3% |
Similar Demographics by 4 or more Vehicles in Household
Demographics Similar to Immigrants from North America by 4 or more Vehicles in Household
In terms of 4 or more vehicles in household, the demographic groups most similar to Immigrants from North America are Immigrants from Canada (6.5%, a difference of 0.020%), Croatian (6.5%, a difference of 0.10%), Immigrants from Iraq (6.5%, a difference of 0.15%), Australian (6.6%, a difference of 0.35%), and Slavic (6.6%, a difference of 0.48%).
| Demographics | Rating | Rank | 4 or more Vehicles in Household |
| French Canadians | 85.4 /100 | #137 | Excellent 6.6% |
| Italians | 84.5 /100 | #138 | Excellent 6.6% |
| Jordanians | 82.1 /100 | #139 | Excellent 6.6% |
| Slavs | 81.6 /100 | #140 | Excellent 6.6% |
| Australians | 80.8 /100 | #141 | Excellent 6.6% |
| Immigrants | Iraq | 79.4 /100 | #142 | Good 6.5% |
| Immigrants | Canada | 78.6 /100 | #143 | Good 6.5% |
| Immigrants | North America | 78.5 /100 | #144 | Good 6.5% |
| Croatians | 77.8 /100 | #145 | Good 6.5% |
| Immigrants | Costa Rica | 74.4 /100 | #146 | Good 6.5% |
| Immigrants | Iran | 73.9 /100 | #147 | Good 6.5% |
| Immigrants | Jordan | 73.7 /100 | #148 | Good 6.5% |
| Greeks | 73.6 /100 | #149 | Good 6.5% |
| New Zealanders | 73.3 /100 | #150 | Good 6.5% |
| Immigrants | Hong Kong | 72.2 /100 | #151 | Good 6.5% |
Demographics Similar to Scottish by 4 or more Vehicles in Household
In terms of 4 or more vehicles in household, the demographic groups most similar to Scottish are German (7.5%, a difference of 0.070%), Chickasaw (7.4%, a difference of 0.13%), Scotch-Irish (7.4%, a difference of 0.43%), Portuguese (7.4%, a difference of 0.52%), and Welsh (7.5%, a difference of 0.67%).
| Demographics | Rating | Rank | 4 or more Vehicles in Household |
| Immigrants | Micronesia | 100.0 /100 | #63 | Exceptional 7.6% |
| Bangladeshis | 100.0 /100 | #64 | Exceptional 7.6% |
| Immigrants | Azores | 100.0 /100 | #65 | Exceptional 7.5% |
| Immigrants | Taiwan | 99.9 /100 | #66 | Exceptional 7.5% |
| Americans | 99.9 /100 | #67 | Exceptional 7.5% |
| Welsh | 99.9 /100 | #68 | Exceptional 7.5% |
| Germans | 99.9 /100 | #69 | Exceptional 7.5% |
| Scottish | 99.9 /100 | #70 | Exceptional 7.4% |
| Chickasaw | 99.9 /100 | #71 | Exceptional 7.4% |
| Scotch-Irish | 99.9 /100 | #72 | Exceptional 7.4% |
| Portuguese | 99.9 /100 | #73 | Exceptional 7.4% |
| Icelanders | 99.9 /100 | #74 | Exceptional 7.4% |
| Immigrants | Cambodia | 99.9 /100 | #75 | Exceptional 7.4% |
| Laotians | 99.9 /100 | #76 | Exceptional 7.4% |
| Apache | 99.9 /100 | #77 | Exceptional 7.4% |