Vietnamese vs Scottish Seniors Poverty Over the Age of 75
COMPARE
Vietnamese
Scottish
Seniors Poverty Over the Age of 75
Seniors Poverty Over the Age of 75 Comparison
Vietnamese
Scottish
15.9%
SENIORS POVERTY OVER THE AGE OF 75
0.0/ 100
METRIC RATING
310th/ 347
METRIC RANK
10.5%
SENIORS POVERTY OVER THE AGE OF 75
99.9/ 100
METRIC RATING
14th/ 347
METRIC RANK
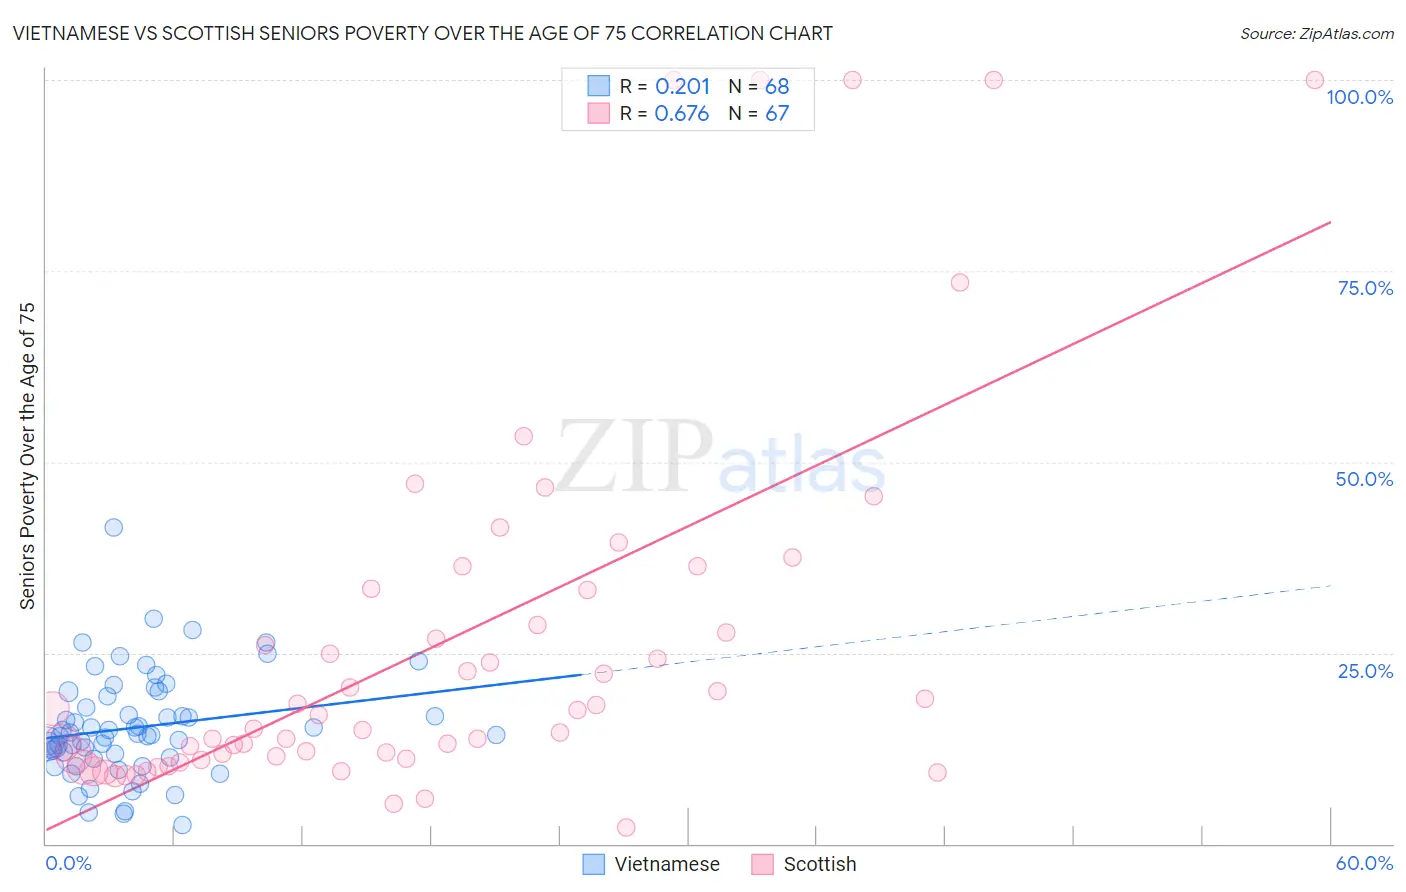
Vietnamese vs Scottish Seniors Poverty Over the Age of 75 Correlation Chart
The statistical analysis conducted on geographies consisting of 169,621,093 people shows a weak positive correlation between the proportion of Vietnamese and poverty level among seniors over the age of 75 in the United States with a correlation coefficient (R) of 0.201 and weighted average of 15.9%. Similarly, the statistical analysis conducted on geographies consisting of 550,180,944 people shows a significant positive correlation between the proportion of Scottish and poverty level among seniors over the age of 75 in the United States with a correlation coefficient (R) of 0.676 and weighted average of 10.5%, a difference of 50.9%.
Seniors Poverty Over the Age of 75 Correlation Summary
| Measurement | Vietnamese | Scottish |
| Minimum | 2.5% | 2.1% |
| Maximum | 41.4% | 100.0% |
| Range | 38.9% | 97.9% |
| Mean | 15.2% | 26.2% |
| Median | 14.3% | 16.8% |
| Interquartile 25% (IQ1) | 11.5% | 11.1% |
| Interquartile 75% (IQ3) | 18.6% | 33.2% |
| Interquartile Range (IQR) | 7.0% | 22.1% |
| Standard Deviation (Sample) | 6.8% | 24.9% |
| Standard Deviation (Population) | 6.7% | 24.7% |
Similar Demographics by Seniors Poverty Over the Age of 75
Demographics Similar to Vietnamese by Seniors Poverty Over the Age of 75
In terms of seniors poverty over the age of 75, the demographic groups most similar to Vietnamese are Yup'ik (15.8%, a difference of 0.10%), Trinidadian and Tobagonian (15.9%, a difference of 0.10%), Immigrants from Bangladesh (15.8%, a difference of 0.40%), Immigrants from West Indies (15.8%, a difference of 0.44%), and Crow (15.9%, a difference of 0.51%).
| Demographics | Rating | Rank | Seniors Poverty Over the Age of 75 |
| Immigrants | Honduras | 0.0 /100 | #303 | Tragic 15.7% |
| Immigrants | Trinidad and Tobago | 0.0 /100 | #304 | Tragic 15.7% |
| Ecuadorians | 0.0 /100 | #305 | Tragic 15.7% |
| Hispanics or Latinos | 0.0 /100 | #306 | Tragic 15.8% |
| Immigrants | West Indies | 0.0 /100 | #307 | Tragic 15.8% |
| Immigrants | Bangladesh | 0.0 /100 | #308 | Tragic 15.8% |
| Yup'ik | 0.0 /100 | #309 | Tragic 15.8% |
| Vietnamese | 0.0 /100 | #310 | Tragic 15.9% |
| Trinidadians and Tobagonians | 0.0 /100 | #311 | Tragic 15.9% |
| Crow | 0.0 /100 | #312 | Tragic 15.9% |
| Barbadians | 0.0 /100 | #313 | Tragic 16.0% |
| Tsimshian | 0.0 /100 | #314 | Tragic 16.1% |
| Guyanese | 0.0 /100 | #315 | Tragic 16.1% |
| Immigrants | Ecuador | 0.0 /100 | #316 | Tragic 16.1% |
| Immigrants | Guyana | 0.0 /100 | #317 | Tragic 16.2% |
Demographics Similar to Scottish by Seniors Poverty Over the Age of 75
In terms of seniors poverty over the age of 75, the demographic groups most similar to Scottish are European (10.5%, a difference of 0.0%), Dutch (10.5%, a difference of 0.12%), Croatian (10.5%, a difference of 0.15%), Tongan (10.5%, a difference of 0.25%), and Slovak (10.5%, a difference of 0.32%).
| Demographics | Rating | Rank | Seniors Poverty Over the Age of 75 |
| Maltese | 100.0 /100 | #7 | Exceptional 10.3% |
| Germans | 99.9 /100 | #8 | Exceptional 10.4% |
| English | 99.9 /100 | #9 | Exceptional 10.4% |
| Scandinavians | 99.9 /100 | #10 | Exceptional 10.4% |
| Immigrants | India | 99.9 /100 | #11 | Exceptional 10.4% |
| Tongans | 99.9 /100 | #12 | Exceptional 10.5% |
| Croatians | 99.9 /100 | #13 | Exceptional 10.5% |
| Scottish | 99.9 /100 | #14 | Exceptional 10.5% |
| Europeans | 99.9 /100 | #15 | Exceptional 10.5% |
| Dutch | 99.9 /100 | #16 | Exceptional 10.5% |
| Slovaks | 99.9 /100 | #17 | Exceptional 10.5% |
| Welsh | 99.9 /100 | #18 | Exceptional 10.5% |
| Immigrants | Scotland | 99.9 /100 | #19 | Exceptional 10.5% |
| Czechs | 99.9 /100 | #20 | Exceptional 10.5% |
| Slovenes | 99.9 /100 | #21 | Exceptional 10.6% |