Vietnamese vs Puerto Rican 2 or more Vehicles in Household
COMPARE
Vietnamese
Puerto Rican
2 or more Vehicles in Household
2 or more Vehicles in Household Comparison
Vietnamese
Puerto Ricans
38.5%
2 OR MORE VEHICLES IN HOUSEHOLD
0.0/ 100
METRIC RATING
336th/ 347
METRIC RANK
47.1%
2 OR MORE VEHICLES IN HOUSEHOLD
0.0/ 100
METRIC RATING
315th/ 347
METRIC RANK
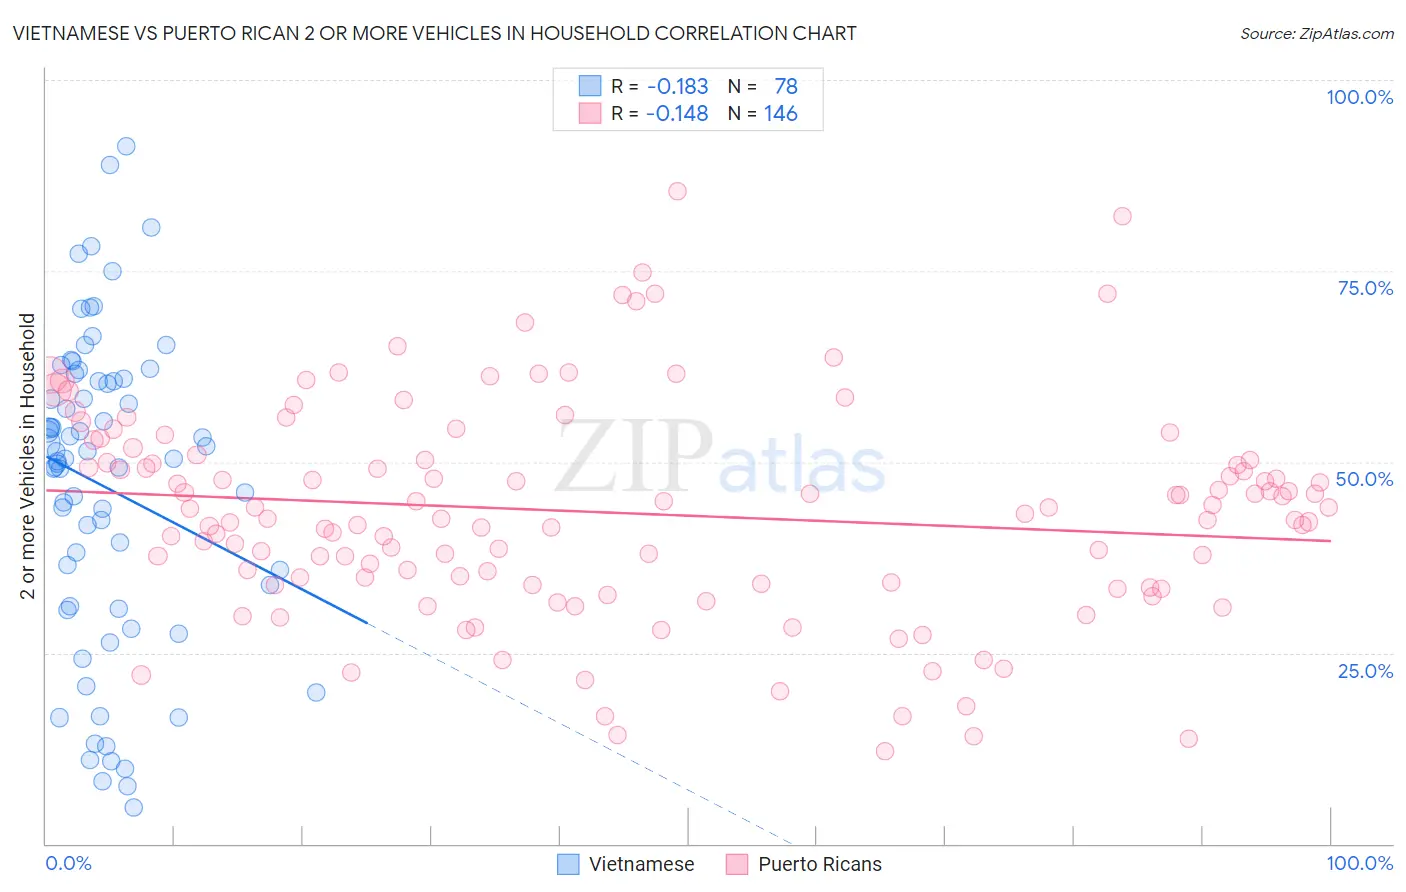
Vietnamese vs Puerto Rican 2 or more Vehicles in Household Correlation Chart
The statistical analysis conducted on geographies consisting of 170,680,365 people shows a poor negative correlation between the proportion of Vietnamese and percentage of households with 2 or more vehicles available in the United States with a correlation coefficient (R) of -0.183 and weighted average of 38.5%. Similarly, the statistical analysis conducted on geographies consisting of 527,777,408 people shows a poor negative correlation between the proportion of Puerto Ricans and percentage of households with 2 or more vehicles available in the United States with a correlation coefficient (R) of -0.148 and weighted average of 47.1%, a difference of 22.4%.
2 or more Vehicles in Household Correlation Summary
| Measurement | Vietnamese | Puerto Rican |
| Minimum | 4.7% | 12.1% |
| Maximum | 91.3% | 85.5% |
| Range | 86.6% | 73.4% |
| Mean | 46.7% | 43.3% |
| Median | 50.4% | 42.9% |
| Interquartile 25% (IQ1) | 31.1% | 34.1% |
| Interquartile 75% (IQ3) | 60.6% | 50.3% |
| Interquartile Range (IQR) | 29.5% | 16.2% |
| Standard Deviation (Sample) | 20.3% | 14.0% |
| Standard Deviation (Population) | 20.2% | 14.0% |
Similar Demographics by 2 or more Vehicles in Household
Demographics Similar to Vietnamese by 2 or more Vehicles in Household
In terms of 2 or more vehicles in household, the demographic groups most similar to Vietnamese are Barbadian (38.3%, a difference of 0.41%), Immigrants from Bangladesh (38.8%, a difference of 0.72%), Immigrants from Uzbekistan (37.9%, a difference of 1.6%), Immigrants from Trinidad and Tobago (40.3%, a difference of 4.6%), and Immigrants from Ecuador (40.5%, a difference of 5.2%).
| Demographics | Rating | Rank | 2 or more Vehicles in Household |
| Ecuadorians | 0.0 /100 | #329 | Tragic 42.0% |
| Immigrants | Dominica | 0.0 /100 | #330 | Tragic 41.6% |
| West Indians | 0.0 /100 | #331 | Tragic 41.3% |
| Trinidadians and Tobagonians | 0.0 /100 | #332 | Tragic 40.9% |
| Immigrants | Ecuador | 0.0 /100 | #333 | Tragic 40.5% |
| Immigrants | Trinidad and Tobago | 0.0 /100 | #334 | Tragic 40.3% |
| Immigrants | Bangladesh | 0.0 /100 | #335 | Tragic 38.8% |
| Vietnamese | 0.0 /100 | #336 | Tragic 38.5% |
| Barbadians | 0.0 /100 | #337 | Tragic 38.3% |
| Immigrants | Uzbekistan | 0.0 /100 | #338 | Tragic 37.9% |
| Immigrants | Barbados | 0.0 /100 | #339 | Tragic 35.8% |
| British West Indians | 0.0 /100 | #340 | Tragic 35.4% |
| Guyanese | 0.0 /100 | #341 | Tragic 35.4% |
| Dominicans | 0.0 /100 | #342 | Tragic 35.3% |
| Immigrants | Guyana | 0.0 /100 | #343 | Tragic 35.0% |
Demographics Similar to Puerto Ricans by 2 or more Vehicles in Household
In terms of 2 or more vehicles in household, the demographic groups most similar to Puerto Ricans are Immigrants from Ghana (47.4%, a difference of 0.57%), Cape Verdean (46.8%, a difference of 0.69%), U.S. Virgin Islander (47.5%, a difference of 0.80%), Haitian (47.6%, a difference of 0.97%), and Immigrants from Haiti (46.5%, a difference of 1.2%).
| Demographics | Rating | Rank | 2 or more Vehicles in Household |
| Albanians | 0.0 /100 | #308 | Tragic 49.0% |
| Moroccans | 0.0 /100 | #309 | Tragic 48.8% |
| Ghanaians | 0.0 /100 | #310 | Tragic 48.0% |
| Immigrants | Belarus | 0.0 /100 | #311 | Tragic 47.9% |
| Haitians | 0.0 /100 | #312 | Tragic 47.6% |
| U.S. Virgin Islanders | 0.0 /100 | #313 | Tragic 47.5% |
| Immigrants | Ghana | 0.0 /100 | #314 | Tragic 47.4% |
| Puerto Ricans | 0.0 /100 | #315 | Tragic 47.1% |
| Cape Verdeans | 0.0 /100 | #316 | Tragic 46.8% |
| Immigrants | Haiti | 0.0 /100 | #317 | Tragic 46.5% |
| Immigrants | Albania | 0.0 /100 | #318 | Tragic 46.0% |
| Jamaicans | 0.0 /100 | #319 | Tragic 45.8% |
| Soviet Union | 0.0 /100 | #320 | Tragic 45.7% |
| Immigrants | Jamaica | 0.0 /100 | #321 | Tragic 44.5% |
| Senegalese | 0.0 /100 | #322 | Tragic 44.2% |