Vietnamese vs Immigrants from Scotland 9th Grade
COMPARE
Vietnamese
Immigrants from Scotland
9th Grade
9th Grade Comparison
Vietnamese
Immigrants from Scotland
92.3%
9TH GRADE
0.0/ 100
METRIC RATING
313th/ 347
METRIC RANK
96.1%
9TH GRADE
99.9/ 100
METRIC RATING
38th/ 347
METRIC RANK
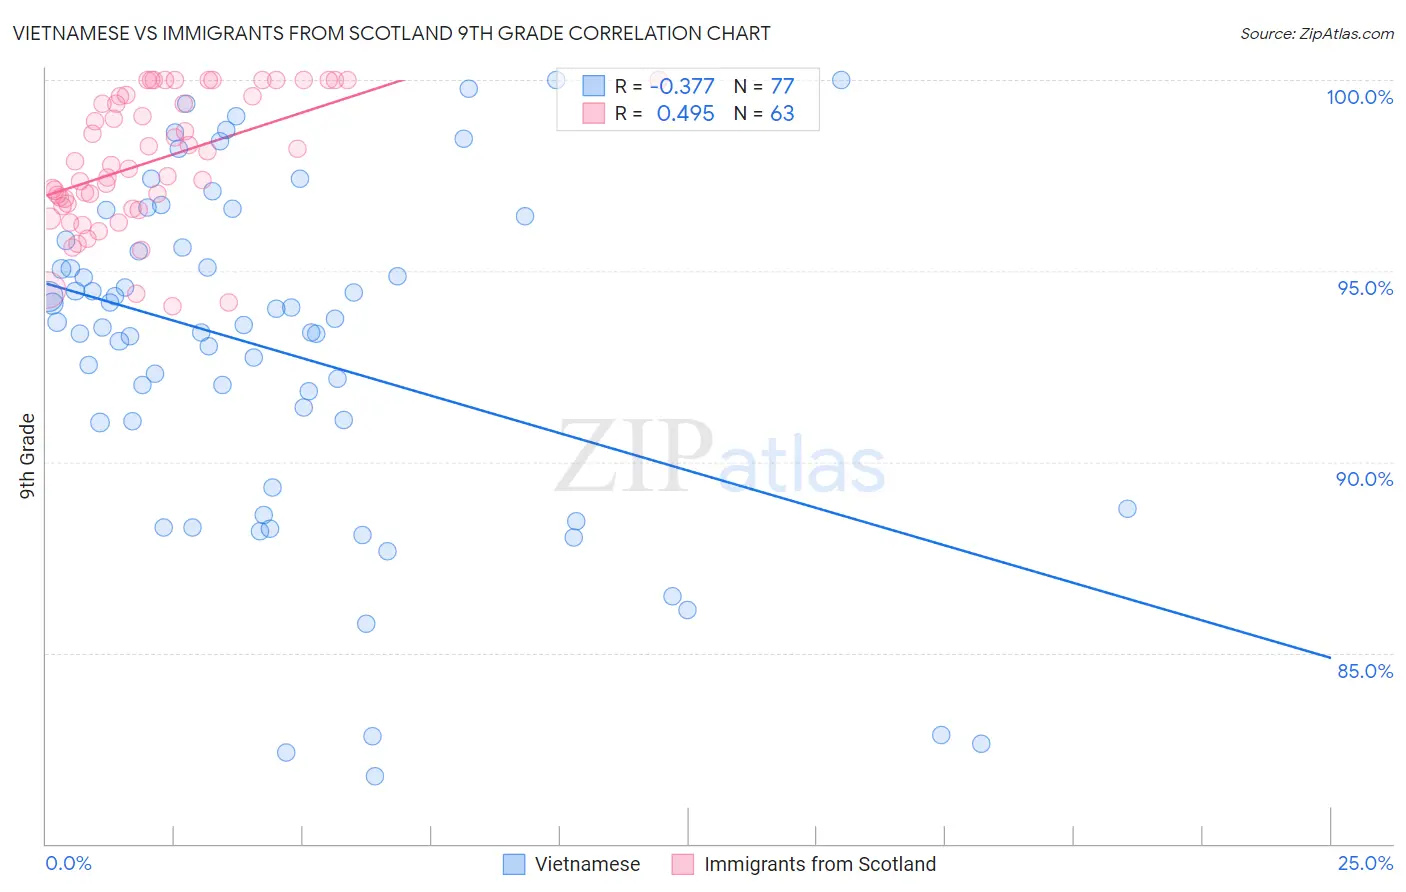
Vietnamese vs Immigrants from Scotland 9th Grade Correlation Chart
The statistical analysis conducted on geographies consisting of 170,728,240 people shows a mild negative correlation between the proportion of Vietnamese and percentage of population with at least 9th grade education in the United States with a correlation coefficient (R) of -0.377 and weighted average of 92.3%. Similarly, the statistical analysis conducted on geographies consisting of 196,394,967 people shows a moderate positive correlation between the proportion of Immigrants from Scotland and percentage of population with at least 9th grade education in the United States with a correlation coefficient (R) of 0.495 and weighted average of 96.1%, a difference of 4.2%.
9th Grade Correlation Summary
| Measurement | Vietnamese | Immigrants from Scotland |
| Minimum | 81.8% | 94.1% |
| Maximum | 100.0% | 100.0% |
| Range | 18.2% | 5.9% |
| Mean | 92.9% | 97.9% |
| Median | 93.6% | 97.8% |
| Interquartile 25% (IQ1) | 90.2% | 96.7% |
| Interquartile 75% (IQ3) | 95.7% | 99.6% |
| Interquartile Range (IQR) | 5.5% | 2.9% |
| Standard Deviation (Sample) | 4.4% | 1.7% |
| Standard Deviation (Population) | 4.4% | 1.7% |
Similar Demographics by 9th Grade
Demographics Similar to Vietnamese by 9th Grade
In terms of 9th grade, the demographic groups most similar to Vietnamese are Houma (92.3%, a difference of 0.020%), Immigrants from Portugal (92.2%, a difference of 0.040%), Immigrants from Fiji (92.3%, a difference of 0.050%), Immigrants from Caribbean (92.2%, a difference of 0.050%), and Immigrants from Cambodia (92.4%, a difference of 0.080%).
| Demographics | Rating | Rank | 9th Grade |
| Immigrants | Vietnam | 0.0 /100 | #306 | Tragic 92.6% |
| Immigrants | Immigrants | 0.0 /100 | #307 | Tragic 92.5% |
| Immigrants | Guyana | 0.0 /100 | #308 | Tragic 92.5% |
| Immigrants | Bangladesh | 0.0 /100 | #309 | Tragic 92.4% |
| Immigrants | Cambodia | 0.0 /100 | #310 | Tragic 92.4% |
| Immigrants | Fiji | 0.0 /100 | #311 | Tragic 92.3% |
| Houma | 0.0 /100 | #312 | Tragic 92.3% |
| Vietnamese | 0.0 /100 | #313 | Tragic 92.3% |
| Immigrants | Portugal | 0.0 /100 | #314 | Tragic 92.2% |
| Immigrants | Caribbean | 0.0 /100 | #315 | Tragic 92.2% |
| Cape Verdeans | 0.0 /100 | #316 | Tragic 92.2% |
| Immigrants | Cuba | 0.0 /100 | #317 | Tragic 92.2% |
| Nepalese | 0.0 /100 | #318 | Tragic 92.0% |
| Ecuadorians | 0.0 /100 | #319 | Tragic 91.9% |
| Nicaraguans | 0.0 /100 | #320 | Tragic 91.9% |
Demographics Similar to Immigrants from Scotland by 9th Grade
In terms of 9th grade, the demographic groups most similar to Immigrants from Scotland are Estonian (96.1%, a difference of 0.0%), Ottawa (96.1%, a difference of 0.020%), Northern European (96.2%, a difference of 0.040%), Slavic (96.1%, a difference of 0.040%), and Bulgarian (96.2%, a difference of 0.050%).
| Demographics | Rating | Rank | 9th Grade |
| British | 100.0 /100 | #31 | Exceptional 96.3% |
| Belgians | 100.0 /100 | #32 | Exceptional 96.3% |
| Luxembourgers | 100.0 /100 | #33 | Exceptional 96.3% |
| Hungarians | 100.0 /100 | #34 | Exceptional 96.2% |
| Bulgarians | 99.9 /100 | #35 | Exceptional 96.2% |
| Northern Europeans | 99.9 /100 | #36 | Exceptional 96.2% |
| Estonians | 99.9 /100 | #37 | Exceptional 96.1% |
| Immigrants | Scotland | 99.9 /100 | #38 | Exceptional 96.1% |
| Ottawa | 99.9 /100 | #39 | Exceptional 96.1% |
| Slavs | 99.9 /100 | #40 | Exceptional 96.1% |
| Czechoslovakians | 99.9 /100 | #41 | Exceptional 96.1% |
| Chippewa | 99.9 /100 | #42 | Exceptional 96.1% |
| Iranians | 99.9 /100 | #43 | Exceptional 96.1% |
| Alaska Natives | 99.9 /100 | #44 | Exceptional 96.1% |
| Crow | 99.9 /100 | #45 | Exceptional 96.1% |