Ute vs Icelander 2 or more Vehicles in Household
COMPARE
Ute
Icelander
2 or more Vehicles in Household
2 or more Vehicles in Household Comparison
Ute
Icelanders
56.6%
2 OR MORE VEHICLES IN HOUSEHOLD
90.4/ 100
METRIC RATING
129th/ 347
METRIC RANK
58.0%
2 OR MORE VEHICLES IN HOUSEHOLD
99.2/ 100
METRIC RATING
83rd/ 347
METRIC RANK
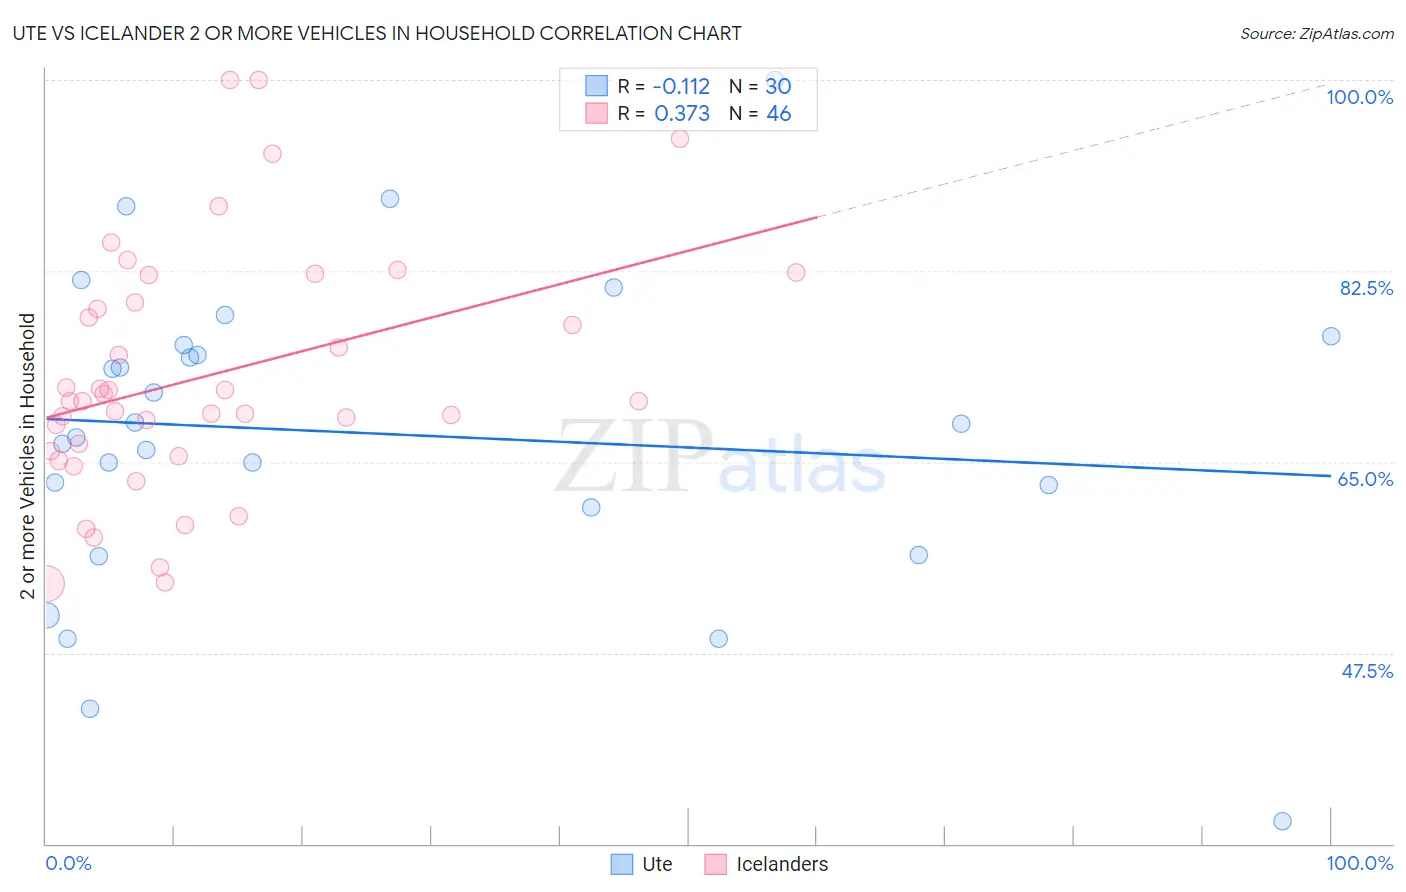
Ute vs Icelander 2 or more Vehicles in Household Correlation Chart
The statistical analysis conducted on geographies consisting of 55,668,301 people shows a poor negative correlation between the proportion of Ute and percentage of households with 2 or more vehicles available in the United States with a correlation coefficient (R) of -0.112 and weighted average of 56.6%. Similarly, the statistical analysis conducted on geographies consisting of 159,625,716 people shows a mild positive correlation between the proportion of Icelanders and percentage of households with 2 or more vehicles available in the United States with a correlation coefficient (R) of 0.373 and weighted average of 58.0%, a difference of 2.6%.
2 or more Vehicles in Household Correlation Summary
| Measurement | Ute | Icelander |
| Minimum | 32.0% | 53.8% |
| Maximum | 100.0% | 100.0% |
| Range | 68.0% | 46.2% |
| Mean | 67.6% | 72.9% |
| Median | 67.9% | 70.6% |
| Interquartile 25% (IQ1) | 60.8% | 66.0% |
| Interquartile 75% (IQ3) | 75.7% | 79.6% |
| Interquartile Range (IQR) | 14.9% | 13.6% |
| Standard Deviation (Sample) | 14.4% | 11.2% |
| Standard Deviation (Population) | 14.2% | 11.1% |
Similar Demographics by 2 or more Vehicles in Household
Demographics Similar to Ute by 2 or more Vehicles in Household
In terms of 2 or more vehicles in household, the demographic groups most similar to Ute are Immigrants from South Central Asia (56.6%, a difference of 0.020%), Immigrants from Thailand (56.6%, a difference of 0.030%), Yugoslavian (56.6%, a difference of 0.040%), Estonian (56.6%, a difference of 0.070%), and Bulgarian (56.5%, a difference of 0.070%).
| Demographics | Rating | Rank | 2 or more Vehicles in Household |
| Immigrants | South Africa | 92.5 /100 | #122 | Exceptional 56.7% |
| Australians | 91.8 /100 | #123 | Exceptional 56.7% |
| New Zealanders | 91.8 /100 | #124 | Exceptional 56.7% |
| Tsimshian | 91.6 /100 | #125 | Exceptional 56.7% |
| Estonians | 90.9 /100 | #126 | Exceptional 56.6% |
| Immigrants | Thailand | 90.7 /100 | #127 | Exceptional 56.6% |
| Immigrants | South Central Asia | 90.5 /100 | #128 | Exceptional 56.6% |
| Ute | 90.4 /100 | #129 | Exceptional 56.6% |
| Yugoslavians | 90.0 /100 | #130 | Exceptional 56.6% |
| Bulgarians | 89.7 /100 | #131 | Excellent 56.5% |
| Hungarians | 89.1 /100 | #132 | Excellent 56.5% |
| Comanche | 88.4 /100 | #133 | Excellent 56.5% |
| Immigrants | Azores | 86.6 /100 | #134 | Excellent 56.4% |
| Blackfeet | 86.5 /100 | #135 | Excellent 56.4% |
| Immigrants | Asia | 86.0 /100 | #136 | Excellent 56.3% |
Demographics Similar to Icelanders by 2 or more Vehicles in Household
In terms of 2 or more vehicles in household, the demographic groups most similar to Icelanders are Maltese (58.0%, a difference of 0.030%), Iranian (58.1%, a difference of 0.040%), Slovak (58.0%, a difference of 0.080%), Potawatomi (58.0%, a difference of 0.11%), and Immigrants from Iraq (58.1%, a difference of 0.12%).
| Demographics | Rating | Rank | 2 or more Vehicles in Household |
| Creek | 99.5 /100 | #76 | Exceptional 58.3% |
| Slovenes | 99.5 /100 | #77 | Exceptional 58.3% |
| Lithuanians | 99.5 /100 | #78 | Exceptional 58.2% |
| Delaware | 99.4 /100 | #79 | Exceptional 58.2% |
| Immigrants | England | 99.3 /100 | #80 | Exceptional 58.1% |
| Immigrants | Iraq | 99.3 /100 | #81 | Exceptional 58.1% |
| Iranians | 99.3 /100 | #82 | Exceptional 58.1% |
| Icelanders | 99.2 /100 | #83 | Exceptional 58.0% |
| Maltese | 99.2 /100 | #84 | Exceptional 58.0% |
| Slovaks | 99.2 /100 | #85 | Exceptional 58.0% |
| Potawatomi | 99.1 /100 | #86 | Exceptional 58.0% |
| Thais | 99.1 /100 | #87 | Exceptional 57.9% |
| Immigrants | Iran | 99.1 /100 | #88 | Exceptional 57.9% |
| Immigrants | Germany | 99.0 /100 | #89 | Exceptional 57.9% |
| Hispanics or Latinos | 99.0 /100 | #90 | Exceptional 57.9% |