Ute vs Icelander Per Capita Income
COMPARE
Ute
Icelander
Per Capita Income
Per Capita Income Comparison
Ute
Icelanders
$36,651
PER CAPITA INCOME
0.0/ 100
METRIC RATING
310th/ 347
METRIC RANK
$44,987
PER CAPITA INCOME
81.6/ 100
METRIC RATING
144th/ 347
METRIC RANK
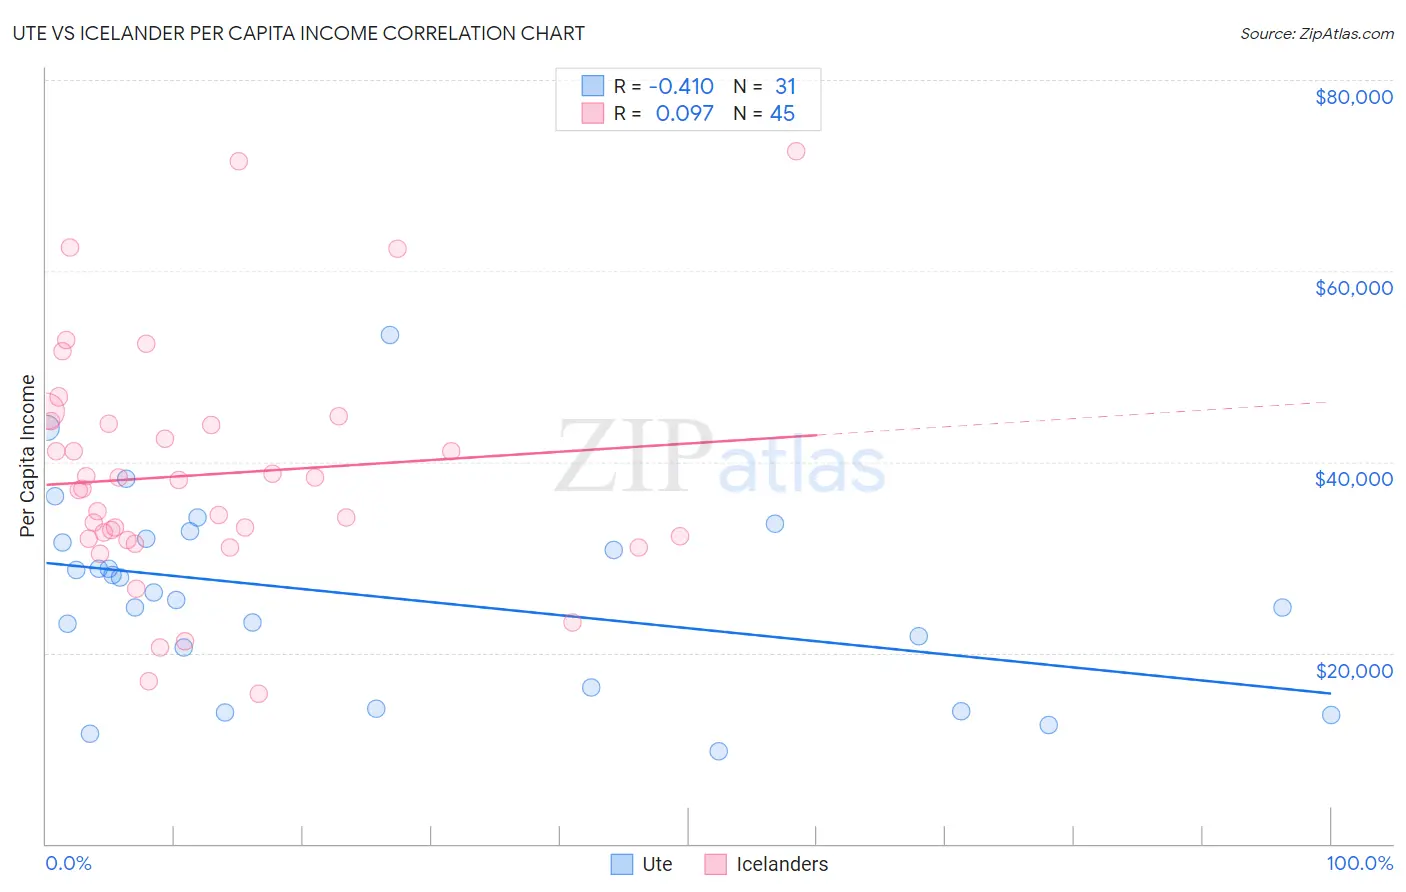
Ute vs Icelander Per Capita Income Correlation Chart
The statistical analysis conducted on geographies consisting of 55,660,141 people shows a moderate negative correlation between the proportion of Ute and per capita income in the United States with a correlation coefficient (R) of -0.410 and weighted average of $36,651. Similarly, the statistical analysis conducted on geographies consisting of 159,668,759 people shows a slight positive correlation between the proportion of Icelanders and per capita income in the United States with a correlation coefficient (R) of 0.097 and weighted average of $44,987, a difference of 22.7%.
Per Capita Income Correlation Summary
| Measurement | Ute | Icelander |
| Minimum | $9,749 | $15,711 |
| Maximum | $53,279 | $72,483 |
| Range | $43,530 | $56,772 |
| Mean | $25,907 | $38,667 |
| Median | $26,299 | $37,248 |
| Interquartile 25% (IQ1) | $16,307 | $31,880 |
| Interquartile 75% (IQ3) | $31,910 | $44,123 |
| Interquartile Range (IQR) | $15,603 | $12,243 |
| Standard Deviation (Sample) | $10,024 | $12,398 |
| Standard Deviation (Population) | $9,861 | $12,260 |
Similar Demographics by Per Capita Income
Demographics Similar to Ute by Per Capita Income
In terms of per capita income, the demographic groups most similar to Ute are Immigrants from Honduras ($36,665, a difference of 0.040%), Chippewa ($36,631, a difference of 0.060%), Fijian ($36,690, a difference of 0.10%), Immigrants from Latin America ($36,823, a difference of 0.47%), and Chickasaw ($36,475, a difference of 0.48%).
| Demographics | Rating | Rank | Per Capita Income |
| Paiute | 0.1 /100 | #303 | Tragic $37,066 |
| Hondurans | 0.1 /100 | #304 | Tragic $37,031 |
| Inupiat | 0.1 /100 | #305 | Tragic $36,999 |
| Immigrants | Haiti | 0.0 /100 | #306 | Tragic $36,849 |
| Immigrants | Latin America | 0.0 /100 | #307 | Tragic $36,823 |
| Fijians | 0.0 /100 | #308 | Tragic $36,690 |
| Immigrants | Honduras | 0.0 /100 | #309 | Tragic $36,665 |
| Ute | 0.0 /100 | #310 | Tragic $36,651 |
| Chippewa | 0.0 /100 | #311 | Tragic $36,631 |
| Chickasaw | 0.0 /100 | #312 | Tragic $36,475 |
| Bahamians | 0.0 /100 | #313 | Tragic $36,427 |
| Seminole | 0.0 /100 | #314 | Tragic $36,180 |
| Yaqui | 0.0 /100 | #315 | Tragic $36,112 |
| Choctaw | 0.0 /100 | #316 | Tragic $35,999 |
| Dutch West Indians | 0.0 /100 | #317 | Tragic $35,922 |
Demographics Similar to Icelanders by Per Capita Income
In terms of per capita income, the demographic groups most similar to Icelanders are Immigrants from Uganda ($45,043, a difference of 0.12%), Ugandan ($45,047, a difference of 0.13%), Slavic ($45,049, a difference of 0.14%), Immigrants from Jordan ($45,066, a difference of 0.18%), and Basque ($45,086, a difference of 0.22%).
| Demographics | Rating | Rank | Per Capita Income |
| Immigrants | Syria | 85.2 /100 | #137 | Excellent $45,218 |
| Assyrians/Chaldeans/Syriacs | 84.8 /100 | #138 | Excellent $45,195 |
| Basques | 83.2 /100 | #139 | Excellent $45,086 |
| Immigrants | Jordan | 82.9 /100 | #140 | Excellent $45,066 |
| Slavs | 82.6 /100 | #141 | Excellent $45,049 |
| Ugandans | 82.6 /100 | #142 | Excellent $45,047 |
| Immigrants | Uganda | 82.5 /100 | #143 | Excellent $45,043 |
| Icelanders | 81.6 /100 | #144 | Excellent $44,987 |
| Immigrants | Afghanistan | 78.0 /100 | #145 | Good $44,790 |
| Irish | 75.8 /100 | #146 | Good $44,679 |
| Czechs | 74.1 /100 | #147 | Good $44,595 |
| Immigrants | Armenia | 73.1 /100 | #148 | Good $44,552 |
| Koreans | 72.5 /100 | #149 | Good $44,522 |
| Immigrants | Eritrea | 72.1 /100 | #150 | Good $44,509 |
| Norwegians | 71.5 /100 | #151 | Good $44,480 |