U.S. Virgin Islander vs Turkish 6th Grade
COMPARE
U.S. Virgin Islander
Turkish
6th Grade
6th Grade Comparison
U.S. Virgin Islanders
Turks
96.5%
6TH GRADE
0.5/ 100
METRIC RATING
256th/ 347
METRIC RANK
97.5%
6TH GRADE
98.3/ 100
METRIC RATING
100th/ 347
METRIC RANK
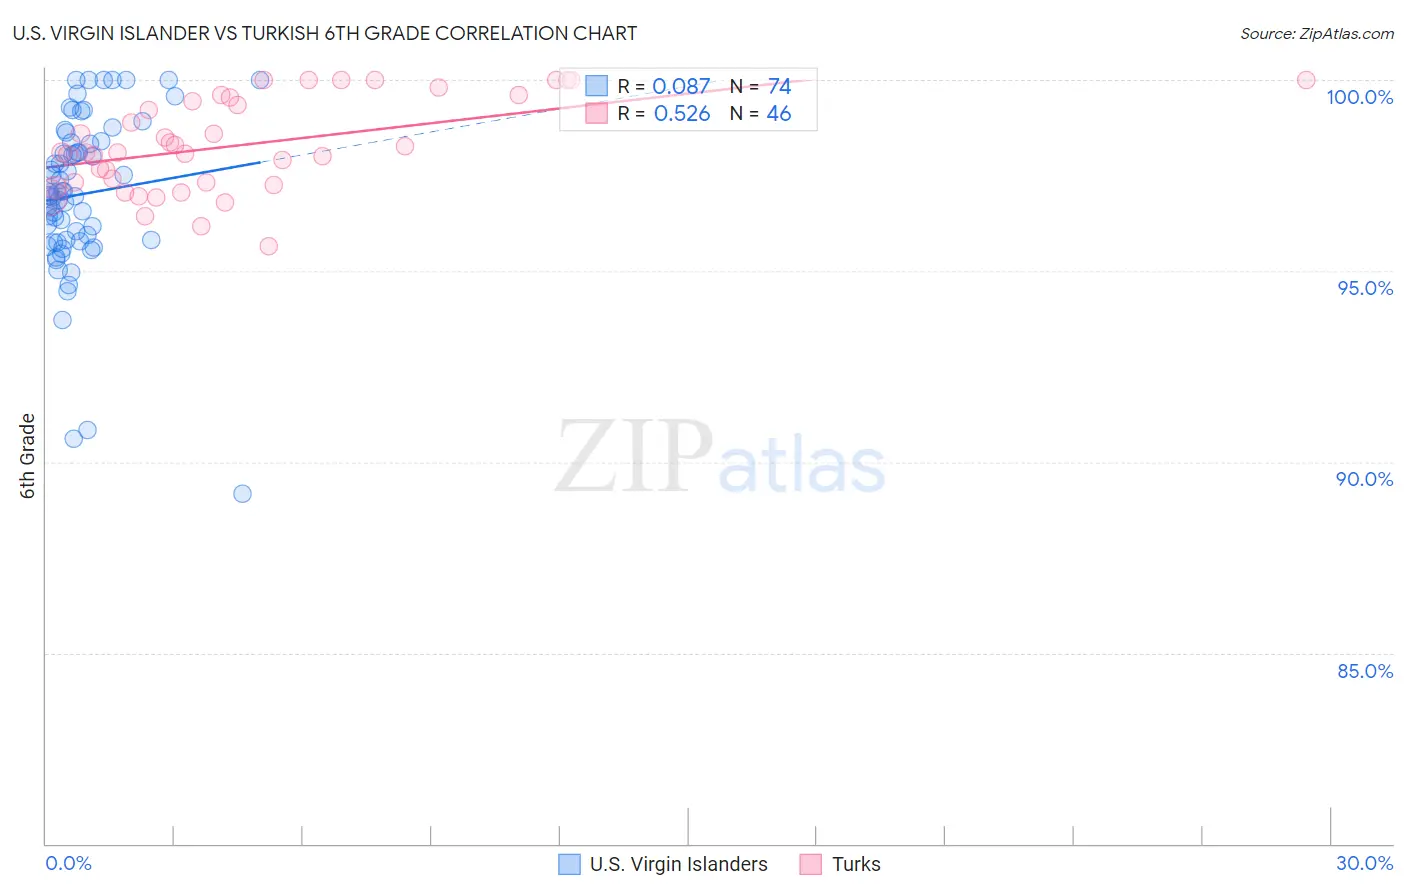
U.S. Virgin Islander vs Turkish 6th Grade Correlation Chart
The statistical analysis conducted on geographies consisting of 87,529,315 people shows a slight positive correlation between the proportion of U.S. Virgin Islanders and percentage of population with at least 6th grade education in the United States with a correlation coefficient (R) of 0.087 and weighted average of 96.5%. Similarly, the statistical analysis conducted on geographies consisting of 271,858,657 people shows a substantial positive correlation between the proportion of Turks and percentage of population with at least 6th grade education in the United States with a correlation coefficient (R) of 0.526 and weighted average of 97.5%, a difference of 1.1%.
6th Grade Correlation Summary
| Measurement | U.S. Virgin Islander | Turkish |
| Minimum | 89.2% | 95.6% |
| Maximum | 100.0% | 100.0% |
| Range | 10.8% | 4.4% |
| Mean | 97.0% | 98.3% |
| Median | 97.0% | 98.1% |
| Interquartile 25% (IQ1) | 95.8% | 97.3% |
| Interquartile 75% (IQ3) | 98.4% | 99.5% |
| Interquartile Range (IQR) | 2.6% | 2.2% |
| Standard Deviation (Sample) | 2.1% | 1.2% |
| Standard Deviation (Population) | 2.1% | 1.2% |
Similar Demographics by 6th Grade
Demographics Similar to U.S. Virgin Islanders by 6th Grade
In terms of 6th grade, the demographic groups most similar to U.S. Virgin Islanders are Jamaican (96.5%, a difference of 0.010%), Immigrants from Ethiopia (96.5%, a difference of 0.010%), Immigrants from Congo (96.5%, a difference of 0.010%), Immigrants from Senegal (96.5%, a difference of 0.020%), and Immigrants from Uruguay (96.5%, a difference of 0.020%).
| Demographics | Rating | Rank | 6th Grade |
| Colombians | 0.9 /100 | #249 | Tragic 96.5% |
| Immigrants | Middle Africa | 0.8 /100 | #250 | Tragic 96.5% |
| Immigrants | Senegal | 0.7 /100 | #251 | Tragic 96.5% |
| Immigrants | Uruguay | 0.6 /100 | #252 | Tragic 96.5% |
| Jamaicans | 0.6 /100 | #253 | Tragic 96.5% |
| Immigrants | Ethiopia | 0.6 /100 | #254 | Tragic 96.5% |
| Immigrants | Congo | 0.6 /100 | #255 | Tragic 96.5% |
| U.S. Virgin Islanders | 0.5 /100 | #256 | Tragic 96.5% |
| Taiwanese | 0.5 /100 | #257 | Tragic 96.5% |
| Immigrants | China | 0.4 /100 | #258 | Tragic 96.4% |
| South Americans | 0.4 /100 | #259 | Tragic 96.4% |
| Peruvians | 0.4 /100 | #260 | Tragic 96.4% |
| Immigrants | Sierra Leone | 0.4 /100 | #261 | Tragic 96.4% |
| Immigrants | Nigeria | 0.3 /100 | #262 | Tragic 96.4% |
| Immigrants | Colombia | 0.3 /100 | #263 | Tragic 96.4% |
Demographics Similar to Turks by 6th Grade
In terms of 6th grade, the demographic groups most similar to Turks are South African (97.5%, a difference of 0.0%), Immigrants from Denmark (97.5%, a difference of 0.020%), Yugoslavian (97.5%, a difference of 0.020%), Choctaw (97.5%, a difference of 0.020%), and Bhutanese (97.5%, a difference of 0.020%).
| Demographics | Rating | Rank | 6th Grade |
| Cree | 98.7 /100 | #93 | Exceptional 97.5% |
| Cypriots | 98.7 /100 | #94 | Exceptional 97.5% |
| Immigrants | Ireland | 98.7 /100 | #95 | Exceptional 97.5% |
| Immigrants | Germany | 98.6 /100 | #96 | Exceptional 97.5% |
| Immigrants | Sweden | 98.6 /100 | #97 | Exceptional 97.5% |
| Immigrants | Denmark | 98.5 /100 | #98 | Exceptional 97.5% |
| Yugoslavians | 98.5 /100 | #99 | Exceptional 97.5% |
| Turks | 98.3 /100 | #100 | Exceptional 97.5% |
| South Africans | 98.2 /100 | #101 | Exceptional 97.5% |
| Choctaw | 98.0 /100 | #102 | Exceptional 97.5% |
| Bhutanese | 98.0 /100 | #103 | Exceptional 97.5% |
| German Russians | 97.9 /100 | #104 | Exceptional 97.5% |
| Cheyenne | 97.9 /100 | #105 | Exceptional 97.5% |
| Menominee | 97.7 /100 | #106 | Exceptional 97.5% |
| Immigrants | Singapore | 97.6 /100 | #107 | Exceptional 97.5% |