U.S. Virgin Islander vs Immigrants from Sri Lanka Doctorate Degree
COMPARE
U.S. Virgin Islander
Immigrants from Sri Lanka
Doctorate Degree
Doctorate Degree Comparison
U.S. Virgin Islanders
Immigrants from Sri Lanka
1.5%
DOCTORATE DEGREE
0.5/ 100
METRIC RATING
268th/ 347
METRIC RANK
2.8%
DOCTORATE DEGREE
100.0/ 100
METRIC RATING
18th/ 347
METRIC RANK
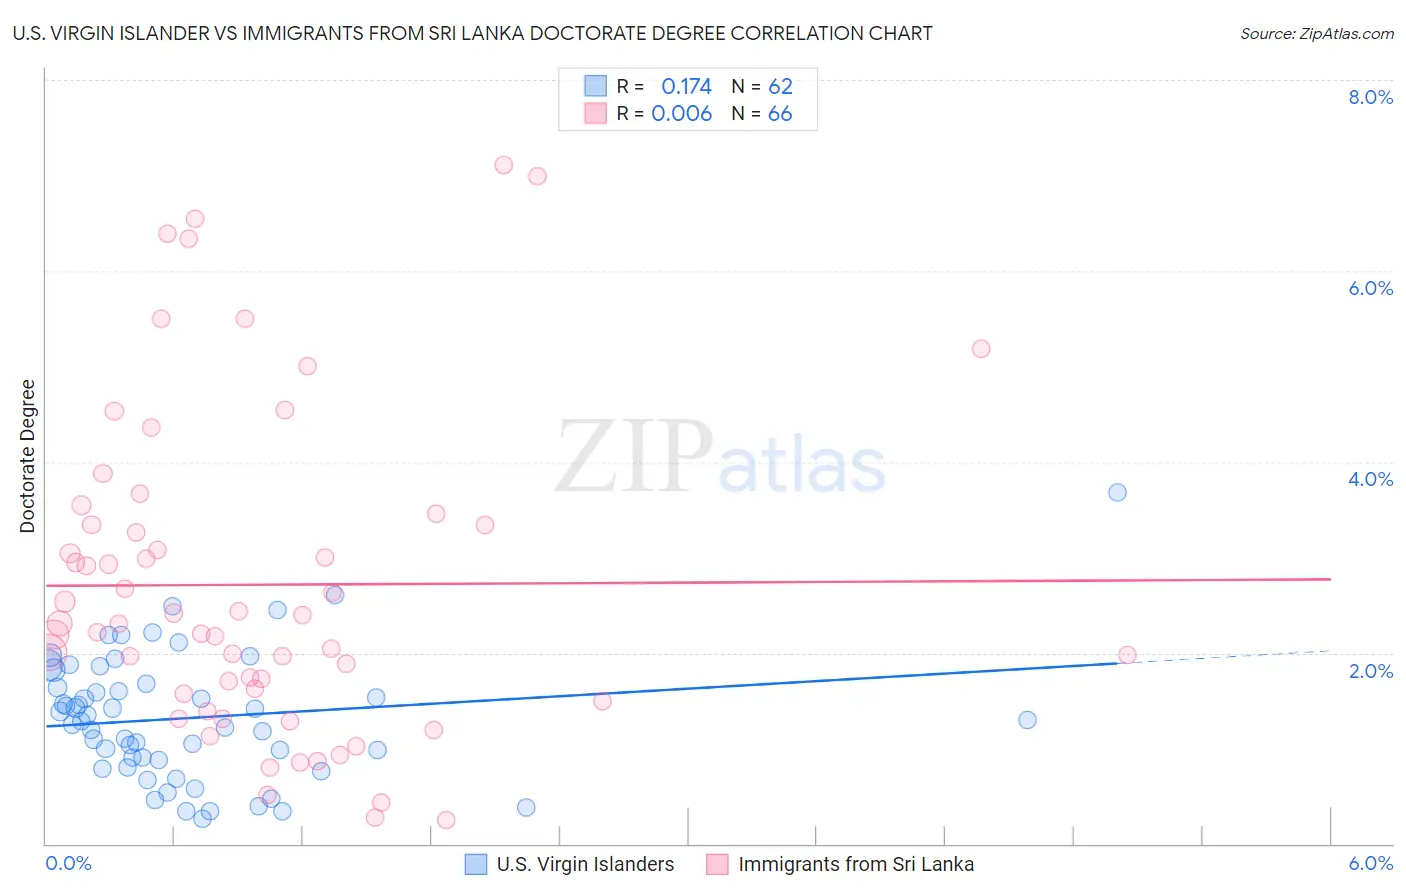
U.S. Virgin Islander vs Immigrants from Sri Lanka Doctorate Degree Correlation Chart
The statistical analysis conducted on geographies consisting of 87,354,838 people shows a poor positive correlation between the proportion of U.S. Virgin Islanders and percentage of population with at least doctorate degree education in the United States with a correlation coefficient (R) of 0.174 and weighted average of 1.5%. Similarly, the statistical analysis conducted on geographies consisting of 149,516,324 people shows no correlation between the proportion of Immigrants from Sri Lanka and percentage of population with at least doctorate degree education in the United States with a correlation coefficient (R) of 0.006 and weighted average of 2.8%, a difference of 89.0%.
Doctorate Degree Correlation Summary
| Measurement | U.S. Virgin Islander | Immigrants from Sri Lanka |
| Minimum | 0.26% | 0.25% |
| Maximum | 3.7% | 7.1% |
| Range | 3.4% | 6.9% |
| Mean | 1.3% | 2.7% |
| Median | 1.3% | 2.3% |
| Interquartile 25% (IQ1) | 0.87% | 1.6% |
| Interquartile 75% (IQ3) | 1.7% | 3.3% |
| Interquartile Range (IQR) | 0.80% | 1.8% |
| Standard Deviation (Sample) | 0.67% | 1.7% |
| Standard Deviation (Population) | 0.66% | 1.7% |
Similar Demographics by Doctorate Degree
Demographics Similar to U.S. Virgin Islanders by Doctorate Degree
In terms of doctorate degree, the demographic groups most similar to U.S. Virgin Islanders are Kiowa (1.5%, a difference of 0.0%), Crow (1.5%, a difference of 0.090%), Salvadoran (1.5%, a difference of 0.11%), Immigrants from Trinidad and Tobago (1.5%, a difference of 0.19%), and Immigrants from Barbados (1.5%, a difference of 0.27%).
| Demographics | Rating | Rank | Doctorate Degree |
| Immigrants | Portugal | 0.8 /100 | #261 | Tragic 1.5% |
| Chickasaw | 0.7 /100 | #262 | Tragic 1.5% |
| Immigrants | Bahamas | 0.7 /100 | #263 | Tragic 1.5% |
| Blackfeet | 0.7 /100 | #264 | Tragic 1.5% |
| Nicaraguans | 0.6 /100 | #265 | Tragic 1.5% |
| Immigrants | Liberia | 0.5 /100 | #266 | Tragic 1.5% |
| Kiowa | 0.5 /100 | #267 | Tragic 1.5% |
| U.S. Virgin Islanders | 0.5 /100 | #268 | Tragic 1.5% |
| Crow | 0.5 /100 | #269 | Tragic 1.5% |
| Salvadorans | 0.5 /100 | #270 | Tragic 1.5% |
| Immigrants | Trinidad and Tobago | 0.5 /100 | #271 | Tragic 1.5% |
| Immigrants | Barbados | 0.4 /100 | #272 | Tragic 1.5% |
| Sioux | 0.4 /100 | #273 | Tragic 1.5% |
| Yaqui | 0.4 /100 | #274 | Tragic 1.5% |
| Aleuts | 0.4 /100 | #275 | Tragic 1.5% |
Demographics Similar to Immigrants from Sri Lanka by Doctorate Degree
In terms of doctorate degree, the demographic groups most similar to Immigrants from Sri Lanka are Immigrants from Australia (2.8%, a difference of 0.24%), Immigrants from Japan (2.8%, a difference of 0.37%), Immigrants from Hong Kong (2.8%, a difference of 0.73%), Eastern European (2.8%, a difference of 0.94%), and Thai (2.8%, a difference of 1.1%).
| Demographics | Rating | Rank | Doctorate Degree |
| Indians (Asian) | 100.0 /100 | #11 | Exceptional 2.9% |
| Immigrants | Belgium | 100.0 /100 | #12 | Exceptional 2.9% |
| Immigrants | Sweden | 100.0 /100 | #13 | Exceptional 2.9% |
| Immigrants | France | 100.0 /100 | #14 | Exceptional 2.9% |
| Immigrants | India | 100.0 /100 | #15 | Exceptional 2.8% |
| Eastern Europeans | 100.0 /100 | #16 | Exceptional 2.8% |
| Immigrants | Australia | 100.0 /100 | #17 | Exceptional 2.8% |
| Immigrants | Sri Lanka | 100.0 /100 | #18 | Exceptional 2.8% |
| Immigrants | Japan | 100.0 /100 | #19 | Exceptional 2.8% |
| Immigrants | Hong Kong | 100.0 /100 | #20 | Exceptional 2.8% |
| Thais | 100.0 /100 | #21 | Exceptional 2.8% |
| Mongolians | 100.0 /100 | #22 | Exceptional 2.8% |
| Immigrants | Denmark | 100.0 /100 | #23 | Exceptional 2.8% |
| Israelis | 100.0 /100 | #24 | Exceptional 2.7% |
| Immigrants | Saudi Arabia | 100.0 /100 | #25 | Exceptional 2.7% |