Ukrainian vs Lithuanian 4 or more Vehicles in Household
COMPARE
Ukrainian
Lithuanian
4 or more Vehicles in Household
4 or more Vehicles in Household Comparison
Ukrainians
Lithuanians
6.3%
4 OR MORE VEHICLES IN HOUSEHOLD
47.6/ 100
METRIC RATING
176th/ 347
METRIC RANK
6.3%
4 OR MORE VEHICLES IN HOUSEHOLD
50.0/ 100
METRIC RATING
174th/ 347
METRIC RANK
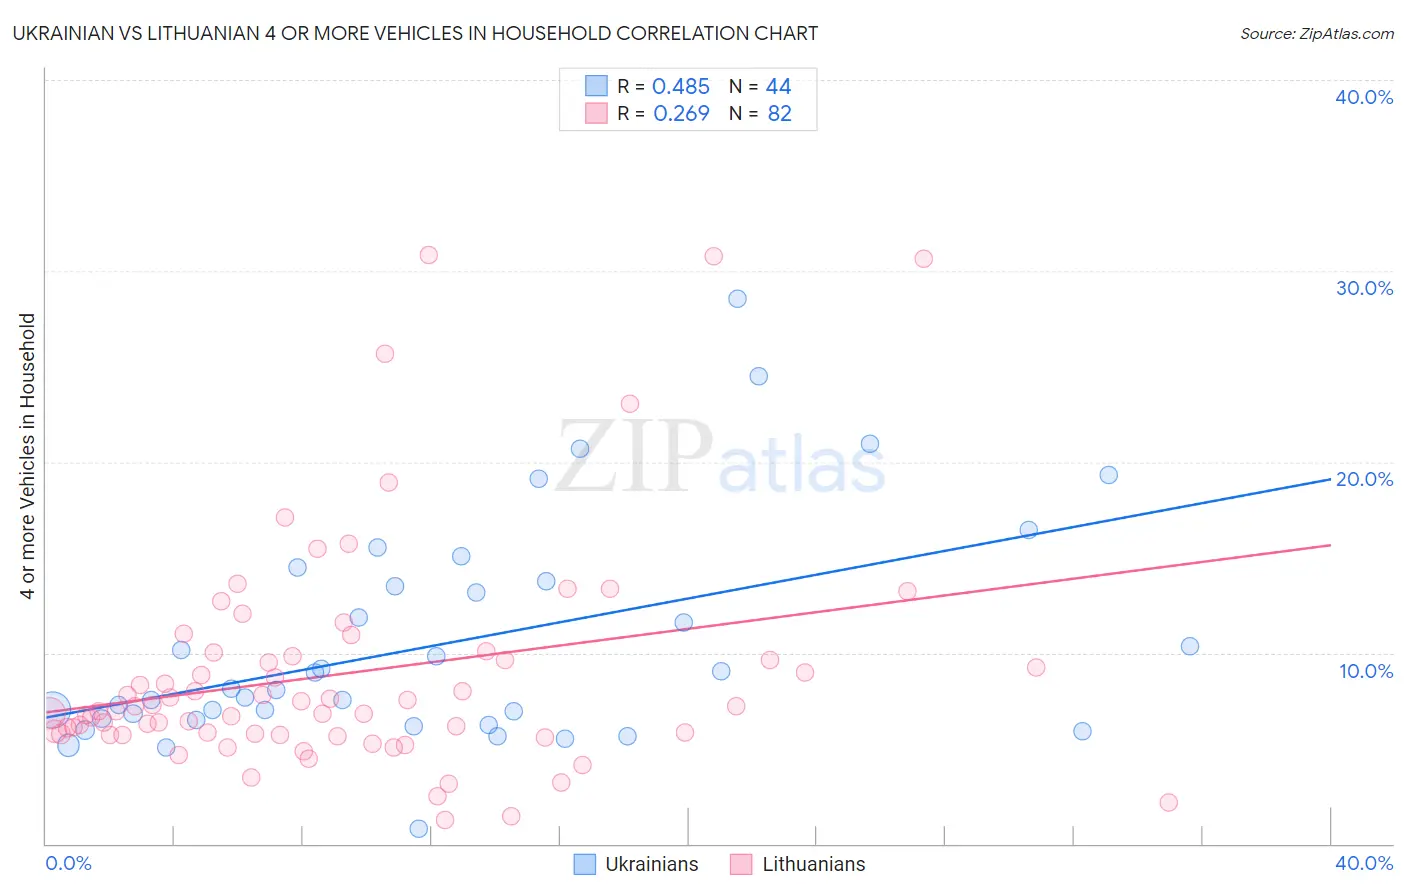
Ukrainian vs Lithuanian 4 or more Vehicles in Household Correlation Chart
The statistical analysis conducted on geographies consisting of 446,444,897 people shows a moderate positive correlation between the proportion of Ukrainians and percentage of households with 4 or more vehicles available in the United States with a correlation coefficient (R) of 0.485 and weighted average of 6.3%. Similarly, the statistical analysis conducted on geographies consisting of 420,091,012 people shows a weak positive correlation between the proportion of Lithuanians and percentage of households with 4 or more vehicles available in the United States with a correlation coefficient (R) of 0.269 and weighted average of 6.3%, a difference of 0.24%.
4 or more Vehicles in Household Correlation Summary
| Measurement | Ukrainian | Lithuanian |
| Minimum | 0.81% | 1.3% |
| Maximum | 28.6% | 30.8% |
| Range | 27.8% | 29.6% |
| Mean | 10.5% | 8.9% |
| Median | 8.1% | 7.1% |
| Interquartile 25% (IQ1) | 6.5% | 5.8% |
| Interquartile 75% (IQ3) | 13.6% | 9.8% |
| Interquartile Range (IQR) | 7.1% | 4.1% |
| Standard Deviation (Sample) | 5.8% | 6.0% |
| Standard Deviation (Population) | 5.8% | 6.0% |
Demographics Similar to Ukrainians and Lithuanians by 4 or more Vehicles in Household
In terms of 4 or more vehicles in household, the demographic groups most similar to Ukrainians are Slovak (6.3%, a difference of 0.070%), Immigrants from Western Europe (6.3%, a difference of 0.12%), Belizean (6.3%, a difference of 0.31%), Slovene (6.3%, a difference of 0.36%), and Immigrants from Lebanon (6.3%, a difference of 0.42%). Similarly, the demographic groups most similar to Lithuanians are Slovene (6.3%, a difference of 0.12%), Immigrants from Western Europe (6.3%, a difference of 0.12%), Immigrants from Lebanon (6.3%, a difference of 0.17%), Immigrants from India (6.3%, a difference of 0.20%), and Immigrants from Syria (6.3%, a difference of 0.28%).
| Demographics | Rating | Rank | 4 or more Vehicles in Household |
| Immigrants | Peru | 59.8 /100 | #165 | Average 6.4% |
| Immigrants | Denmark | 57.8 /100 | #166 | Average 6.4% |
| Poles | 56.9 /100 | #167 | Average 6.4% |
| Lebanese | 55.8 /100 | #168 | Average 6.4% |
| Estonians | 55.1 /100 | #169 | Average 6.4% |
| Immigrants | Syria | 52.8 /100 | #170 | Average 6.3% |
| Immigrants | India | 51.9 /100 | #171 | Average 6.3% |
| Immigrants | Lebanon | 51.7 /100 | #172 | Average 6.3% |
| Slovenes | 51.1 /100 | #173 | Average 6.3% |
| Lithuanians | 50.0 /100 | #174 | Average 6.3% |
| Immigrants | Western Europe | 48.8 /100 | #175 | Average 6.3% |
| Ukrainians | 47.6 /100 | #176 | Average 6.3% |
| Slovaks | 46.9 /100 | #177 | Average 6.3% |
| Belizeans | 44.5 /100 | #178 | Average 6.3% |
| Immigrants | Japan | 43.1 /100 | #179 | Average 6.3% |
| Syrians | 42.0 /100 | #180 | Average 6.3% |
| Yugoslavians | 41.1 /100 | #181 | Average 6.3% |
| South American Indians | 40.7 /100 | #182 | Average 6.3% |
| Immigrants | Burma/Myanmar | 37.5 /100 | #183 | Fair 6.2% |
| Iraqis | 37.3 /100 | #184 | Fair 6.2% |
| Thais | 36.9 /100 | #185 | Fair 6.2% |