Ukrainian vs Immigrants from Lithuania Ambulatory Disability
COMPARE
Ukrainian
Immigrants from Lithuania
Ambulatory Disability
Ambulatory Disability Comparison
Ukrainians
Immigrants from Lithuania
6.2%
AMBULATORY DISABILITY
34.0/ 100
METRIC RATING
189th/ 347
METRIC RANK
5.6%
AMBULATORY DISABILITY
99.8/ 100
METRIC RATING
60th/ 347
METRIC RANK
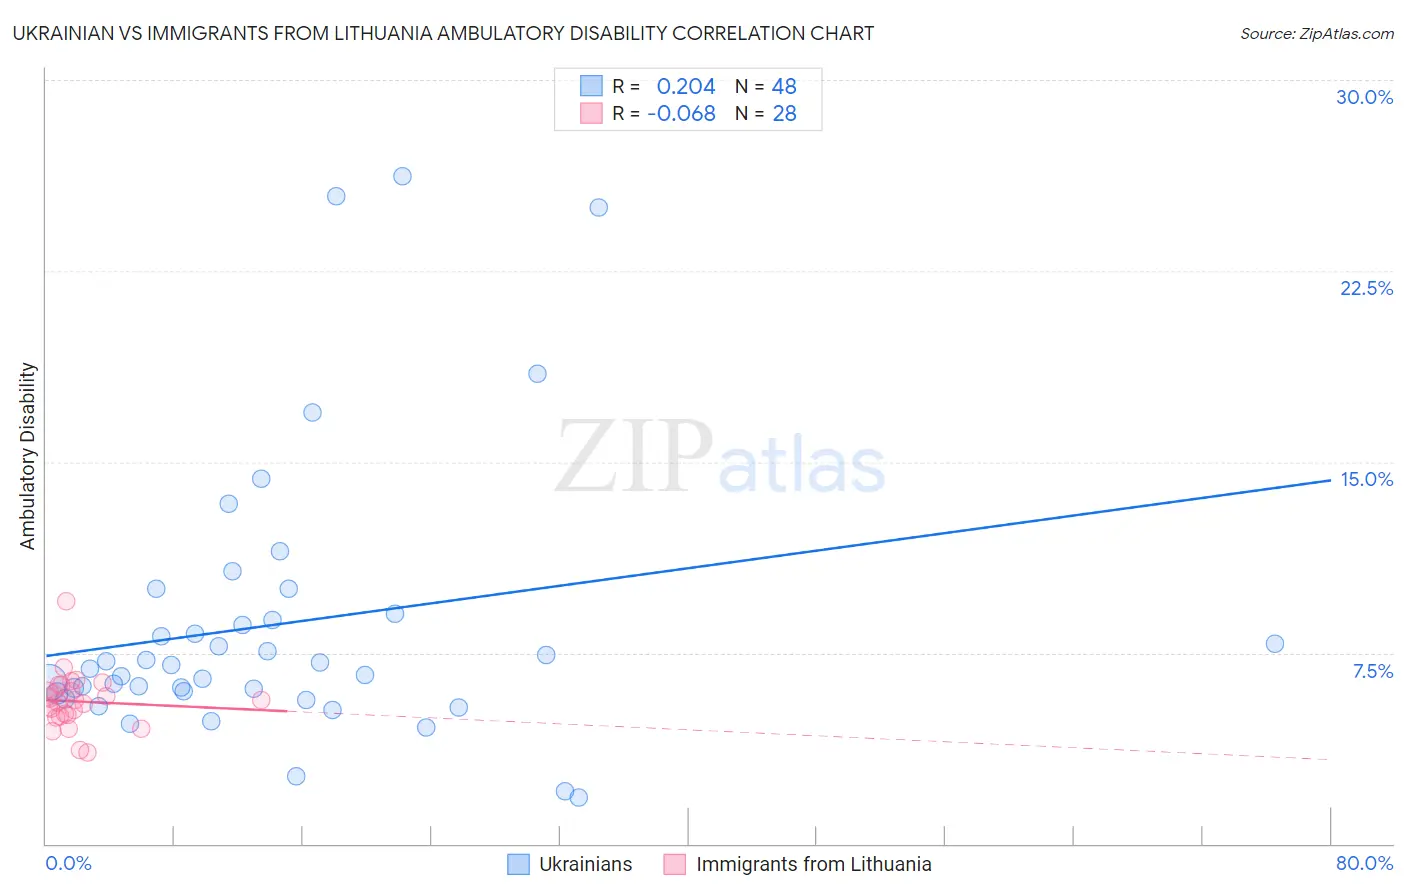
Ukrainian vs Immigrants from Lithuania Ambulatory Disability Correlation Chart
The statistical analysis conducted on geographies consisting of 448,487,424 people shows a weak positive correlation between the proportion of Ukrainians and percentage of population with ambulatory disability in the United States with a correlation coefficient (R) of 0.204 and weighted average of 6.2%. Similarly, the statistical analysis conducted on geographies consisting of 117,713,012 people shows a slight negative correlation between the proportion of Immigrants from Lithuania and percentage of population with ambulatory disability in the United States with a correlation coefficient (R) of -0.068 and weighted average of 5.6%, a difference of 9.6%.
Ambulatory Disability Correlation Summary
| Measurement | Ukrainian | Immigrants from Lithuania |
| Minimum | 1.8% | 3.6% |
| Maximum | 26.2% | 9.5% |
| Range | 24.4% | 5.9% |
| Mean | 8.6% | 5.6% |
| Median | 6.9% | 5.6% |
| Interquartile 25% (IQ1) | 5.9% | 5.0% |
| Interquartile 75% (IQ3) | 8.9% | 6.1% |
| Interquartile Range (IQR) | 3.0% | 1.1% |
| Standard Deviation (Sample) | 5.5% | 1.1% |
| Standard Deviation (Population) | 5.4% | 1.1% |
Similar Demographics by Ambulatory Disability
Demographics Similar to Ukrainians by Ambulatory Disability
In terms of ambulatory disability, the demographic groups most similar to Ukrainians are British (6.2%, a difference of 0.020%), Immigrants from Western Africa (6.2%, a difference of 0.040%), Carpatho Rusyn (6.2%, a difference of 0.080%), Immigrants from Guatemala (6.2%, a difference of 0.12%), and European (6.2%, a difference of 0.13%).
| Demographics | Rating | Rank | Ambulatory Disability |
| Serbians | 42.8 /100 | #182 | Average 6.1% |
| Immigrants | Thailand | 42.2 /100 | #183 | Average 6.1% |
| Immigrants | Ghana | 41.2 /100 | #184 | Average 6.1% |
| Immigrants | Bosnia and Herzegovina | 37.2 /100 | #185 | Fair 6.2% |
| Europeans | 36.2 /100 | #186 | Fair 6.2% |
| Carpatho Rusyns | 35.3 /100 | #187 | Fair 6.2% |
| British | 34.3 /100 | #188 | Fair 6.2% |
| Ukrainians | 34.0 /100 | #189 | Fair 6.2% |
| Immigrants | Western Africa | 33.4 /100 | #190 | Fair 6.2% |
| Immigrants | Guatemala | 31.9 /100 | #191 | Fair 6.2% |
| Immigrants | Western Europe | 31.6 /100 | #192 | Fair 6.2% |
| Guatemalans | 30.0 /100 | #193 | Fair 6.2% |
| Alaska Natives | 29.8 /100 | #194 | Fair 6.2% |
| Belgians | 28.6 /100 | #195 | Fair 6.2% |
| Malaysians | 28.2 /100 | #196 | Fair 6.2% |
Demographics Similar to Immigrants from Lithuania by Ambulatory Disability
In terms of ambulatory disability, the demographic groups most similar to Immigrants from Lithuania are Immigrants from Afghanistan (5.6%, a difference of 0.040%), Immigrants from Zimbabwe (5.6%, a difference of 0.080%), Immigrants from Belgium (5.6%, a difference of 0.12%), Immigrants from Spain (5.6%, a difference of 0.13%), and Immigrants from Brazil (5.6%, a difference of 0.14%).
| Demographics | Rating | Rank | Ambulatory Disability |
| Immigrants | Egypt | 99.8 /100 | #53 | Exceptional 5.6% |
| Immigrants | Eastern Africa | 99.8 /100 | #54 | Exceptional 5.6% |
| Immigrants | Bulgaria | 99.8 /100 | #55 | Exceptional 5.6% |
| Inupiat | 99.8 /100 | #56 | Exceptional 5.6% |
| Immigrants | Brazil | 99.8 /100 | #57 | Exceptional 5.6% |
| Immigrants | Zimbabwe | 99.8 /100 | #58 | Exceptional 5.6% |
| Immigrants | Afghanistan | 99.8 /100 | #59 | Exceptional 5.6% |
| Immigrants | Lithuania | 99.8 /100 | #60 | Exceptional 5.6% |
| Immigrants | Belgium | 99.7 /100 | #61 | Exceptional 5.6% |
| Immigrants | Spain | 99.7 /100 | #62 | Exceptional 5.6% |
| Immigrants | France | 99.7 /100 | #63 | Exceptional 5.6% |
| Laotians | 99.7 /100 | #64 | Exceptional 5.7% |
| Immigrants | Switzerland | 99.7 /100 | #65 | Exceptional 5.7% |
| Israelis | 99.6 /100 | #66 | Exceptional 5.7% |
| Immigrants | Uganda | 99.6 /100 | #67 | Exceptional 5.7% |