Ugandan vs Palestinian 1 or more Vehicles in Household
COMPARE
Ugandan
Palestinian
1 or more Vehicles in Household
1 or more Vehicles in Household Comparison
Ugandans
Palestinians
88.9%
1 OR MORE VEHICLES IN HOUSEHOLD
8.7/ 100
METRIC RATING
218th/ 347
METRIC RANK
91.7%
1 OR MORE VEHICLES IN HOUSEHOLD
99.7/ 100
METRIC RATING
69th/ 347
METRIC RANK
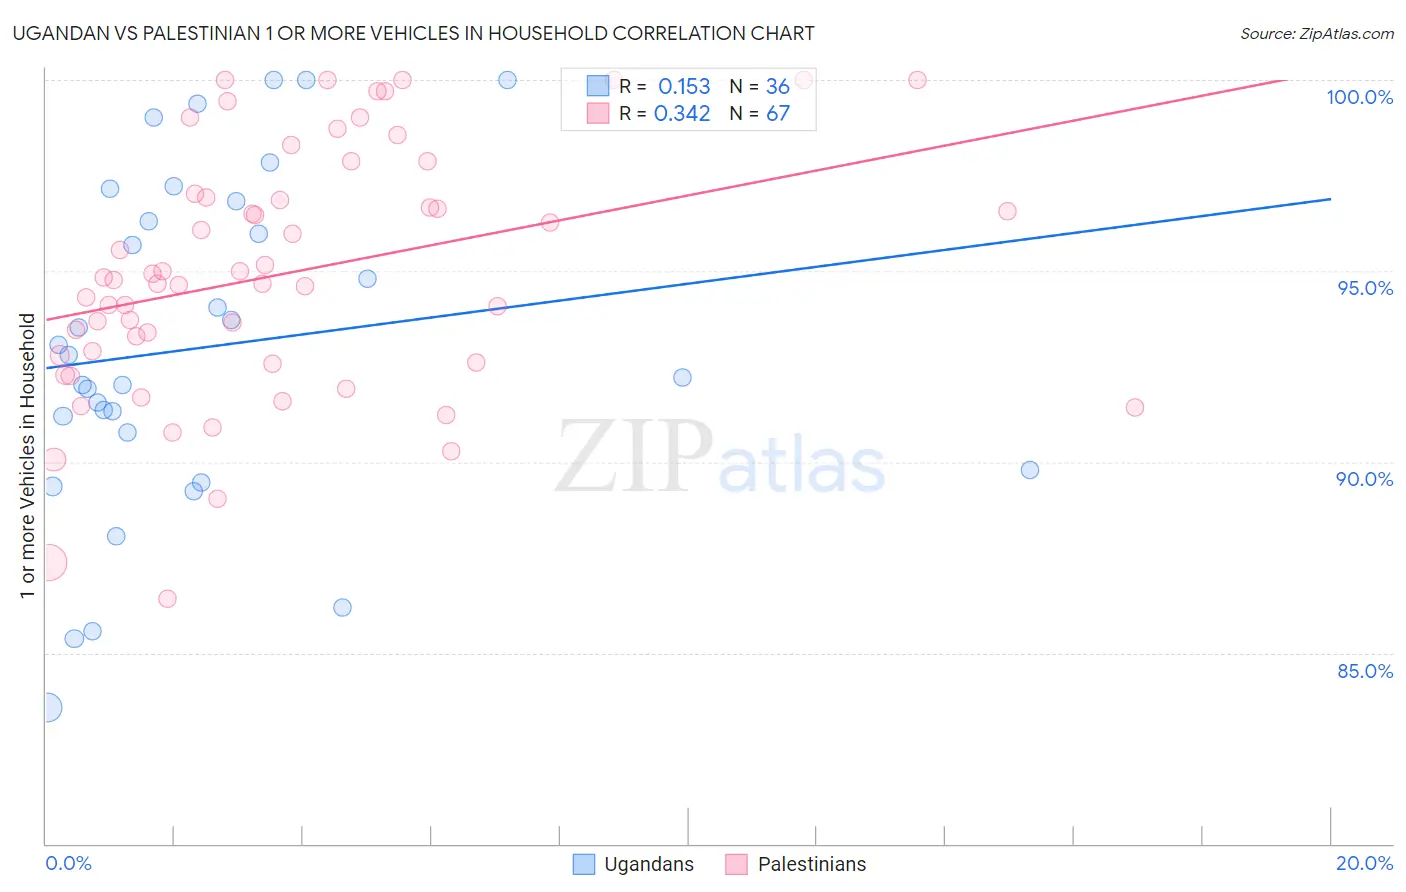
Ugandan vs Palestinian 1 or more Vehicles in Household Correlation Chart
The statistical analysis conducted on geographies consisting of 93,998,632 people shows a poor positive correlation between the proportion of Ugandans and percentage of households with 1 or more vehicles available in the United States with a correlation coefficient (R) of 0.153 and weighted average of 88.9%. Similarly, the statistical analysis conducted on geographies consisting of 216,371,451 people shows a mild positive correlation between the proportion of Palestinians and percentage of households with 1 or more vehicles available in the United States with a correlation coefficient (R) of 0.342 and weighted average of 91.7%, a difference of 3.2%.
1 or more Vehicles in Household Correlation Summary
| Measurement | Ugandan | Palestinian |
| Minimum | 83.6% | 86.4% |
| Maximum | 100.0% | 100.0% |
| Range | 16.4% | 13.6% |
| Mean | 93.0% | 94.9% |
| Median | 92.5% | 94.8% |
| Interquartile 25% (IQ1) | 90.3% | 92.6% |
| Interquartile 75% (IQ3) | 96.6% | 97.0% |
| Interquartile Range (IQR) | 6.3% | 4.4% |
| Standard Deviation (Sample) | 4.4% | 3.3% |
| Standard Deviation (Population) | 4.3% | 3.2% |
Similar Demographics by 1 or more Vehicles in Household
Demographics Similar to Ugandans by 1 or more Vehicles in Household
In terms of 1 or more vehicles in household, the demographic groups most similar to Ugandans are Immigrants from Guatemala (88.9%, a difference of 0.0%), Argentinean (88.9%, a difference of 0.010%), Immigrants from Zaire (88.8%, a difference of 0.030%), Immigrants from Argentina (88.9%, a difference of 0.040%), and Peruvian (88.8%, a difference of 0.040%).
| Demographics | Rating | Rank | 1 or more Vehicles in Household |
| Sierra Leoneans | 13.0 /100 | #211 | Poor 89.0% |
| Somalis | 12.8 /100 | #212 | Poor 89.0% |
| Immigrants | Western Asia | 12.3 /100 | #213 | Poor 89.0% |
| Immigrants | Hungary | 11.9 /100 | #214 | Poor 89.0% |
| Immigrants | Sri Lanka | 10.2 /100 | #215 | Poor 88.9% |
| Immigrants | Argentina | 9.4 /100 | #216 | Tragic 88.9% |
| Argentineans | 8.8 /100 | #217 | Tragic 88.9% |
| Ugandans | 8.7 /100 | #218 | Tragic 88.9% |
| Immigrants | Guatemala | 8.6 /100 | #219 | Tragic 88.9% |
| Immigrants | Zaire | 8.1 /100 | #220 | Tragic 88.8% |
| Peruvians | 7.9 /100 | #221 | Tragic 88.8% |
| Uruguayans | 7.0 /100 | #222 | Tragic 88.8% |
| Immigrants | South America | 7.0 /100 | #223 | Tragic 88.8% |
| Immigrants | Hong Kong | 6.2 /100 | #224 | Tragic 88.7% |
| Cree | 6.0 /100 | #225 | Tragic 88.7% |
Demographics Similar to Palestinians by 1 or more Vehicles in Household
In terms of 1 or more vehicles in household, the demographic groups most similar to Palestinians are Lithuanian (91.7%, a difference of 0.020%), Immigrants from Scotland (91.8%, a difference of 0.040%), Polish (91.7%, a difference of 0.040%), Cajun (91.7%, a difference of 0.040%), and Immigrants from Iran (91.7%, a difference of 0.050%).
| Demographics | Rating | Rank | 1 or more Vehicles in Household |
| Thais | 99.8 /100 | #62 | Exceptional 91.9% |
| Chinese | 99.8 /100 | #63 | Exceptional 91.9% |
| Croatians | 99.8 /100 | #64 | Exceptional 91.9% |
| Immigrants | Laos | 99.8 /100 | #65 | Exceptional 91.8% |
| Canadians | 99.8 /100 | #66 | Exceptional 91.8% |
| Spaniards | 99.8 /100 | #67 | Exceptional 91.8% |
| Immigrants | Scotland | 99.7 /100 | #68 | Exceptional 91.8% |
| Palestinians | 99.7 /100 | #69 | Exceptional 91.7% |
| Lithuanians | 99.7 /100 | #70 | Exceptional 91.7% |
| Poles | 99.7 /100 | #71 | Exceptional 91.7% |
| Cajuns | 99.7 /100 | #72 | Exceptional 91.7% |
| Immigrants | Iran | 99.7 /100 | #73 | Exceptional 91.7% |
| Immigrants | Lebanon | 99.6 /100 | #74 | Exceptional 91.6% |
| Portuguese | 99.5 /100 | #75 | Exceptional 91.6% |
| Cubans | 99.5 /100 | #76 | Exceptional 91.5% |