Ugandan vs Yuman Unemployment
COMPARE
Ugandan
Yuman
Unemployment
Unemployment Comparison
Ugandans
Yuman
5.4%
UNEMPLOYMENT
18.0/ 100
METRIC RATING
212th/ 347
METRIC RANK
9.1%
UNEMPLOYMENT
0.0/ 100
METRIC RATING
343rd/ 347
METRIC RANK
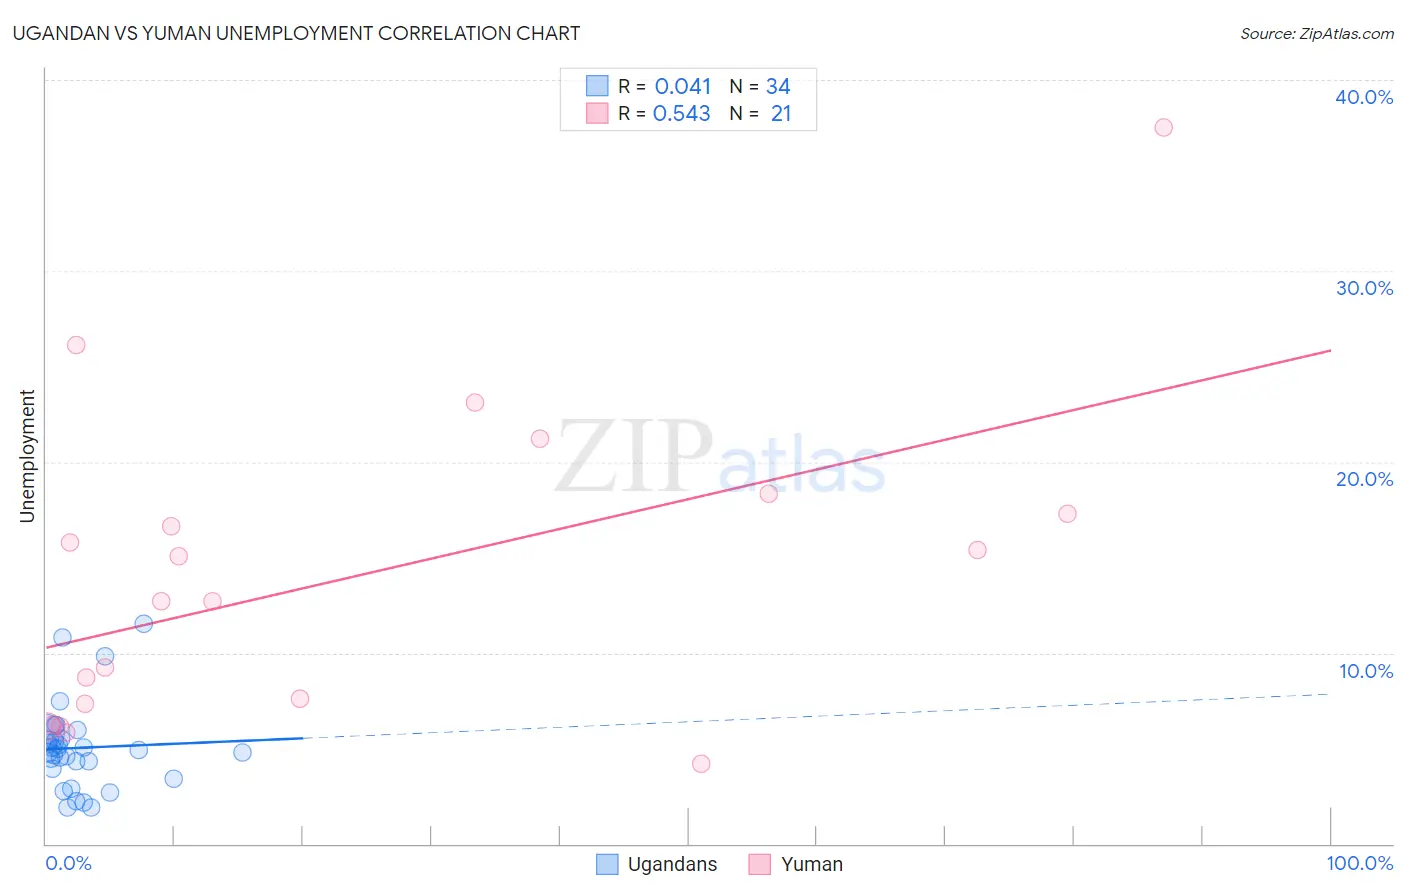
Ugandan vs Yuman Unemployment Correlation Chart
The statistical analysis conducted on geographies consisting of 94,004,444 people shows no correlation between the proportion of Ugandans and unemployment in the United States with a correlation coefficient (R) of 0.041 and weighted average of 5.4%. Similarly, the statistical analysis conducted on geographies consisting of 40,662,591 people shows a substantial positive correlation between the proportion of Yuman and unemployment in the United States with a correlation coefficient (R) of 0.543 and weighted average of 9.1%, a difference of 68.5%.
Unemployment Correlation Summary
| Measurement | Ugandan | Yuman |
| Minimum | 1.9% | 4.2% |
| Maximum | 11.5% | 37.5% |
| Range | 9.6% | 33.3% |
| Mean | 5.0% | 14.0% |
| Median | 4.8% | 12.7% |
| Interquartile 25% (IQ1) | 3.9% | 6.8% |
| Interquartile 75% (IQ3) | 5.5% | 17.8% |
| Interquartile Range (IQR) | 1.6% | 11.0% |
| Standard Deviation (Sample) | 2.2% | 8.3% |
| Standard Deviation (Population) | 2.2% | 8.1% |
Similar Demographics by Unemployment
Demographics Similar to Ugandans by Unemployment
In terms of unemployment, the demographic groups most similar to Ugandans are Iraqi (5.4%, a difference of 0.010%), Immigrants from Iraq (5.4%, a difference of 0.060%), Immigrants from Iran (5.4%, a difference of 0.080%), Portuguese (5.4%, a difference of 0.11%), and Creek (5.4%, a difference of 0.14%).
| Demographics | Rating | Rank | Unemployment |
| Native Hawaiians | 24.1 /100 | #205 | Fair 5.3% |
| Immigrants | Peru | 22.7 /100 | #206 | Fair 5.4% |
| Creek | 19.4 /100 | #207 | Poor 5.4% |
| Portuguese | 19.0 /100 | #208 | Poor 5.4% |
| Immigrants | Iran | 18.8 /100 | #209 | Poor 5.4% |
| Immigrants | Iraq | 18.6 /100 | #210 | Poor 5.4% |
| Iraqis | 18.1 /100 | #211 | Poor 5.4% |
| Ugandans | 18.0 /100 | #212 | Poor 5.4% |
| Immigrants | Middle Africa | 15.3 /100 | #213 | Poor 5.4% |
| Immigrants | Costa Rica | 15.2 /100 | #214 | Poor 5.4% |
| Delaware | 14.7 /100 | #215 | Poor 5.4% |
| Immigrants | South America | 13.5 /100 | #216 | Poor 5.4% |
| Immigrants | Albania | 13.5 /100 | #217 | Poor 5.4% |
| Choctaw | 12.7 /100 | #218 | Poor 5.4% |
| Bangladeshis | 11.2 /100 | #219 | Poor 5.4% |
Demographics Similar to Yuman by Unemployment
In terms of unemployment, the demographic groups most similar to Yuman are Hopi (8.9%, a difference of 1.7%), Tohono O'odham (8.9%, a difference of 2.1%), Puerto Rican (8.4%, a difference of 7.7%), Arapaho (9.8%, a difference of 8.4%), and Navajo (8.4%, a difference of 8.5%).
| Demographics | Rating | Rank | Unemployment |
| Immigrants | Dominican Republic | 0.0 /100 | #333 | Tragic 7.4% |
| Apache | 0.0 /100 | #334 | Tragic 7.4% |
| Alaskan Athabascans | 0.0 /100 | #335 | Tragic 7.7% |
| Immigrants | Yemen | 0.0 /100 | #336 | Tragic 7.7% |
| Cheyenne | 0.0 /100 | #337 | Tragic 8.0% |
| Pima | 0.0 /100 | #338 | Tragic 8.2% |
| Navajo | 0.0 /100 | #339 | Tragic 8.4% |
| Puerto Ricans | 0.0 /100 | #340 | Tragic 8.4% |
| Tohono O'odham | 0.0 /100 | #341 | Tragic 8.9% |
| Hopi | 0.0 /100 | #342 | Tragic 8.9% |
| Yuman | 0.0 /100 | #343 | Tragic 9.1% |
| Arapaho | 0.0 /100 | #344 | Tragic 9.8% |
| Inupiat | 0.0 /100 | #345 | Tragic 10.1% |
| Crow | 0.0 /100 | #346 | Tragic 11.1% |
| Yup'ik | 0.0 /100 | #347 | Tragic 13.6% |