Ugandan vs Yuman Disability Age Under 5
COMPARE
Ugandan
Yuman
Disability Age Under 5
Disability Age Under 5 Comparison
Ugandans
Yuman
1.1%
DISABILITY AGE UNDER 5
97.5/ 100
METRIC RATING
87th/ 347
METRIC RANK
0.95%
DISABILITY AGE UNDER 5
100.0/ 100
METRIC RATING
14th/ 347
METRIC RANK
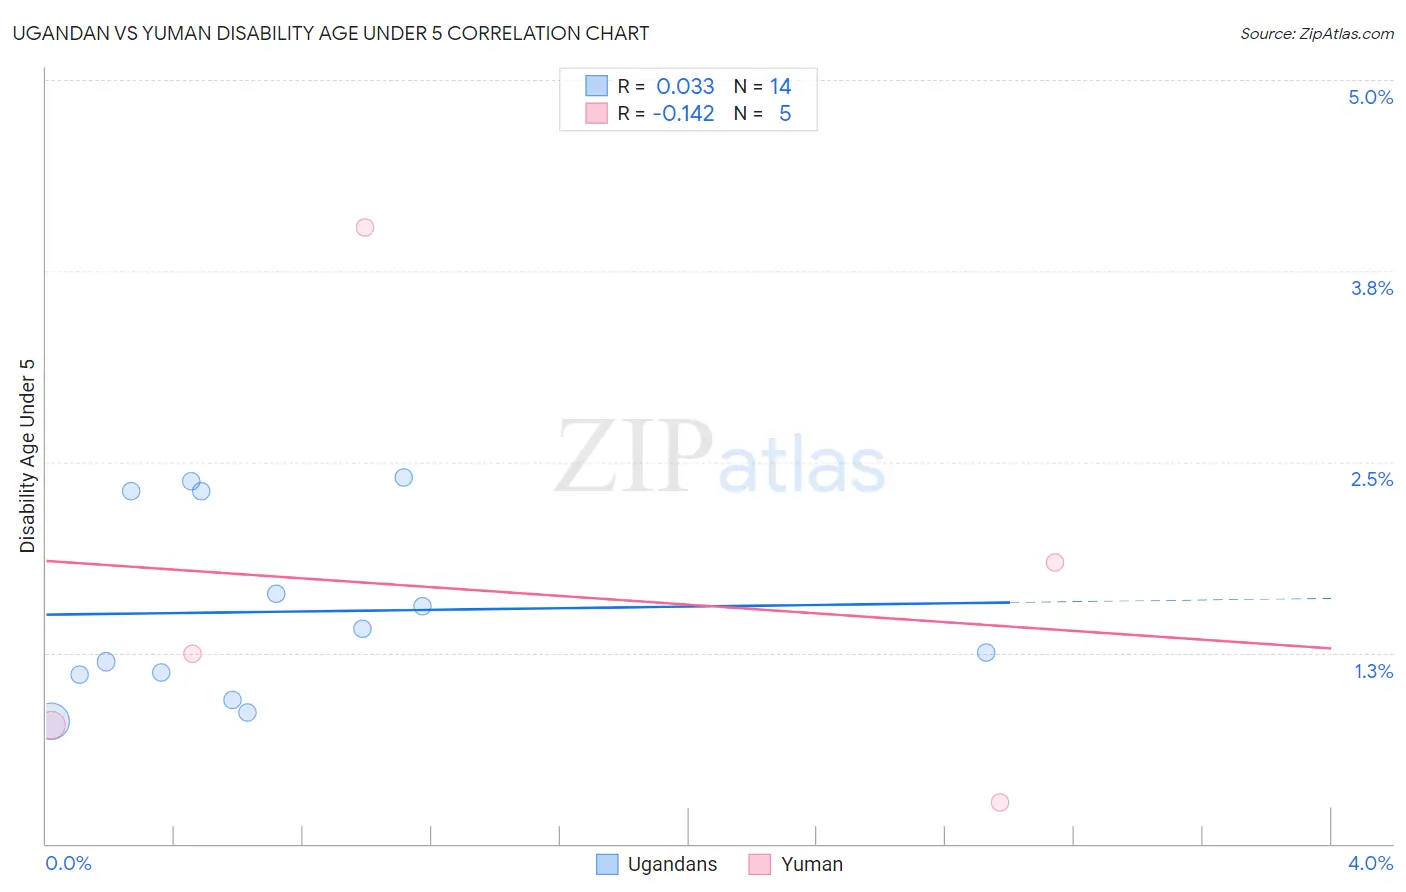
Ugandan vs Yuman Disability Age Under 5 Correlation Chart
The statistical analysis conducted on geographies consisting of 75,065,074 people shows no correlation between the proportion of Ugandans and percentage of population with a disability under the age of 5 in the United States with a correlation coefficient (R) of 0.033 and weighted average of 1.1%. Similarly, the statistical analysis conducted on geographies consisting of 35,883,656 people shows a poor negative correlation between the proportion of Yuman and percentage of population with a disability under the age of 5 in the United States with a correlation coefficient (R) of -0.142 and weighted average of 0.95%, a difference of 20.1%.
Disability Age Under 5 Correlation Summary
| Measurement | Ugandan | Yuman |
| Minimum | 0.80% | 0.27% |
| Maximum | 2.4% | 4.0% |
| Range | 1.6% | 3.8% |
| Mean | 1.5% | 1.6% |
| Median | 1.3% | 1.2% |
| Interquartile 25% (IQ1) | 1.1% | 0.52% |
| Interquartile 75% (IQ3) | 2.3% | 2.9% |
| Interquartile Range (IQR) | 1.2% | 2.4% |
| Standard Deviation (Sample) | 0.59% | 1.5% |
| Standard Deviation (Population) | 0.57% | 1.3% |
Similar Demographics by Disability Age Under 5
Demographics Similar to Ugandans by Disability Age Under 5
In terms of disability age under 5, the demographic groups most similar to Ugandans are Okinawan (1.1%, a difference of 0.020%), Immigrants from Dominican Republic (1.1%, a difference of 0.020%), Sudanese (1.1%, a difference of 0.14%), Immigrants from Zaire (1.1%, a difference of 0.22%), and Ethiopian (1.1%, a difference of 0.31%).
| Demographics | Rating | Rank | Disability Age Under 5 |
| Immigrants | Trinidad and Tobago | 98.0 /100 | #80 | Exceptional 1.1% |
| Turks | 98.0 /100 | #81 | Exceptional 1.1% |
| Immigrants | Jordan | 97.9 /100 | #82 | Exceptional 1.1% |
| Immigrants | Syria | 97.9 /100 | #83 | Exceptional 1.1% |
| Immigrants | Zaire | 97.8 /100 | #84 | Exceptional 1.1% |
| Sudanese | 97.7 /100 | #85 | Exceptional 1.1% |
| Okinawans | 97.6 /100 | #86 | Exceptional 1.1% |
| Ugandans | 97.5 /100 | #87 | Exceptional 1.1% |
| Immigrants | Dominican Republic | 97.5 /100 | #88 | Exceptional 1.1% |
| Ethiopians | 97.2 /100 | #89 | Exceptional 1.1% |
| Chinese | 97.2 /100 | #90 | Exceptional 1.1% |
| Albanians | 97.2 /100 | #91 | Exceptional 1.1% |
| Immigrants | Cuba | 97.0 /100 | #92 | Exceptional 1.1% |
| Spanish Americans | 96.9 /100 | #93 | Exceptional 1.1% |
| Sri Lankans | 96.8 /100 | #94 | Exceptional 1.1% |
Demographics Similar to Yuman by Disability Age Under 5
In terms of disability age under 5, the demographic groups most similar to Yuman are Immigrants from Hong Kong (0.95%, a difference of 0.030%), Soviet Union (0.95%, a difference of 0.080%), Immigrants from Grenada (0.94%, a difference of 0.24%), Afghan (0.94%, a difference of 0.27%), and Marshallese (0.94%, a difference of 1.0%).
| Demographics | Rating | Rank | Disability Age Under 5 |
| Immigrants | Afghanistan | 100.0 /100 | #7 | Exceptional 0.91% |
| Immigrants | Yemen | 100.0 /100 | #8 | Exceptional 0.91% |
| Immigrants | Fiji | 100.0 /100 | #9 | Exceptional 0.92% |
| Marshallese | 100.0 /100 | #10 | Exceptional 0.94% |
| Afghans | 100.0 /100 | #11 | Exceptional 0.94% |
| Immigrants | Grenada | 100.0 /100 | #12 | Exceptional 0.94% |
| Soviet Union | 100.0 /100 | #13 | Exceptional 0.95% |
| Yuman | 100.0 /100 | #14 | Exceptional 0.95% |
| Immigrants | Hong Kong | 100.0 /100 | #15 | Exceptional 0.95% |
| Immigrants | Israel | 100.0 /100 | #16 | Exceptional 0.96% |
| Immigrants | China | 100.0 /100 | #17 | Exceptional 0.96% |
| Immigrants | Barbados | 100.0 /100 | #18 | Exceptional 0.97% |
| Puget Sound Salish | 100.0 /100 | #19 | Exceptional 0.97% |
| Nepalese | 100.0 /100 | #20 | Exceptional 0.97% |
| British West Indians | 100.0 /100 | #21 | Exceptional 0.99% |