Ugandan vs Immigrants from Canada 1 or more Vehicles in Household
COMPARE
Ugandan
Immigrants from Canada
1 or more Vehicles in Household
1 or more Vehicles in Household Comparison
Ugandans
Immigrants from Canada
88.9%
1 OR MORE VEHICLES IN HOUSEHOLD
8.7/ 100
METRIC RATING
218th/ 347
METRIC RANK
91.4%
1 OR MORE VEHICLES IN HOUSEHOLD
99.2/ 100
METRIC RATING
90th/ 347
METRIC RANK
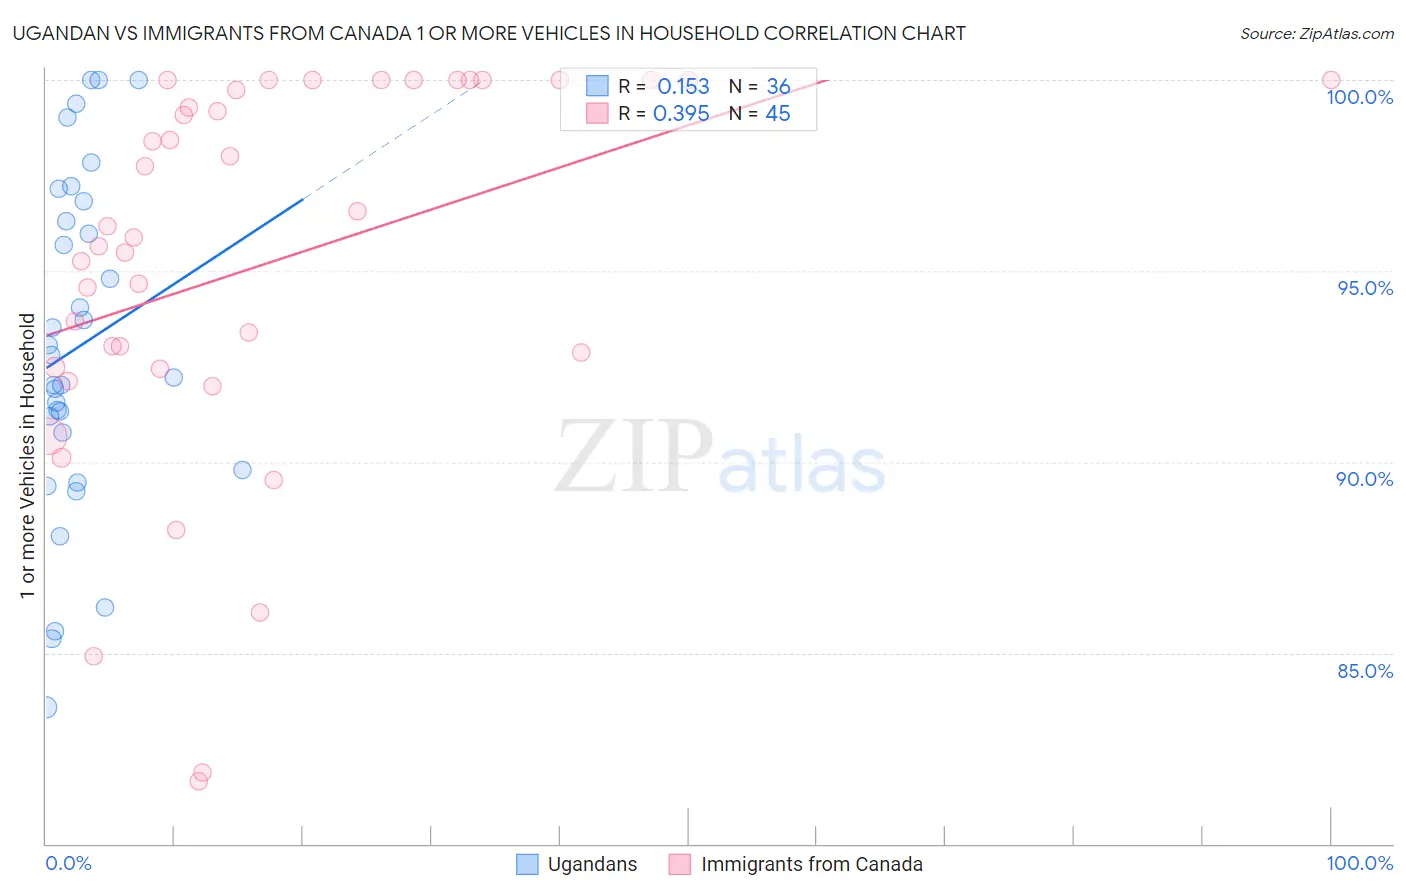
Ugandan vs Immigrants from Canada 1 or more Vehicles in Household Correlation Chart
The statistical analysis conducted on geographies consisting of 93,998,632 people shows a poor positive correlation between the proportion of Ugandans and percentage of households with 1 or more vehicles available in the United States with a correlation coefficient (R) of 0.153 and weighted average of 88.9%. Similarly, the statistical analysis conducted on geographies consisting of 459,177,066 people shows a mild positive correlation between the proportion of Immigrants from Canada and percentage of households with 1 or more vehicles available in the United States with a correlation coefficient (R) of 0.395 and weighted average of 91.4%, a difference of 2.8%.
1 or more Vehicles in Household Correlation Summary
| Measurement | Ugandan | Immigrants from Canada |
| Minimum | 83.6% | 81.6% |
| Maximum | 100.0% | 100.0% |
| Range | 16.4% | 18.4% |
| Mean | 93.0% | 95.2% |
| Median | 92.5% | 95.9% |
| Interquartile 25% (IQ1) | 90.3% | 92.5% |
| Interquartile 75% (IQ3) | 96.6% | 100.0% |
| Interquartile Range (IQR) | 6.3% | 7.5% |
| Standard Deviation (Sample) | 4.4% | 5.0% |
| Standard Deviation (Population) | 4.3% | 5.0% |
Similar Demographics by 1 or more Vehicles in Household
Demographics Similar to Ugandans by 1 or more Vehicles in Household
In terms of 1 or more vehicles in household, the demographic groups most similar to Ugandans are Immigrants from Guatemala (88.9%, a difference of 0.0%), Argentinean (88.9%, a difference of 0.010%), Immigrants from Zaire (88.8%, a difference of 0.030%), Immigrants from Argentina (88.9%, a difference of 0.040%), and Peruvian (88.8%, a difference of 0.040%).
| Demographics | Rating | Rank | 1 or more Vehicles in Household |
| Sierra Leoneans | 13.0 /100 | #211 | Poor 89.0% |
| Somalis | 12.8 /100 | #212 | Poor 89.0% |
| Immigrants | Western Asia | 12.3 /100 | #213 | Poor 89.0% |
| Immigrants | Hungary | 11.9 /100 | #214 | Poor 89.0% |
| Immigrants | Sri Lanka | 10.2 /100 | #215 | Poor 88.9% |
| Immigrants | Argentina | 9.4 /100 | #216 | Tragic 88.9% |
| Argentineans | 8.8 /100 | #217 | Tragic 88.9% |
| Ugandans | 8.7 /100 | #218 | Tragic 88.9% |
| Immigrants | Guatemala | 8.6 /100 | #219 | Tragic 88.9% |
| Immigrants | Zaire | 8.1 /100 | #220 | Tragic 88.8% |
| Peruvians | 7.9 /100 | #221 | Tragic 88.8% |
| Uruguayans | 7.0 /100 | #222 | Tragic 88.8% |
| Immigrants | South America | 7.0 /100 | #223 | Tragic 88.8% |
| Immigrants | Hong Kong | 6.2 /100 | #224 | Tragic 88.7% |
| Cree | 6.0 /100 | #225 | Tragic 88.7% |
Demographics Similar to Immigrants from Canada by 1 or more Vehicles in Household
In terms of 1 or more vehicles in household, the demographic groups most similar to Immigrants from Canada are Spanish American (91.4%, a difference of 0.0%), Bangladeshi (91.4%, a difference of 0.0%), Immigrants from Jordan (91.4%, a difference of 0.0%), Immigrants from Germany (91.4%, a difference of 0.010%), and Bhutanese (91.4%, a difference of 0.010%).
| Demographics | Rating | Rank | 1 or more Vehicles in Household |
| Immigrants | England | 99.3 /100 | #83 | Exceptional 91.4% |
| Jordanians | 99.3 /100 | #84 | Exceptional 91.4% |
| Tsimshian | 99.3 /100 | #85 | Exceptional 91.4% |
| Osage | 99.2 /100 | #86 | Exceptional 91.4% |
| Immigrants | Germany | 99.2 /100 | #87 | Exceptional 91.4% |
| Spanish Americans | 99.2 /100 | #88 | Exceptional 91.4% |
| Bangladeshis | 99.2 /100 | #89 | Exceptional 91.4% |
| Immigrants | Canada | 99.2 /100 | #90 | Exceptional 91.4% |
| Immigrants | Jordan | 99.2 /100 | #91 | Exceptional 91.4% |
| Bhutanese | 99.2 /100 | #92 | Exceptional 91.4% |
| Immigrants | North America | 99.2 /100 | #93 | Exceptional 91.4% |
| Immigrants | Cuba | 99.1 /100 | #94 | Exceptional 91.3% |
| Austrians | 99.0 /100 | #95 | Exceptional 91.3% |
| Potawatomi | 99.0 /100 | #96 | Exceptional 91.3% |
| Pakistanis | 99.0 /100 | #97 | Exceptional 91.3% |