Immigrants from Fiji vs Laotian 2 or more Vehicles in Household
COMPARE
Immigrants from Fiji
Laotian
2 or more Vehicles in Household
2 or more Vehicles in Household Comparison
Immigrants from Fiji
Laotians
62.3%
2 OR MORE VEHICLES IN HOUSEHOLD
100.0/ 100
METRIC RATING
5th/ 347
METRIC RANK
58.6%
2 OR MORE VEHICLES IN HOUSEHOLD
99.7/ 100
METRIC RATING
67th/ 347
METRIC RANK
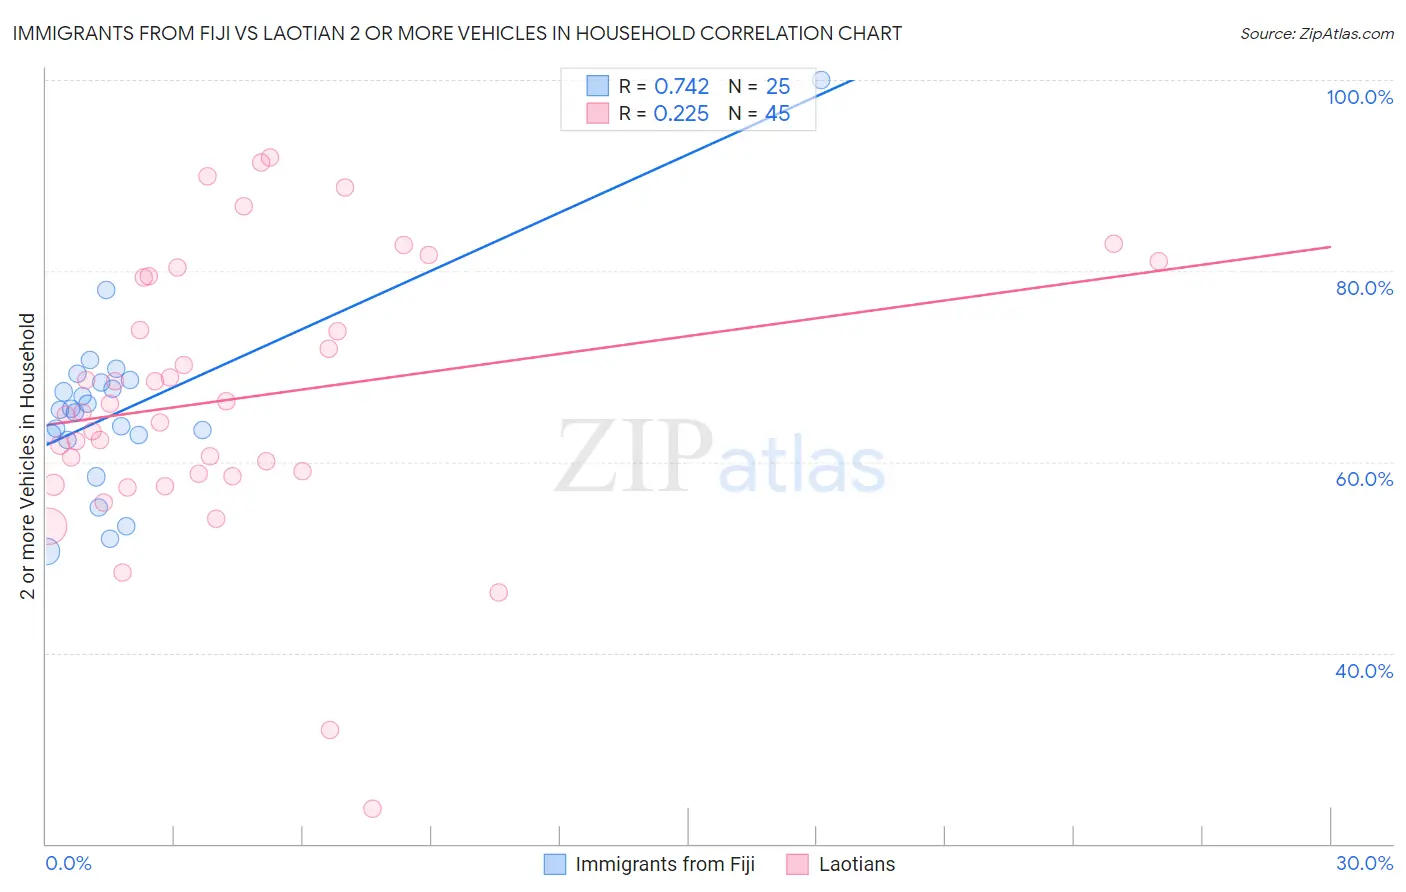
Immigrants from Fiji vs Laotian 2 or more Vehicles in Household Correlation Chart
The statistical analysis conducted on geographies consisting of 93,754,900 people shows a strong positive correlation between the proportion of Immigrants from Fiji and percentage of households with 2 or more vehicles available in the United States with a correlation coefficient (R) of 0.742 and weighted average of 62.3%. Similarly, the statistical analysis conducted on geographies consisting of 224,647,130 people shows a weak positive correlation between the proportion of Laotians and percentage of households with 2 or more vehicles available in the United States with a correlation coefficient (R) of 0.225 and weighted average of 58.6%, a difference of 6.4%.
2 or more Vehicles in Household Correlation Summary
| Measurement | Immigrants from Fiji | Laotian |
| Minimum | 50.6% | 23.7% |
| Maximum | 100.0% | 91.9% |
| Range | 49.4% | 68.2% |
| Mean | 65.5% | 66.6% |
| Median | 65.5% | 65.2% |
| Interquartile 25% (IQ1) | 62.6% | 58.6% |
| Interquartile 75% (IQ3) | 68.4% | 79.4% |
| Interquartile Range (IQR) | 5.9% | 20.8% |
| Standard Deviation (Sample) | 9.5% | 14.5% |
| Standard Deviation (Population) | 9.3% | 14.3% |
Similar Demographics by 2 or more Vehicles in Household
Demographics Similar to Immigrants from Fiji by 2 or more Vehicles in Household
In terms of 2 or more vehicles in household, the demographic groups most similar to Immigrants from Fiji are Scandinavian (62.1%, a difference of 0.34%), Puget Sound Salish (62.1%, a difference of 0.40%), English (61.9%, a difference of 0.67%), Swedish (61.8%, a difference of 0.74%), and Norwegian (62.8%, a difference of 0.87%).
| Demographics | Rating | Rank | 2 or more Vehicles in Household |
| Yakama | 100.0 /100 | #1 | Exceptional 64.9% |
| Tongans | 100.0 /100 | #2 | Exceptional 63.5% |
| Danes | 100.0 /100 | #3 | Exceptional 63.3% |
| Norwegians | 100.0 /100 | #4 | Exceptional 62.8% |
| Immigrants | Fiji | 100.0 /100 | #5 | Exceptional 62.3% |
| Scandinavians | 100.0 /100 | #6 | Exceptional 62.1% |
| Puget Sound Salish | 100.0 /100 | #7 | Exceptional 62.1% |
| English | 100.0 /100 | #8 | Exceptional 61.9% |
| Swedes | 100.0 /100 | #9 | Exceptional 61.8% |
| Mexicans | 100.0 /100 | #10 | Exceptional 61.7% |
| Dutch | 100.0 /100 | #11 | Exceptional 61.6% |
| Germans | 100.0 /100 | #12 | Exceptional 61.6% |
| Samoans | 100.0 /100 | #13 | Exceptional 61.5% |
| Czechs | 100.0 /100 | #14 | Exceptional 61.5% |
| Nepalese | 100.0 /100 | #15 | Exceptional 61.4% |
Demographics Similar to Laotians by 2 or more Vehicles in Household
In terms of 2 or more vehicles in household, the demographic groups most similar to Laotians are Canadian (58.6%, a difference of 0.010%), Immigrants from Central America (58.6%, a difference of 0.020%), Croatian (58.6%, a difference of 0.020%), Portuguese (58.6%, a difference of 0.070%), and Pennsylvania German (58.5%, a difference of 0.13%).
| Demographics | Rating | Rank | 2 or more Vehicles in Household |
| French Canadians | 99.8 /100 | #60 | Exceptional 58.9% |
| Osage | 99.8 /100 | #61 | Exceptional 58.8% |
| Immigrants | Nonimmigrants | 99.8 /100 | #62 | Exceptional 58.8% |
| Mexican American Indians | 99.8 /100 | #63 | Exceptional 58.7% |
| Portuguese | 99.7 /100 | #64 | Exceptional 58.6% |
| Immigrants | Central America | 99.7 /100 | #65 | Exceptional 58.6% |
| Croatians | 99.7 /100 | #66 | Exceptional 58.6% |
| Laotians | 99.7 /100 | #67 | Exceptional 58.6% |
| Canadians | 99.7 /100 | #68 | Exceptional 58.6% |
| Pennsylvania Germans | 99.7 /100 | #69 | Exceptional 58.5% |
| Italians | 99.6 /100 | #70 | Exceptional 58.4% |
| Bangladeshis | 99.6 /100 | #71 | Exceptional 58.4% |
| Austrians | 99.6 /100 | #72 | Exceptional 58.4% |
| Bolivians | 99.6 /100 | #73 | Exceptional 58.3% |
| Immigrants | Afghanistan | 99.6 /100 | #74 | Exceptional 58.3% |