Tongan vs Immigrants 4th Grade
COMPARE
Tongan
Immigrants
4th Grade
4th Grade Comparison
Tongans
Immigrants
97.3%
4TH GRADE
5.8/ 100
METRIC RATING
219th/ 347
METRIC RANK
96.5%
4TH GRADE
0.0/ 100
METRIC RATING
301st/ 347
METRIC RANK
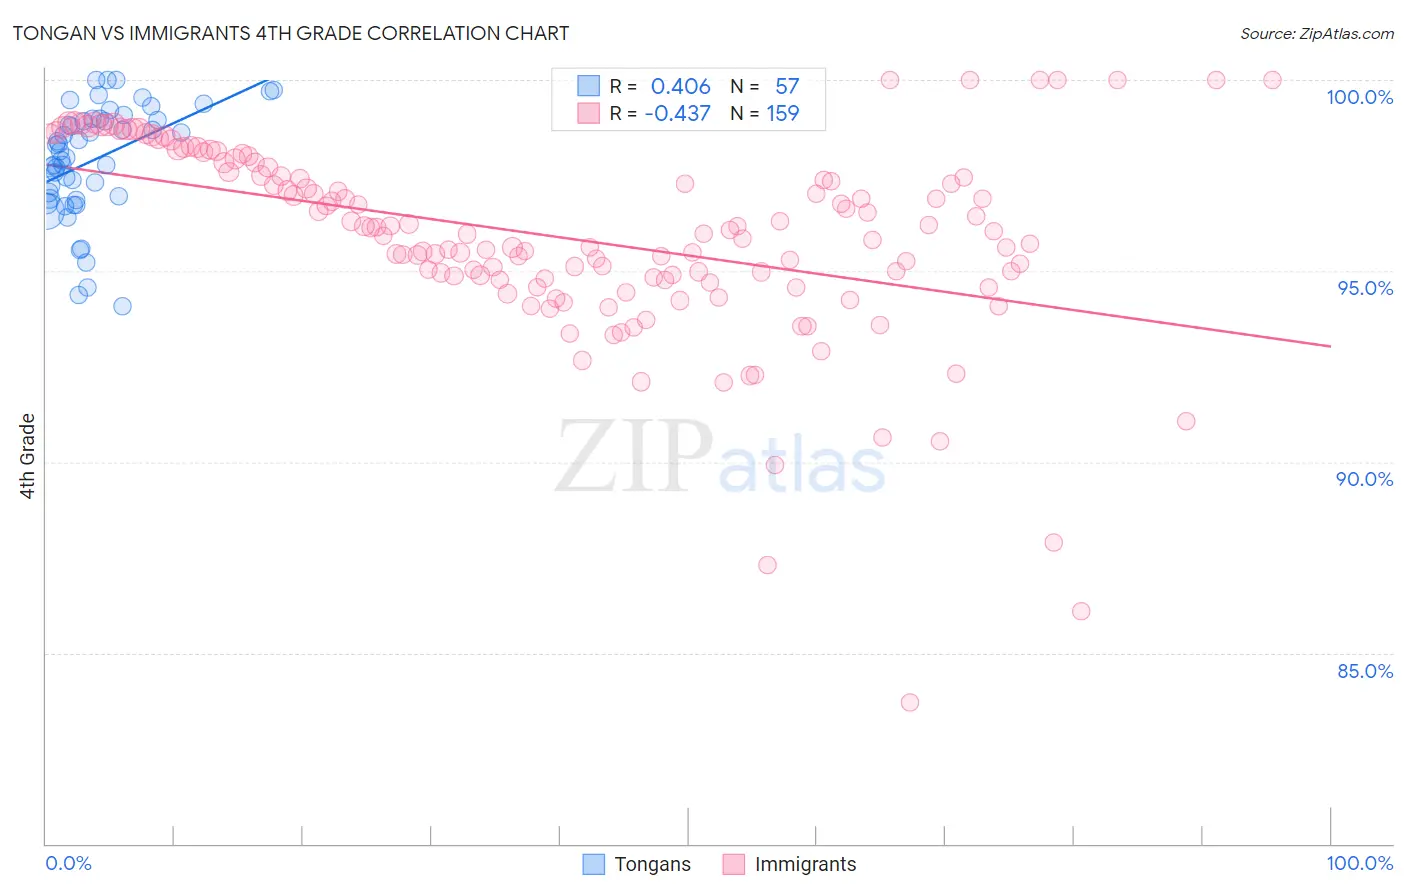
Tongan vs Immigrants 4th Grade Correlation Chart
The statistical analysis conducted on geographies consisting of 102,877,776 people shows a moderate positive correlation between the proportion of Tongans and percentage of population with at least 4th grade education in the United States with a correlation coefficient (R) of 0.406 and weighted average of 97.3%. Similarly, the statistical analysis conducted on geographies consisting of 577,786,979 people shows a moderate negative correlation between the proportion of Immigrants and percentage of population with at least 4th grade education in the United States with a correlation coefficient (R) of -0.437 and weighted average of 96.5%, a difference of 0.82%.
4th Grade Correlation Summary
| Measurement | Tongan | Immigrants |
| Minimum | 94.1% | 83.7% |
| Maximum | 100.0% | 100.0% |
| Range | 5.9% | 16.3% |
| Mean | 97.9% | 95.9% |
| Median | 98.1% | 96.0% |
| Interquartile 25% (IQ1) | 96.9% | 94.8% |
| Interquartile 75% (IQ3) | 99.0% | 97.7% |
| Interquartile Range (IQR) | 2.1% | 2.9% |
| Standard Deviation (Sample) | 1.4% | 2.6% |
| Standard Deviation (Population) | 1.4% | 2.6% |
Similar Demographics by 4th Grade
Demographics Similar to Tongans by 4th Grade
In terms of 4th grade, the demographic groups most similar to Tongans are Sierra Leonean (97.3%, a difference of 0.010%), Iraqi (97.3%, a difference of 0.010%), South American Indian (97.3%, a difference of 0.010%), Immigrants from Panama (97.3%, a difference of 0.010%), and Immigrants from Lebanon (97.3%, a difference of 0.010%).
| Demographics | Rating | Rank | 4th Grade |
| Tohono O'odham | 8.4 /100 | #212 | Tragic 97.3% |
| Costa Ricans | 8.3 /100 | #213 | Tragic 97.3% |
| Immigrants | Nepal | 7.7 /100 | #214 | Tragic 97.3% |
| Immigrants | Morocco | 7.1 /100 | #215 | Tragic 97.3% |
| Samoans | 6.8 /100 | #216 | Tragic 97.3% |
| Sierra Leoneans | 6.5 /100 | #217 | Tragic 97.3% |
| Iraqis | 6.3 /100 | #218 | Tragic 97.3% |
| Tongans | 5.8 /100 | #219 | Tragic 97.3% |
| South American Indians | 5.5 /100 | #220 | Tragic 97.3% |
| Immigrants | Panama | 5.4 /100 | #221 | Tragic 97.3% |
| Immigrants | Lebanon | 5.1 /100 | #222 | Tragic 97.3% |
| Immigrants | Sudan | 5.0 /100 | #223 | Tragic 97.2% |
| Immigrants | Syria | 5.0 /100 | #224 | Tragic 97.2% |
| Immigrants | Iraq | 4.6 /100 | #225 | Tragic 97.2% |
| Bahamians | 3.8 /100 | #226 | Tragic 97.2% |
Demographics Similar to Immigrants by 4th Grade
In terms of 4th grade, the demographic groups most similar to Immigrants are Immigrants from Cuba (96.4%, a difference of 0.030%), Immigrants from Dominica (96.5%, a difference of 0.050%), Immigrants from South Eastern Asia (96.5%, a difference of 0.050%), Haitian (96.5%, a difference of 0.060%), and Immigrants from Somalia (96.5%, a difference of 0.080%).
| Demographics | Rating | Rank | 4th Grade |
| Immigrants | Eritrea | 0.0 /100 | #294 | Tragic 96.7% |
| Immigrants | Portugal | 0.0 /100 | #295 | Tragic 96.6% |
| Somalis | 0.0 /100 | #296 | Tragic 96.6% |
| Immigrants | Somalia | 0.0 /100 | #297 | Tragic 96.5% |
| Haitians | 0.0 /100 | #298 | Tragic 96.5% |
| Immigrants | Dominica | 0.0 /100 | #299 | Tragic 96.5% |
| Immigrants | South Eastern Asia | 0.0 /100 | #300 | Tragic 96.5% |
| Immigrants | Immigrants | 0.0 /100 | #301 | Tragic 96.5% |
| Immigrants | Cuba | 0.0 /100 | #302 | Tragic 96.4% |
| Guyanese | 0.0 /100 | #303 | Tragic 96.4% |
| Ecuadorians | 0.0 /100 | #304 | Tragic 96.4% |
| Immigrants | Caribbean | 0.0 /100 | #305 | Tragic 96.4% |
| Sri Lankans | 0.0 /100 | #306 | Tragic 96.4% |
| Immigrants | Haiti | 0.0 /100 | #307 | Tragic 96.3% |
| Immigrants | Laos | 0.0 /100 | #308 | Tragic 96.3% |