Immigrants from Dominican Republic vs Senegalese No Vehicles in Household
COMPARE
Immigrants from Dominican Republic
Senegalese
No Vehicles in Household
No Vehicles in Household Comparison
Immigrants from Dominican Republic
Senegalese
31.4%
NO VEHICLES IN HOUSEHOLD
0.0/ 100
METRIC RATING
344th/ 347
METRIC RANK
19.8%
NO VEHICLES IN HOUSEHOLD
0.0/ 100
METRIC RATING
325th/ 347
METRIC RANK
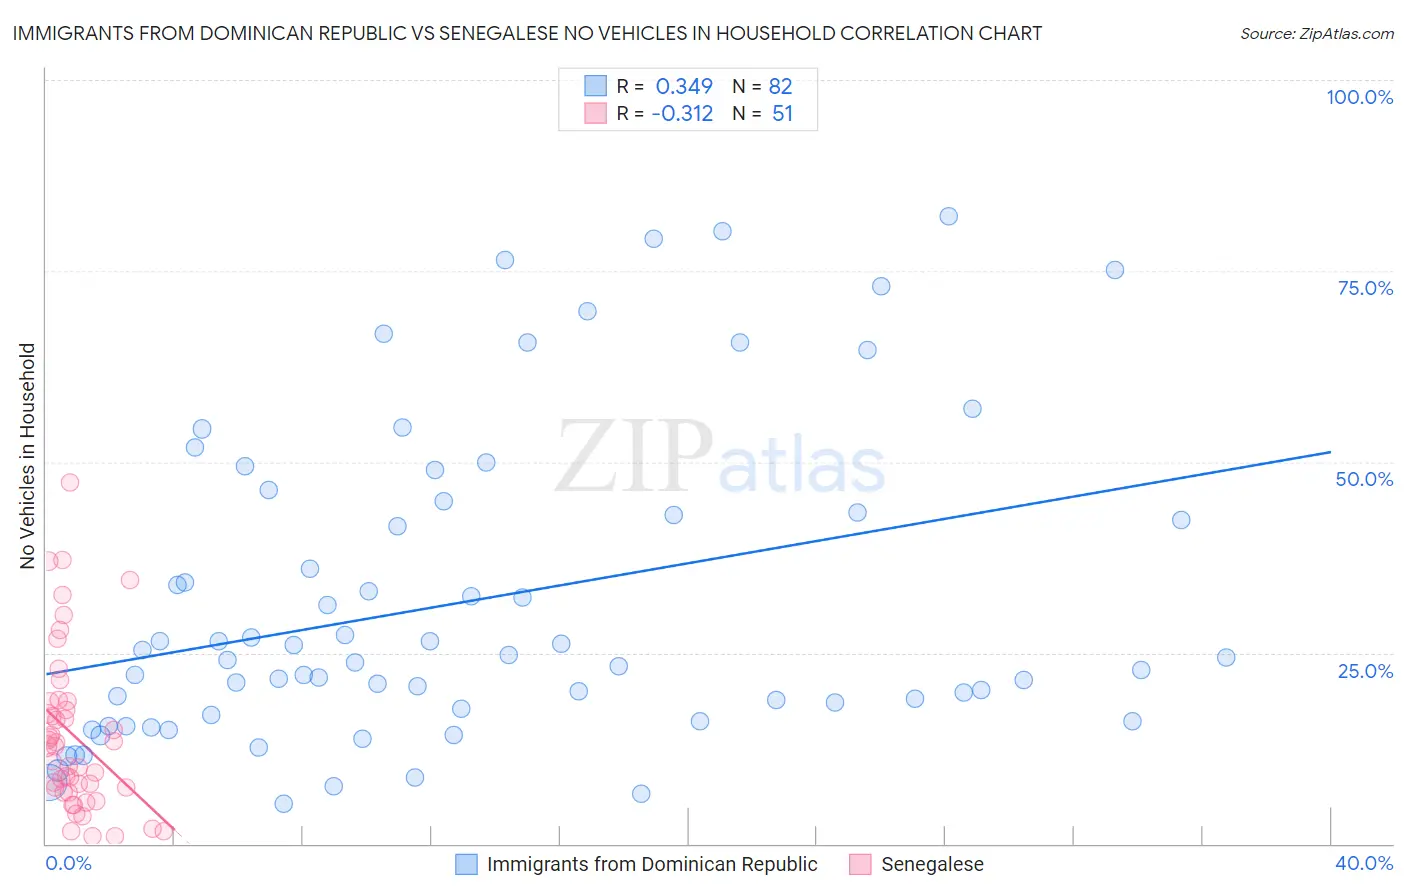
Immigrants from Dominican Republic vs Senegalese No Vehicles in Household Correlation Chart
The statistical analysis conducted on geographies consisting of 274,700,556 people shows a mild positive correlation between the proportion of Immigrants from Dominican Republic and percentage of households with no vehicle available in the United States with a correlation coefficient (R) of 0.349 and weighted average of 31.4%. Similarly, the statistical analysis conducted on geographies consisting of 78,058,872 people shows a mild negative correlation between the proportion of Senegalese and percentage of households with no vehicle available in the United States with a correlation coefficient (R) of -0.312 and weighted average of 19.8%, a difference of 59.1%.
No Vehicles in Household Correlation Summary
| Measurement | Immigrants from Dominican Republic | Senegalese |
| Minimum | 5.3% | 0.99% |
| Maximum | 82.1% | 47.3% |
| Range | 76.8% | 46.3% |
| Mean | 31.7% | 14.1% |
| Median | 24.2% | 12.8% |
| Interquartile 25% (IQ1) | 16.8% | 6.7% |
| Interquartile 75% (IQ3) | 43.3% | 18.7% |
| Interquartile Range (IQR) | 26.5% | 11.9% |
| Standard Deviation (Sample) | 20.3% | 10.5% |
| Standard Deviation (Population) | 20.2% | 10.4% |
Demographics Similar to Immigrants from Dominican Republic and Senegalese by No Vehicles in Household
In terms of no vehicles in household, the demographic groups most similar to Immigrants from Dominican Republic are Inupiat (29.9%, a difference of 5.2%), British West Indian (29.7%, a difference of 5.7%), Immigrants from Guyana (29.5%, a difference of 6.6%), Immigrants from Barbados (29.5%, a difference of 6.6%), and Dominican (29.4%, a difference of 6.9%). Similarly, the demographic groups most similar to Senegalese are Immigrants from Caribbean (19.6%, a difference of 0.72%), Immigrants from West Indies (20.5%, a difference of 3.9%), Immigrants from Senegal (21.1%, a difference of 7.0%), Immigrants from Dominica (22.2%, a difference of 12.6%), and Ecuadorian (22.8%, a difference of 15.1%).
| Demographics | Rating | Rank | No Vehicles in Household |
| Immigrants | Caribbean | 0.0 /100 | #324 | Tragic 19.6% |
| Senegalese | 0.0 /100 | #325 | Tragic 19.8% |
| Immigrants | West Indies | 0.0 /100 | #326 | Tragic 20.5% |
| Immigrants | Senegal | 0.0 /100 | #327 | Tragic 21.1% |
| Immigrants | Dominica | 0.0 /100 | #328 | Tragic 22.2% |
| Ecuadorians | 0.0 /100 | #329 | Tragic 22.8% |
| West Indians | 0.0 /100 | #330 | Tragic 23.7% |
| Trinidadians and Tobagonians | 0.0 /100 | #331 | Tragic 23.7% |
| Immigrants | Ecuador | 0.0 /100 | #332 | Tragic 23.8% |
| Immigrants | Trinidad and Tobago | 0.0 /100 | #333 | Tragic 24.6% |
| Immigrants | Bangladesh | 0.0 /100 | #334 | Tragic 25.8% |
| Barbadians | 0.0 /100 | #335 | Tragic 26.1% |
| Vietnamese | 0.0 /100 | #336 | Tragic 26.2% |
| Immigrants | Uzbekistan | 0.0 /100 | #337 | Tragic 26.7% |
| Guyanese | 0.0 /100 | #338 | Tragic 29.3% |
| Dominicans | 0.0 /100 | #339 | Tragic 29.4% |
| Immigrants | Barbados | 0.0 /100 | #340 | Tragic 29.5% |
| Immigrants | Guyana | 0.0 /100 | #341 | Tragic 29.5% |
| British West Indians | 0.0 /100 | #342 | Tragic 29.7% |
| Inupiat | 0.0 /100 | #343 | Tragic 29.9% |
| Immigrants | Dominican Republic | 0.0 /100 | #344 | Tragic 31.4% |