Immigrants from Guyana vs Kiowa 2 or more Vehicles in Household
COMPARE
Immigrants from Guyana
Kiowa
2 or more Vehicles in Household
2 or more Vehicles in Household Comparison
Immigrants from Guyana
Kiowa
35.0%
2 OR MORE VEHICLES IN HOUSEHOLD
0.0/ 100
METRIC RATING
343rd/ 347
METRIC RANK
53.9%
2 OR MORE VEHICLES IN HOUSEHOLD
6.2/ 100
METRIC RATING
222nd/ 347
METRIC RANK
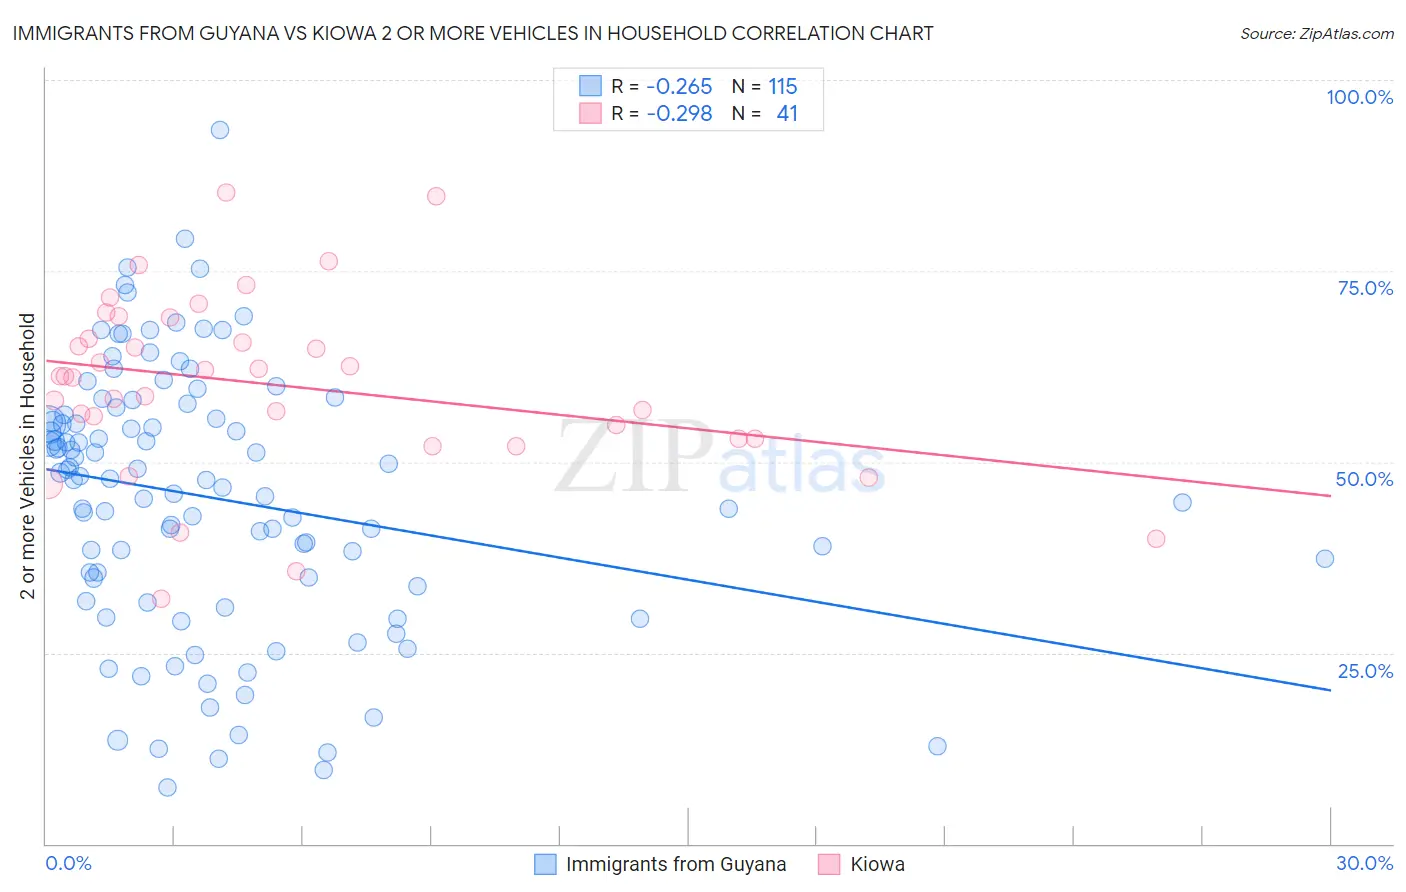
Immigrants from Guyana vs Kiowa 2 or more Vehicles in Household Correlation Chart
The statistical analysis conducted on geographies consisting of 183,691,149 people shows a weak negative correlation between the proportion of Immigrants from Guyana and percentage of households with 2 or more vehicles available in the United States with a correlation coefficient (R) of -0.265 and weighted average of 35.0%. Similarly, the statistical analysis conducted on geographies consisting of 56,099,396 people shows a weak negative correlation between the proportion of Kiowa and percentage of households with 2 or more vehicles available in the United States with a correlation coefficient (R) of -0.298 and weighted average of 53.9%, a difference of 53.8%.
2 or more Vehicles in Household Correlation Summary
| Measurement | Immigrants from Guyana | Kiowa |
| Minimum | 7.4% | 32.0% |
| Maximum | 93.5% | 85.3% |
| Range | 86.1% | 53.2% |
| Mean | 45.2% | 60.1% |
| Median | 47.6% | 61.2% |
| Interquartile 25% (IQ1) | 33.7% | 53.1% |
| Interquartile 75% (IQ3) | 56.2% | 67.5% |
| Interquartile Range (IQR) | 22.5% | 14.5% |
| Standard Deviation (Sample) | 17.3% | 11.7% |
| Standard Deviation (Population) | 17.2% | 11.6% |
Similar Demographics by 2 or more Vehicles in Household
Demographics Similar to Immigrants from Guyana by 2 or more Vehicles in Household
In terms of 2 or more vehicles in household, the demographic groups most similar to Immigrants from Guyana are Yup'ik (34.9%, a difference of 0.17%), Dominican (35.3%, a difference of 0.89%), Guyanese (35.4%, a difference of 1.1%), British West Indian (35.4%, a difference of 1.1%), and Immigrants from Barbados (35.8%, a difference of 2.2%).
| Demographics | Rating | Rank | 2 or more Vehicles in Household |
| Immigrants | Ecuador | 0.0 /100 | #333 | Tragic 40.5% |
| Immigrants | Trinidad and Tobago | 0.0 /100 | #334 | Tragic 40.3% |
| Immigrants | Bangladesh | 0.0 /100 | #335 | Tragic 38.8% |
| Vietnamese | 0.0 /100 | #336 | Tragic 38.5% |
| Barbadians | 0.0 /100 | #337 | Tragic 38.3% |
| Immigrants | Uzbekistan | 0.0 /100 | #338 | Tragic 37.9% |
| Immigrants | Barbados | 0.0 /100 | #339 | Tragic 35.8% |
| British West Indians | 0.0 /100 | #340 | Tragic 35.4% |
| Guyanese | 0.0 /100 | #341 | Tragic 35.4% |
| Dominicans | 0.0 /100 | #342 | Tragic 35.3% |
| Immigrants | Guyana | 0.0 /100 | #343 | Tragic 35.0% |
| Yup'ik | 0.0 /100 | #344 | Tragic 34.9% |
| Immigrants | Dominican Republic | 0.0 /100 | #345 | Tragic 33.2% |
| Immigrants | St. Vincent and the Grenadines | 0.0 /100 | #346 | Tragic 31.0% |
| Immigrants | Grenada | 0.0 /100 | #347 | Tragic 28.7% |
Demographics Similar to Kiowa by 2 or more Vehicles in Household
In terms of 2 or more vehicles in household, the demographic groups most similar to Kiowa are Immigrants from Singapore (53.9%, a difference of 0.010%), Taiwanese (53.9%, a difference of 0.030%), South American Indian (53.9%, a difference of 0.050%), Immigrants from Argentina (53.9%, a difference of 0.11%), and Immigrants from Bosnia and Herzegovina (53.8%, a difference of 0.13%).
| Demographics | Rating | Rank | 2 or more Vehicles in Household |
| Aleuts | 9.3 /100 | #215 | Tragic 54.1% |
| Immigrants | Western Asia | 9.3 /100 | #216 | Tragic 54.1% |
| Immigrants | Burma/Myanmar | 7.1 /100 | #217 | Tragic 53.9% |
| Immigrants | Argentina | 6.8 /100 | #218 | Tragic 53.9% |
| South American Indians | 6.5 /100 | #219 | Tragic 53.9% |
| Taiwanese | 6.3 /100 | #220 | Tragic 53.9% |
| Immigrants | Singapore | 6.3 /100 | #221 | Tragic 53.9% |
| Kiowa | 6.2 /100 | #222 | Tragic 53.9% |
| Immigrants | Bosnia and Herzegovina | 5.5 /100 | #223 | Tragic 53.8% |
| Brazilians | 5.3 /100 | #224 | Tragic 53.8% |
| Immigrants | Egypt | 5.2 /100 | #225 | Tragic 53.8% |
| Immigrants | Eastern Africa | 5.1 /100 | #226 | Tragic 53.7% |
| Sudanese | 4.1 /100 | #227 | Tragic 53.6% |
| Alaska Natives | 3.9 /100 | #228 | Tragic 53.6% |
| Immigrants | Turkey | 3.8 /100 | #229 | Tragic 53.6% |