Moroccan vs Immigrants from Scotland 4 or more Vehicles in Household
COMPARE
Moroccan
Immigrants from Scotland
4 or more Vehicles in Household
4 or more Vehicles in Household Comparison
Moroccans
Immigrants from Scotland
4.9%
4 OR MORE VEHICLES IN HOUSEHOLD
0.0/ 100
METRIC RATING
310th/ 347
METRIC RANK
6.7%
4 OR MORE VEHICLES IN HOUSEHOLD
89.0/ 100
METRIC RATING
130th/ 347
METRIC RANK
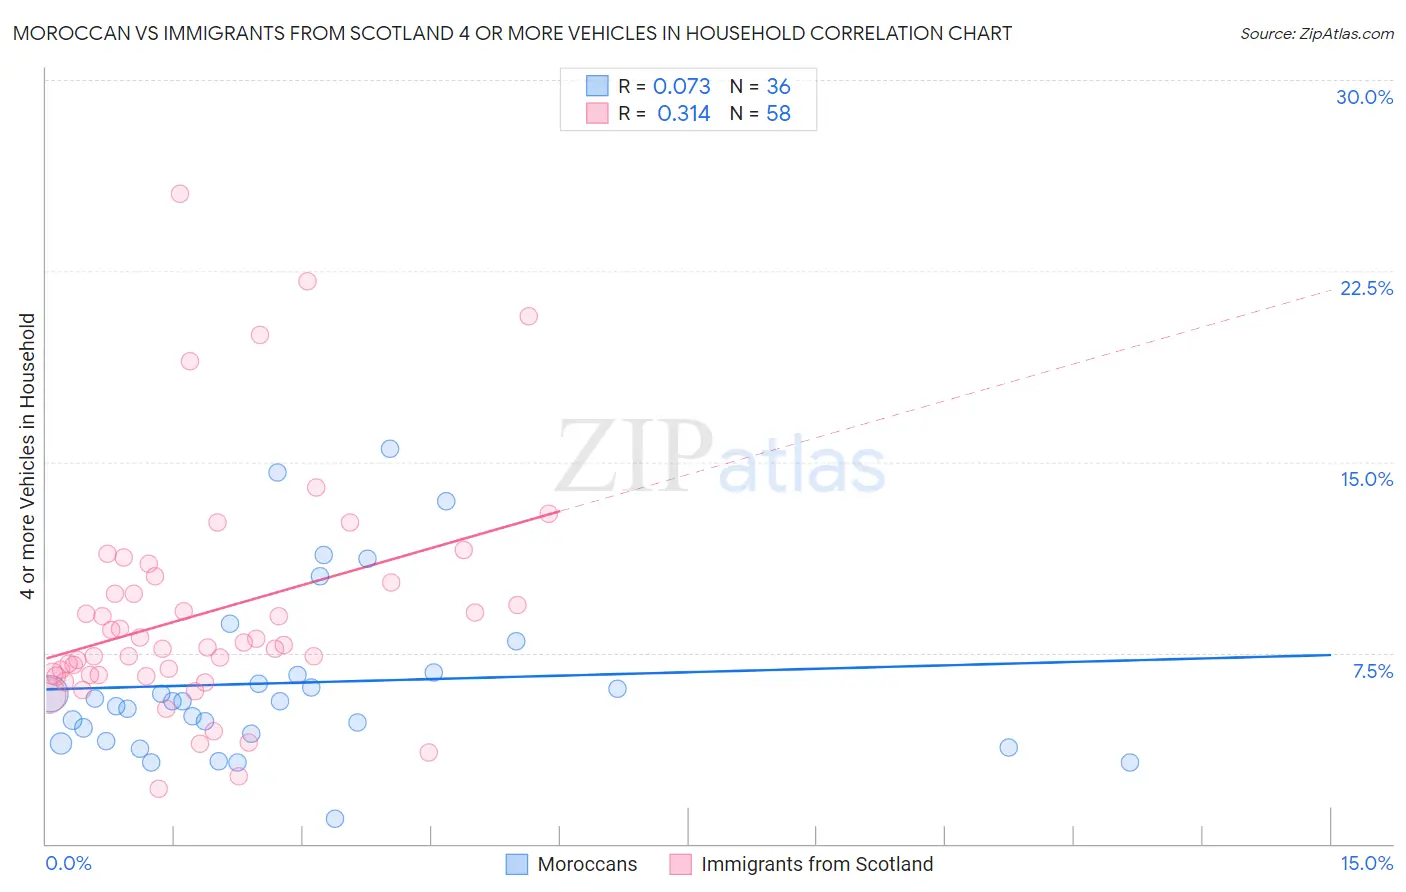
Moroccan vs Immigrants from Scotland 4 or more Vehicles in Household Correlation Chart
The statistical analysis conducted on geographies consisting of 200,763,454 people shows a slight positive correlation between the proportion of Moroccans and percentage of households with 4 or more vehicles available in the United States with a correlation coefficient (R) of 0.073 and weighted average of 4.9%. Similarly, the statistical analysis conducted on geographies consisting of 195,944,485 people shows a mild positive correlation between the proportion of Immigrants from Scotland and percentage of households with 4 or more vehicles available in the United States with a correlation coefficient (R) of 0.314 and weighted average of 6.7%, a difference of 35.6%.
4 or more Vehicles in Household Correlation Summary
| Measurement | Moroccan | Immigrants from Scotland |
| Minimum | 0.99% | 2.2% |
| Maximum | 15.5% | 25.6% |
| Range | 14.5% | 23.4% |
| Mean | 6.3% | 9.1% |
| Median | 5.6% | 7.7% |
| Interquartile 25% (IQ1) | 4.2% | 6.6% |
| Interquartile 75% (IQ3) | 6.7% | 10.3% |
| Interquartile Range (IQR) | 2.5% | 3.6% |
| Standard Deviation (Sample) | 3.3% | 4.6% |
| Standard Deviation (Population) | 3.3% | 4.6% |
Similar Demographics by 4 or more Vehicles in Household
Demographics Similar to Moroccans by 4 or more Vehicles in Household
In terms of 4 or more vehicles in household, the demographic groups most similar to Moroccans are Houma (4.9%, a difference of 0.010%), Immigrants from Somalia (4.9%, a difference of 0.38%), Paraguayan (4.9%, a difference of 0.54%), Menominee (5.0%, a difference of 1.3%), and Immigrants from Serbia (5.0%, a difference of 2.2%).
| Demographics | Rating | Rank | 4 or more Vehicles in Household |
| Immigrants | Greece | 0.0 /100 | #303 | Tragic 5.1% |
| Cypriots | 0.0 /100 | #304 | Tragic 5.0% |
| Somalis | 0.0 /100 | #305 | Tragic 5.0% |
| Immigrants | Serbia | 0.0 /100 | #306 | Tragic 5.0% |
| Menominee | 0.0 /100 | #307 | Tragic 5.0% |
| Paraguayans | 0.0 /100 | #308 | Tragic 4.9% |
| Immigrants | Somalia | 0.0 /100 | #309 | Tragic 4.9% |
| Moroccans | 0.0 /100 | #310 | Tragic 4.9% |
| Houma | 0.0 /100 | #311 | Tragic 4.9% |
| Albanians | 0.0 /100 | #312 | Tragic 4.8% |
| Immigrants | Israel | 0.0 /100 | #313 | Tragic 4.8% |
| Immigrants | West Indies | 0.0 /100 | #314 | Tragic 4.7% |
| Immigrants | Belarus | 0.0 /100 | #315 | Tragic 4.7% |
| Puerto Ricans | 0.0 /100 | #316 | Tragic 4.7% |
| U.S. Virgin Islanders | 0.0 /100 | #317 | Tragic 4.6% |
Demographics Similar to Immigrants from Scotland by 4 or more Vehicles in Household
In terms of 4 or more vehicles in household, the demographic groups most similar to Immigrants from Scotland are Maltese (6.7%, a difference of 0.15%), Immigrants from Netherlands (6.6%, a difference of 0.29%), Armenian (6.6%, a difference of 0.48%), Ottawa (6.6%, a difference of 0.50%), and Tohono O'odham (6.6%, a difference of 0.53%).
| Demographics | Rating | Rank | 4 or more Vehicles in Household |
| Immigrants | Immigrants | 94.6 /100 | #123 | Exceptional 6.8% |
| Immigrants | Asia | 94.4 /100 | #124 | Exceptional 6.8% |
| Austrians | 94.1 /100 | #125 | Exceptional 6.8% |
| Belgians | 94.1 /100 | #126 | Exceptional 6.8% |
| Immigrants | Korea | 93.8 /100 | #127 | Exceptional 6.8% |
| Immigrants | Bolivia | 92.5 /100 | #128 | Exceptional 6.7% |
| Immigrants | England | 92.0 /100 | #129 | Exceptional 6.7% |
| Immigrants | Scotland | 89.0 /100 | #130 | Excellent 6.7% |
| Maltese | 88.4 /100 | #131 | Excellent 6.7% |
| Immigrants | Netherlands | 87.8 /100 | #132 | Excellent 6.6% |
| Armenians | 86.9 /100 | #133 | Excellent 6.6% |
| Ottawa | 86.9 /100 | #134 | Excellent 6.6% |
| Tohono O'odham | 86.7 /100 | #135 | Excellent 6.6% |
| Luxembourgers | 86.4 /100 | #136 | Excellent 6.6% |
| French Canadians | 85.4 /100 | #137 | Excellent 6.6% |