Taiwanese vs Spanish American Indian 4 or more Vehicles in Household
COMPARE
Taiwanese
Spanish American Indian
4 or more Vehicles in Household
4 or more Vehicles in Household Comparison
Taiwanese
Spanish American Indians
7.0%
4 OR MORE VEHICLES IN HOUSEHOLD
98.7/ 100
METRIC RATING
100th/ 347
METRIC RANK
10.8%
4 OR MORE VEHICLES IN HOUSEHOLD
100.0/ 100
METRIC RATING
3rd/ 347
METRIC RANK
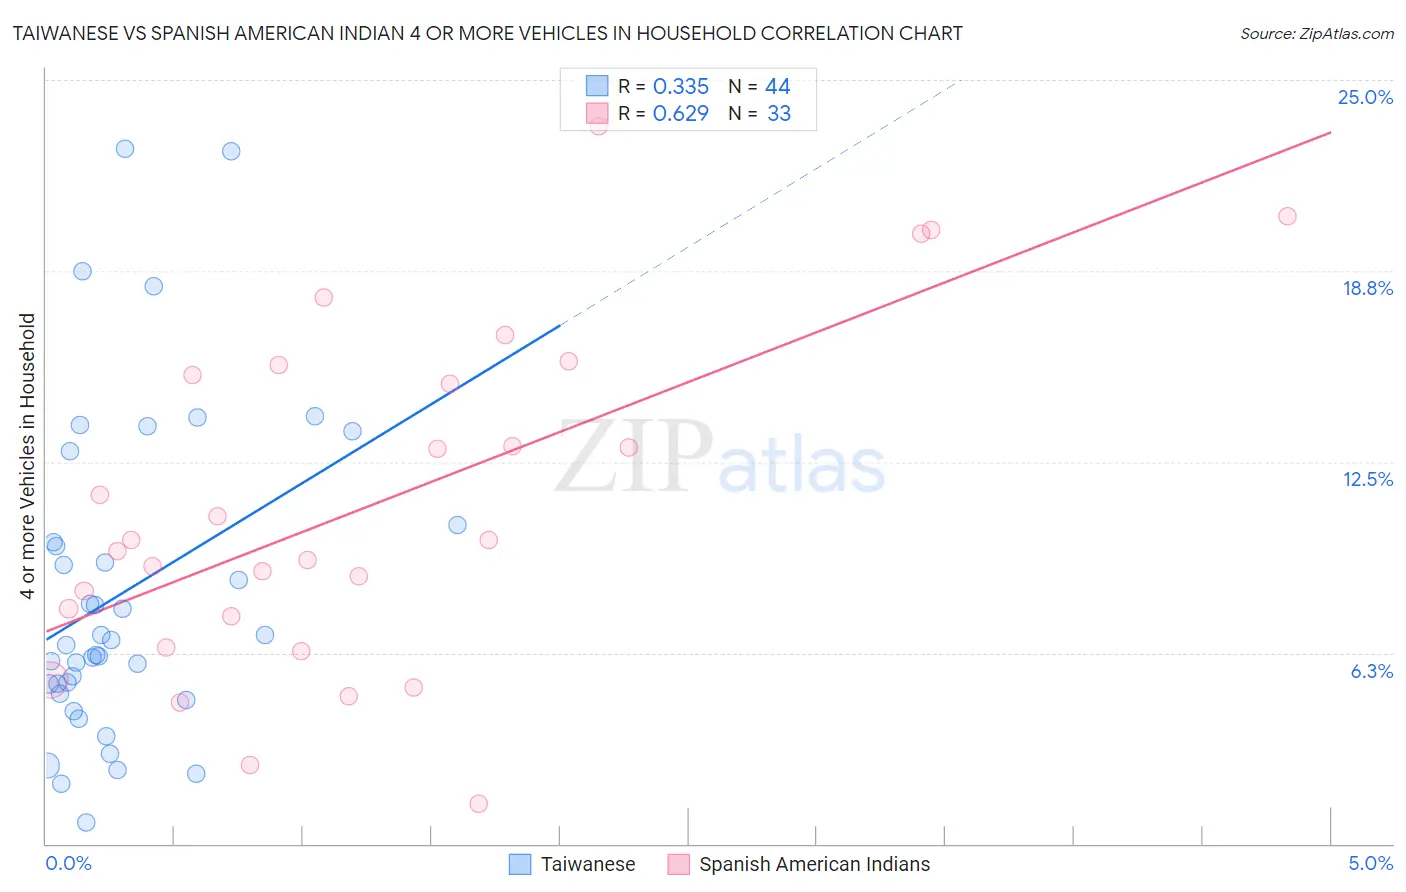
Taiwanese vs Spanish American Indian 4 or more Vehicles in Household Correlation Chart
The statistical analysis conducted on geographies consisting of 31,673,553 people shows a mild positive correlation between the proportion of Taiwanese and percentage of households with 4 or more vehicles available in the United States with a correlation coefficient (R) of 0.335 and weighted average of 7.0%. Similarly, the statistical analysis conducted on geographies consisting of 73,144,698 people shows a significant positive correlation between the proportion of Spanish American Indians and percentage of households with 4 or more vehicles available in the United States with a correlation coefficient (R) of 0.629 and weighted average of 10.8%, a difference of 53.4%.
4 or more Vehicles in Household Correlation Summary
| Measurement | Taiwanese | Spanish American Indian |
| Minimum | 0.68% | 1.3% |
| Maximum | 22.7% | 23.5% |
| Range | 22.1% | 22.2% |
| Mean | 8.3% | 11.1% |
| Median | 6.6% | 9.9% |
| Interquartile 25% (IQ1) | 5.1% | 6.9% |
| Interquartile 75% (IQ3) | 10.1% | 15.5% |
| Interquartile Range (IQR) | 5.1% | 8.6% |
| Standard Deviation (Sample) | 5.3% | 5.5% |
| Standard Deviation (Population) | 5.2% | 5.5% |
Similar Demographics by 4 or more Vehicles in Household
Demographics Similar to Taiwanese by 4 or more Vehicles in Household
In terms of 4 or more vehicles in household, the demographic groups most similar to Taiwanese are Pakistani (7.0%, a difference of 0.070%), Seminole (7.0%, a difference of 0.080%), Asian (7.0%, a difference of 0.14%), Blackfeet (7.0%, a difference of 0.15%), and Irish (7.1%, a difference of 0.52%).
| Demographics | Rating | Rank | 4 or more Vehicles in Household |
| Immigrants | Afghanistan | 99.3 /100 | #93 | Exceptional 7.1% |
| Dutch West Indians | 99.3 /100 | #94 | Exceptional 7.1% |
| Czechoslovakians | 99.3 /100 | #95 | Exceptional 7.1% |
| Central Americans | 99.3 /100 | #96 | Exceptional 7.1% |
| Celtics | 99.1 /100 | #97 | Exceptional 7.1% |
| Irish | 99.0 /100 | #98 | Exceptional 7.1% |
| Seminole | 98.8 /100 | #99 | Exceptional 7.0% |
| Taiwanese | 98.7 /100 | #100 | Exceptional 7.0% |
| Pakistanis | 98.7 /100 | #101 | Exceptional 7.0% |
| Asians | 98.6 /100 | #102 | Exceptional 7.0% |
| Blackfeet | 98.6 /100 | #103 | Exceptional 7.0% |
| Hmong | 98.3 /100 | #104 | Exceptional 7.0% |
| German Russians | 98.3 /100 | #105 | Exceptional 7.0% |
| Guatemalans | 98.1 /100 | #106 | Exceptional 7.0% |
| Nicaraguans | 98.0 /100 | #107 | Exceptional 7.0% |
Demographics Similar to Spanish American Indians by 4 or more Vehicles in Household
In terms of 4 or more vehicles in household, the demographic groups most similar to Spanish American Indians are Colville (11.1%, a difference of 3.5%), Tongan (10.0%, a difference of 7.3%), Immigrants from Fiji (9.6%, a difference of 11.9%), Puget Sound Salish (9.4%, a difference of 14.7%), and Native Hawaiian (9.4%, a difference of 14.7%).
| Demographics | Rating | Rank | 4 or more Vehicles in Household |
| Yakama | 100 /100 | #1 | Exceptional 12.9% |
| Colville | 100.0 /100 | #2 | Exceptional 11.1% |
| Spanish American Indians | 100.0 /100 | #3 | Exceptional 10.8% |
| Tongans | 100.0 /100 | #4 | Exceptional 10.0% |
| Immigrants | Fiji | 100.0 /100 | #5 | Exceptional 9.6% |
| Puget Sound Salish | 100.0 /100 | #6 | Exceptional 9.4% |
| Native Hawaiians | 100.0 /100 | #7 | Exceptional 9.4% |
| Arapaho | 100.0 /100 | #8 | Exceptional 9.4% |
| Samoans | 100.0 /100 | #9 | Exceptional 9.2% |
| Paiute | 100.0 /100 | #10 | Exceptional 9.0% |
| Immigrants | Mexico | 100.0 /100 | #11 | Exceptional 9.0% |
| Mexicans | 100.0 /100 | #12 | Exceptional 8.9% |
| Hawaiians | 100.0 /100 | #13 | Exceptional 8.9% |
| Chinese | 100.0 /100 | #14 | Exceptional 8.8% |
| Shoshone | 100.0 /100 | #15 | Exceptional 8.8% |