Taiwanese vs Spanish American Indian 10th Grade
COMPARE
Taiwanese
Spanish American Indian
10th Grade
10th Grade Comparison
Taiwanese
Spanish American Indians
92.5%
10TH GRADE
0.3/ 100
METRIC RATING
267th/ 347
METRIC RANK
86.2%
10TH GRADE
0.0/ 100
METRIC RATING
346th/ 347
METRIC RANK
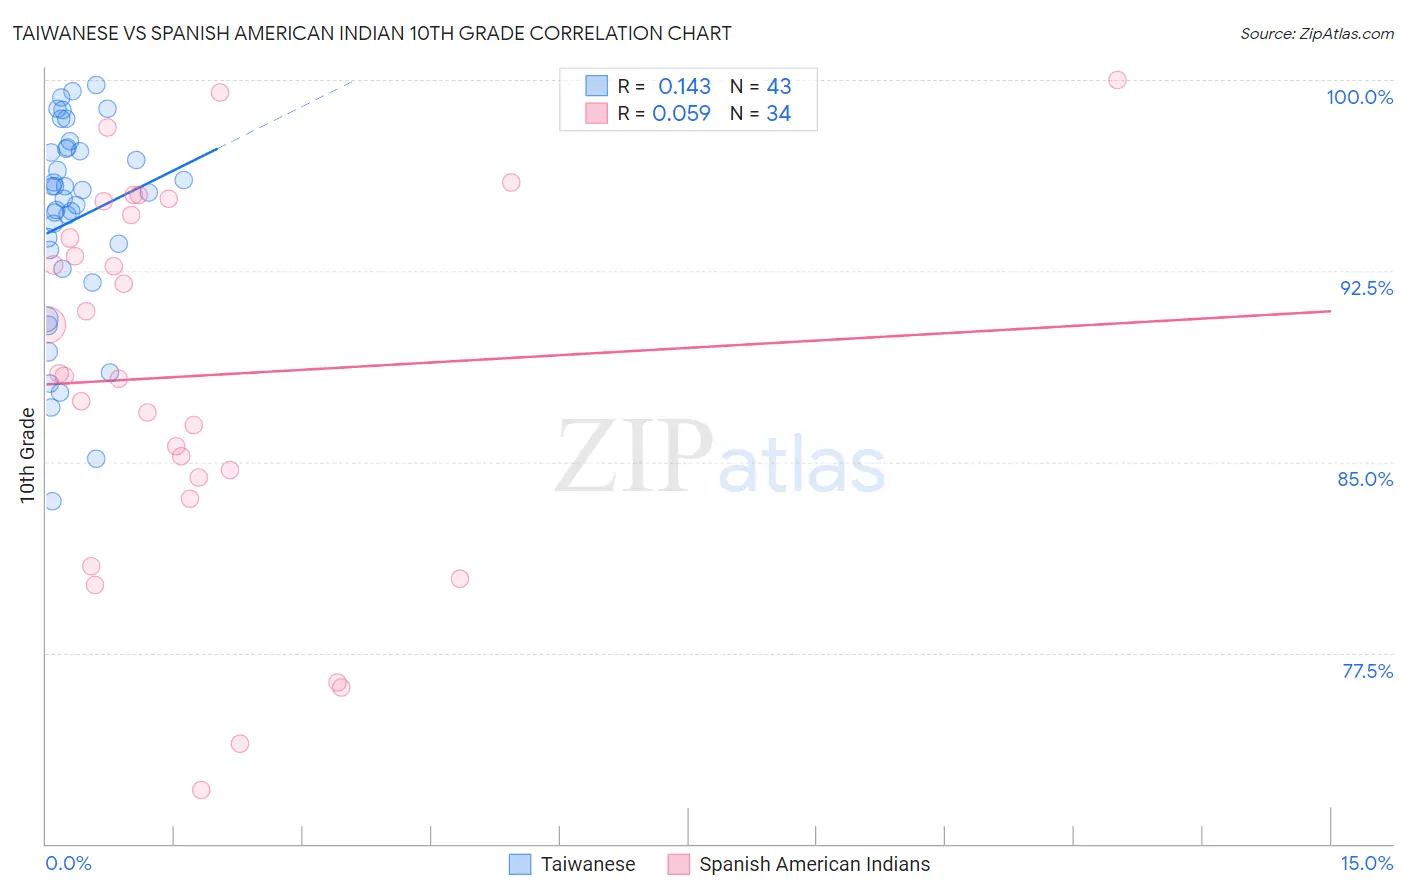
Taiwanese vs Spanish American Indian 10th Grade Correlation Chart
The statistical analysis conducted on geographies consisting of 31,677,387 people shows a poor positive correlation between the proportion of Taiwanese and percentage of population with at least 10th grade education in the United States with a correlation coefficient (R) of 0.143 and weighted average of 92.5%. Similarly, the statistical analysis conducted on geographies consisting of 73,147,813 people shows a slight positive correlation between the proportion of Spanish American Indians and percentage of population with at least 10th grade education in the United States with a correlation coefficient (R) of 0.059 and weighted average of 86.2%, a difference of 7.3%.
10th Grade Correlation Summary
| Measurement | Taiwanese | Spanish American Indian |
| Minimum | 83.5% | 72.1% |
| Maximum | 99.8% | 100.0% |
| Range | 16.3% | 27.9% |
| Mean | 94.5% | 88.4% |
| Median | 95.6% | 88.4% |
| Interquartile 25% (IQ1) | 92.6% | 84.4% |
| Interquartile 75% (IQ3) | 97.3% | 94.7% |
| Interquartile Range (IQR) | 4.7% | 10.3% |
| Standard Deviation (Sample) | 4.0% | 7.4% |
| Standard Deviation (Population) | 4.0% | 7.3% |
Similar Demographics by 10th Grade
Demographics Similar to Taiwanese by 10th Grade
In terms of 10th grade, the demographic groups most similar to Taiwanese are Immigrants from Ghana (92.5%, a difference of 0.0%), Dutch West Indian (92.6%, a difference of 0.010%), Immigrants from Philippines (92.6%, a difference of 0.010%), Immigrants from Colombia (92.5%, a difference of 0.020%), and Immigrants from Uruguay (92.5%, a difference of 0.020%).
| Demographics | Rating | Rank | 10th Grade |
| Immigrants | Uzbekistan | 0.5 /100 | #260 | Tragic 92.6% |
| Paiute | 0.4 /100 | #261 | Tragic 92.6% |
| Immigrants | South America | 0.4 /100 | #262 | Tragic 92.6% |
| Apache | 0.4 /100 | #263 | Tragic 92.6% |
| Peruvians | 0.4 /100 | #264 | Tragic 92.6% |
| Dutch West Indians | 0.4 /100 | #265 | Tragic 92.6% |
| Immigrants | Philippines | 0.4 /100 | #266 | Tragic 92.6% |
| Taiwanese | 0.3 /100 | #267 | Tragic 92.5% |
| Immigrants | Ghana | 0.3 /100 | #268 | Tragic 92.5% |
| Immigrants | Colombia | 0.3 /100 | #269 | Tragic 92.5% |
| Immigrants | Uruguay | 0.3 /100 | #270 | Tragic 92.5% |
| Immigrants | Eritrea | 0.3 /100 | #271 | Tragic 92.5% |
| Immigrants | Western Africa | 0.3 /100 | #272 | Tragic 92.5% |
| Trinidadians and Tobagonians | 0.2 /100 | #273 | Tragic 92.4% |
| Immigrants | Congo | 0.2 /100 | #274 | Tragic 92.4% |
Demographics Similar to Spanish American Indians by 10th Grade
In terms of 10th grade, the demographic groups most similar to Spanish American Indians are Immigrants from Mexico (86.2%, a difference of 0.010%), Immigrants from Central America (86.6%, a difference of 0.45%), Immigrants from El Salvador (86.8%, a difference of 0.63%), Yakama (86.9%, a difference of 0.77%), and Immigrants from Guatemala (87.4%, a difference of 1.4%).
| Demographics | Rating | Rank | 10th Grade |
| Hondurans | 0.0 /100 | #333 | Tragic 89.0% |
| Hispanics or Latinos | 0.0 /100 | #334 | Tragic 88.9% |
| Immigrants | Dominican Republic | 0.0 /100 | #335 | Tragic 88.7% |
| Immigrants | Honduras | 0.0 /100 | #336 | Tragic 88.5% |
| Central Americans | 0.0 /100 | #337 | Tragic 88.4% |
| Immigrants | Latin America | 0.0 /100 | #338 | Tragic 88.3% |
| Guatemalans | 0.0 /100 | #339 | Tragic 87.9% |
| Mexicans | 0.0 /100 | #340 | Tragic 87.8% |
| Salvadorans | 0.0 /100 | #341 | Tragic 87.5% |
| Immigrants | Guatemala | 0.0 /100 | #342 | Tragic 87.4% |
| Yakama | 0.0 /100 | #343 | Tragic 86.9% |
| Immigrants | El Salvador | 0.0 /100 | #344 | Tragic 86.8% |
| Immigrants | Central America | 0.0 /100 | #345 | Tragic 86.6% |
| Spanish American Indians | 0.0 /100 | #346 | Tragic 86.2% |
| Immigrants | Mexico | 0.0 /100 | #347 | Tragic 86.2% |