Immigrants from Ecuador vs Spanish American Indian 4 or more Vehicles in Household
COMPARE
Immigrants from Ecuador
Spanish American Indian
4 or more Vehicles in Household
4 or more Vehicles in Household Comparison
Immigrants from Ecuador
Spanish American Indians
4.2%
4 OR MORE VEHICLES IN HOUSEHOLD
0.0/ 100
METRIC RATING
330th/ 347
METRIC RANK
10.8%
4 OR MORE VEHICLES IN HOUSEHOLD
100.0/ 100
METRIC RATING
3rd/ 347
METRIC RANK
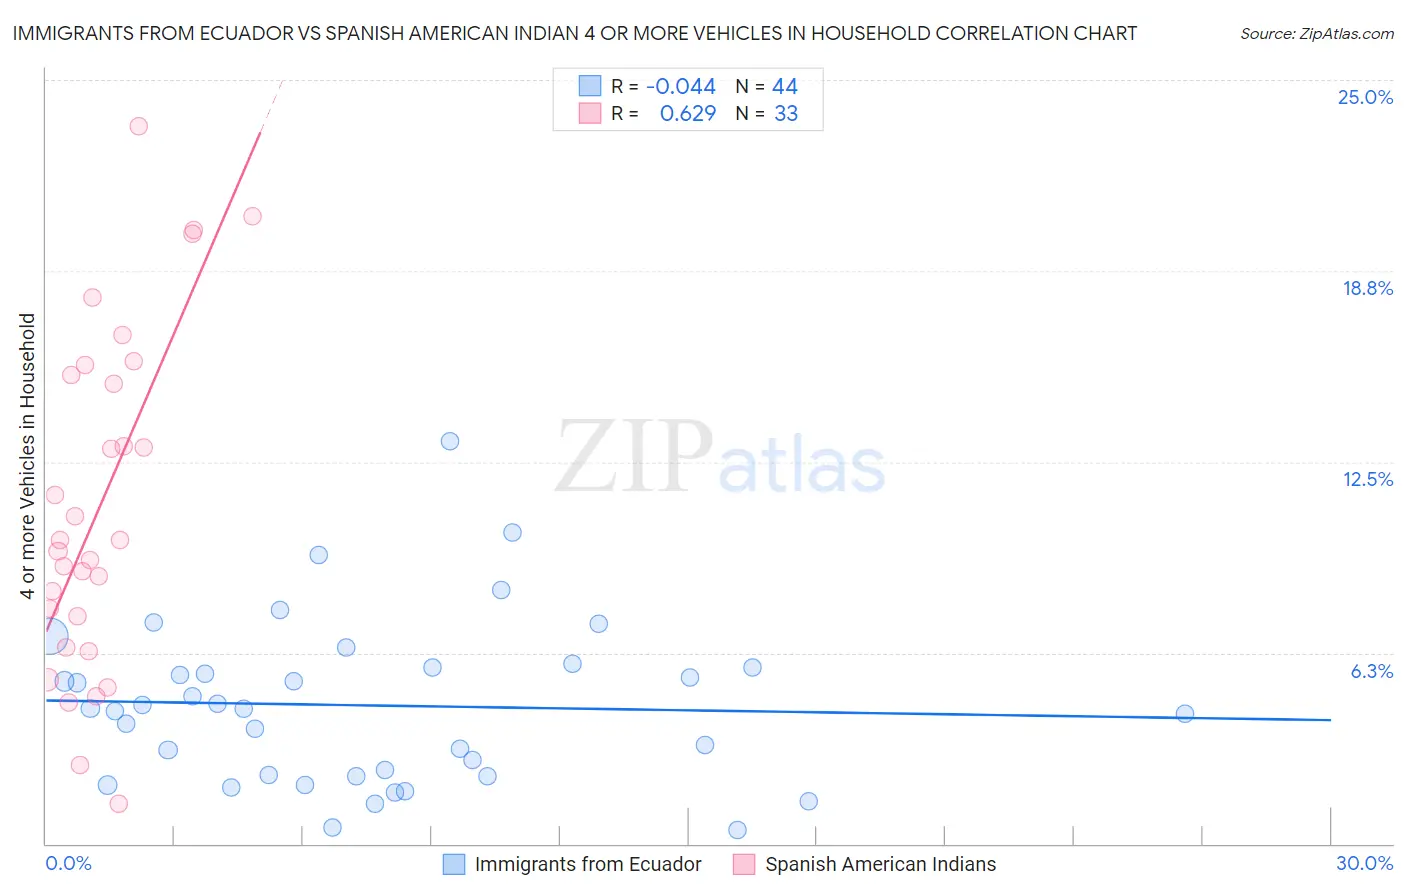
Immigrants from Ecuador vs Spanish American Indian 4 or more Vehicles in Household Correlation Chart
The statistical analysis conducted on geographies consisting of 269,639,406 people shows no correlation between the proportion of Immigrants from Ecuador and percentage of households with 4 or more vehicles available in the United States with a correlation coefficient (R) of -0.044 and weighted average of 4.2%. Similarly, the statistical analysis conducted on geographies consisting of 73,144,698 people shows a significant positive correlation between the proportion of Spanish American Indians and percentage of households with 4 or more vehicles available in the United States with a correlation coefficient (R) of 0.629 and weighted average of 10.8%, a difference of 154.4%.
4 or more Vehicles in Household Correlation Summary
| Measurement | Immigrants from Ecuador | Spanish American Indian |
| Minimum | 0.44% | 1.3% |
| Maximum | 13.2% | 23.5% |
| Range | 12.7% | 22.2% |
| Mean | 4.5% | 11.1% |
| Median | 4.4% | 9.9% |
| Interquartile 25% (IQ1) | 2.2% | 6.9% |
| Interquartile 75% (IQ3) | 5.8% | 15.5% |
| Interquartile Range (IQR) | 3.5% | 8.6% |
| Standard Deviation (Sample) | 2.7% | 5.5% |
| Standard Deviation (Population) | 2.6% | 5.5% |
Similar Demographics by 4 or more Vehicles in Household
Demographics Similar to Immigrants from Ecuador by 4 or more Vehicles in Household
In terms of 4 or more vehicles in household, the demographic groups most similar to Immigrants from Ecuador are Immigrants from Senegal (4.2%, a difference of 0.20%), West Indian (4.2%, a difference of 0.26%), Trinidadian and Tobagonian (4.3%, a difference of 0.47%), Immigrants from Dominica (4.2%, a difference of 1.2%), and Senegalese (4.3%, a difference of 2.1%).
| Demographics | Rating | Rank | 4 or more Vehicles in Household |
| Immigrants | Caribbean | 0.0 /100 | #323 | Tragic 4.4% |
| Soviet Union | 0.0 /100 | #324 | Tragic 4.4% |
| Immigrants | Jamaica | 0.0 /100 | #325 | Tragic 4.4% |
| Cape Verdeans | 0.0 /100 | #326 | Tragic 4.4% |
| Senegalese | 0.0 /100 | #327 | Tragic 4.3% |
| Trinidadians and Tobagonians | 0.0 /100 | #328 | Tragic 4.3% |
| Immigrants | Senegal | 0.0 /100 | #329 | Tragic 4.2% |
| Immigrants | Ecuador | 0.0 /100 | #330 | Tragic 4.2% |
| West Indians | 0.0 /100 | #331 | Tragic 4.2% |
| Immigrants | Dominica | 0.0 /100 | #332 | Tragic 4.2% |
| Immigrants | Albania | 0.0 /100 | #333 | Tragic 4.1% |
| Immigrants | Trinidad and Tobago | 0.0 /100 | #334 | Tragic 4.1% |
| Barbadians | 0.0 /100 | #335 | Tragic 3.9% |
| Immigrants | Bangladesh | 0.0 /100 | #336 | Tragic 3.9% |
| Vietnamese | 0.0 /100 | #337 | Tragic 3.9% |
Demographics Similar to Spanish American Indians by 4 or more Vehicles in Household
In terms of 4 or more vehicles in household, the demographic groups most similar to Spanish American Indians are Colville (11.1%, a difference of 3.5%), Tongan (10.0%, a difference of 7.3%), Immigrants from Fiji (9.6%, a difference of 11.9%), Puget Sound Salish (9.4%, a difference of 14.7%), and Native Hawaiian (9.4%, a difference of 14.7%).
| Demographics | Rating | Rank | 4 or more Vehicles in Household |
| Yakama | 100 /100 | #1 | Exceptional 12.9% |
| Colville | 100.0 /100 | #2 | Exceptional 11.1% |
| Spanish American Indians | 100.0 /100 | #3 | Exceptional 10.8% |
| Tongans | 100.0 /100 | #4 | Exceptional 10.0% |
| Immigrants | Fiji | 100.0 /100 | #5 | Exceptional 9.6% |
| Puget Sound Salish | 100.0 /100 | #6 | Exceptional 9.4% |
| Native Hawaiians | 100.0 /100 | #7 | Exceptional 9.4% |
| Arapaho | 100.0 /100 | #8 | Exceptional 9.4% |
| Samoans | 100.0 /100 | #9 | Exceptional 9.2% |
| Paiute | 100.0 /100 | #10 | Exceptional 9.0% |
| Immigrants | Mexico | 100.0 /100 | #11 | Exceptional 9.0% |
| Mexicans | 100.0 /100 | #12 | Exceptional 8.9% |
| Hawaiians | 100.0 /100 | #13 | Exceptional 8.9% |
| Chinese | 100.0 /100 | #14 | Exceptional 8.8% |
| Shoshone | 100.0 /100 | #15 | Exceptional 8.8% |