Taiwanese vs Immigrants from Switzerland 4 or more Vehicles in Household
COMPARE
Taiwanese
Immigrants from Switzerland
4 or more Vehicles in Household
4 or more Vehicles in Household Comparison
Taiwanese
Immigrants from Switzerland
7.0%
4 OR MORE VEHICLES IN HOUSEHOLD
98.7/ 100
METRIC RATING
100th/ 347
METRIC RANK
5.9%
4 OR MORE VEHICLES IN HOUSEHOLD
6.4/ 100
METRIC RATING
231st/ 347
METRIC RANK
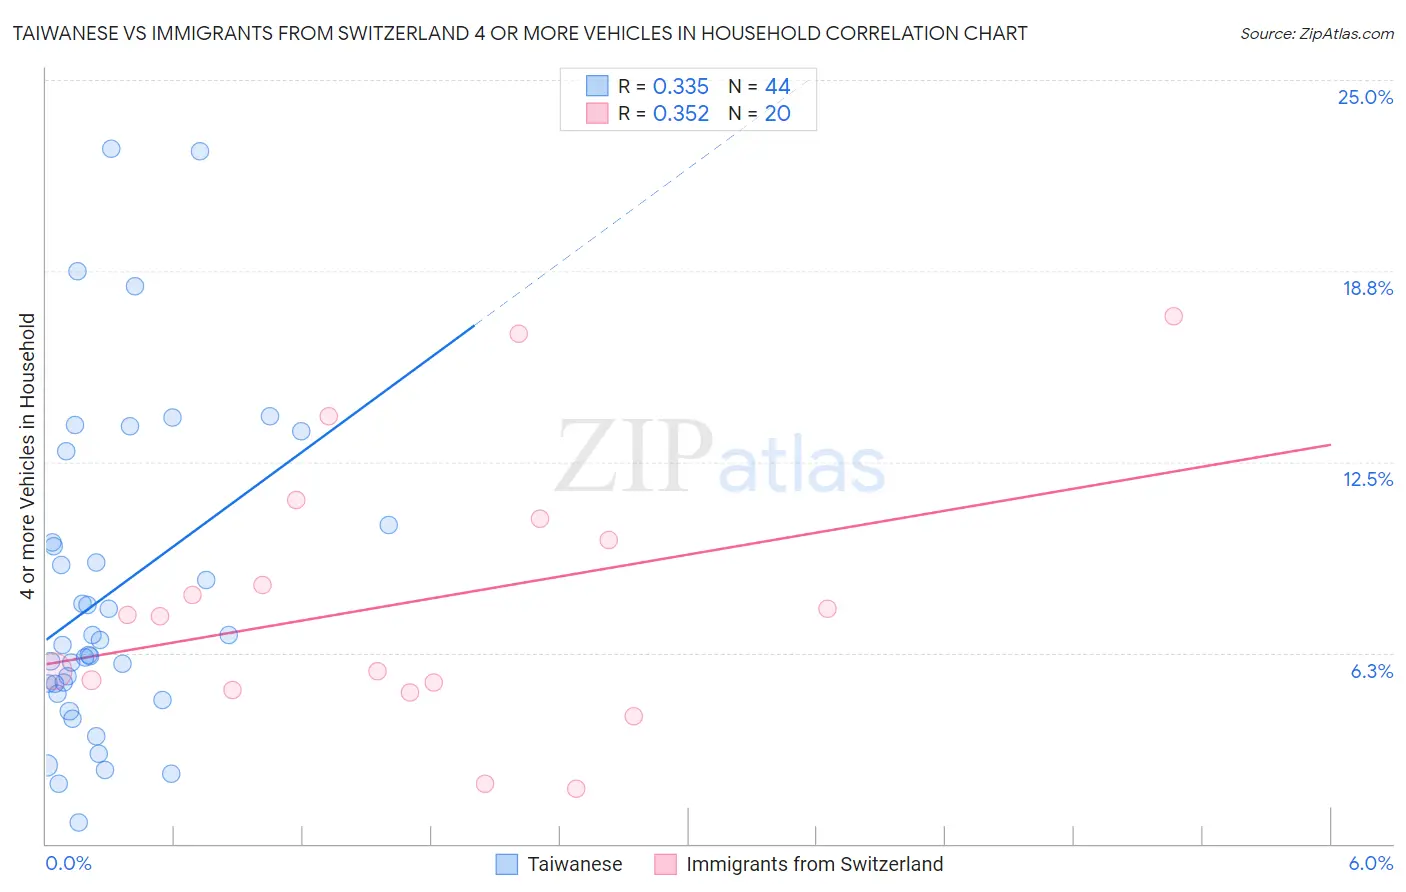
Taiwanese vs Immigrants from Switzerland 4 or more Vehicles in Household Correlation Chart
The statistical analysis conducted on geographies consisting of 31,673,553 people shows a mild positive correlation between the proportion of Taiwanese and percentage of households with 4 or more vehicles available in the United States with a correlation coefficient (R) of 0.335 and weighted average of 7.0%. Similarly, the statistical analysis conducted on geographies consisting of 147,473,847 people shows a mild positive correlation between the proportion of Immigrants from Switzerland and percentage of households with 4 or more vehicles available in the United States with a correlation coefficient (R) of 0.352 and weighted average of 5.9%, a difference of 19.1%.
4 or more Vehicles in Household Correlation Summary
| Measurement | Taiwanese | Immigrants from Switzerland |
| Minimum | 0.68% | 1.8% |
| Maximum | 22.7% | 17.3% |
| Range | 22.1% | 15.5% |
| Mean | 8.3% | 7.9% |
| Median | 6.6% | 7.5% |
| Interquartile 25% (IQ1) | 5.1% | 5.2% |
| Interquartile 75% (IQ3) | 10.1% | 10.3% |
| Interquartile Range (IQR) | 5.1% | 5.1% |
| Standard Deviation (Sample) | 5.3% | 4.3% |
| Standard Deviation (Population) | 5.2% | 4.2% |
Similar Demographics by 4 or more Vehicles in Household
Demographics Similar to Taiwanese by 4 or more Vehicles in Household
In terms of 4 or more vehicles in household, the demographic groups most similar to Taiwanese are Pakistani (7.0%, a difference of 0.070%), Seminole (7.0%, a difference of 0.080%), Asian (7.0%, a difference of 0.14%), Blackfeet (7.0%, a difference of 0.15%), and Irish (7.1%, a difference of 0.52%).
| Demographics | Rating | Rank | 4 or more Vehicles in Household |
| Immigrants | Afghanistan | 99.3 /100 | #93 | Exceptional 7.1% |
| Dutch West Indians | 99.3 /100 | #94 | Exceptional 7.1% |
| Czechoslovakians | 99.3 /100 | #95 | Exceptional 7.1% |
| Central Americans | 99.3 /100 | #96 | Exceptional 7.1% |
| Celtics | 99.1 /100 | #97 | Exceptional 7.1% |
| Irish | 99.0 /100 | #98 | Exceptional 7.1% |
| Seminole | 98.8 /100 | #99 | Exceptional 7.0% |
| Taiwanese | 98.7 /100 | #100 | Exceptional 7.0% |
| Pakistanis | 98.7 /100 | #101 | Exceptional 7.0% |
| Asians | 98.6 /100 | #102 | Exceptional 7.0% |
| Blackfeet | 98.6 /100 | #103 | Exceptional 7.0% |
| Hmong | 98.3 /100 | #104 | Exceptional 7.0% |
| German Russians | 98.3 /100 | #105 | Exceptional 7.0% |
| Guatemalans | 98.1 /100 | #106 | Exceptional 7.0% |
| Nicaraguans | 98.0 /100 | #107 | Exceptional 7.0% |
Demographics Similar to Immigrants from Switzerland by 4 or more Vehicles in Household
In terms of 4 or more vehicles in household, the demographic groups most similar to Immigrants from Switzerland are Immigrants from Malaysia (5.9%, a difference of 0.12%), Eastern European (5.9%, a difference of 0.18%), Immigrants from Argentina (5.9%, a difference of 0.18%), Sierra Leonean (5.9%, a difference of 0.20%), and Immigrants from Uganda (5.9%, a difference of 0.47%).
| Demographics | Rating | Rank | 4 or more Vehicles in Household |
| Cubans | 9.2 /100 | #224 | Tragic 6.0% |
| Indonesians | 8.9 /100 | #225 | Tragic 6.0% |
| Immigrants | Singapore | 7.9 /100 | #226 | Tragic 5.9% |
| Immigrants | Western Asia | 7.8 /100 | #227 | Tragic 5.9% |
| Immigrants | Uganda | 7.5 /100 | #228 | Tragic 5.9% |
| Eastern Europeans | 6.8 /100 | #229 | Tragic 5.9% |
| Immigrants | Malaysia | 6.7 /100 | #230 | Tragic 5.9% |
| Immigrants | Switzerland | 6.4 /100 | #231 | Tragic 5.9% |
| Immigrants | Argentina | 6.0 /100 | #232 | Tragic 5.9% |
| Sierra Leoneans | 6.0 /100 | #233 | Tragic 5.9% |
| Africans | 4.6 /100 | #234 | Tragic 5.8% |
| Immigrants | Hungary | 4.6 /100 | #235 | Tragic 5.8% |
| Immigrants | Eritrea | 4.5 /100 | #236 | Tragic 5.8% |
| Turks | 4.1 /100 | #237 | Tragic 5.8% |
| Immigrants | Belgium | 4.0 /100 | #238 | Tragic 5.8% |