Taiwanese vs Immigrants from Senegal 4 or more Vehicles in Household
COMPARE
Taiwanese
Immigrants from Senegal
4 or more Vehicles in Household
4 or more Vehicles in Household Comparison
Taiwanese
Immigrants from Senegal
7.0%
4 OR MORE VEHICLES IN HOUSEHOLD
98.7/ 100
METRIC RATING
100th/ 347
METRIC RANK
4.2%
4 OR MORE VEHICLES IN HOUSEHOLD
0.0/ 100
METRIC RATING
329th/ 347
METRIC RANK
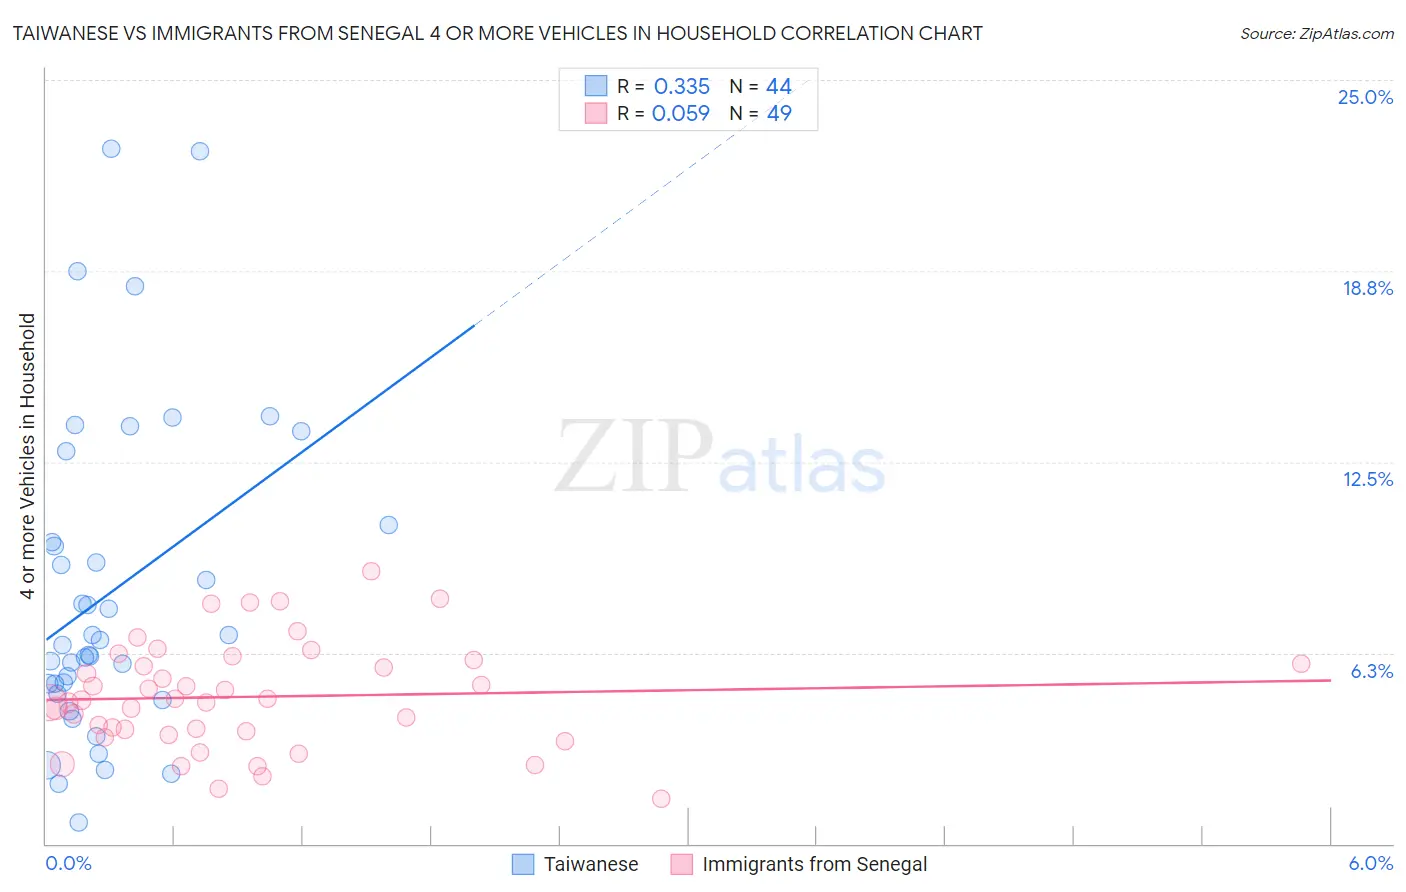
Taiwanese vs Immigrants from Senegal 4 or more Vehicles in Household Correlation Chart
The statistical analysis conducted on geographies consisting of 31,673,553 people shows a mild positive correlation between the proportion of Taiwanese and percentage of households with 4 or more vehicles available in the United States with a correlation coefficient (R) of 0.335 and weighted average of 7.0%. Similarly, the statistical analysis conducted on geographies consisting of 89,828,164 people shows a slight positive correlation between the proportion of Immigrants from Senegal and percentage of households with 4 or more vehicles available in the United States with a correlation coefficient (R) of 0.059 and weighted average of 4.2%, a difference of 65.5%.
4 or more Vehicles in Household Correlation Summary
| Measurement | Taiwanese | Immigrants from Senegal |
| Minimum | 0.68% | 1.5% |
| Maximum | 22.7% | 8.9% |
| Range | 22.1% | 7.5% |
| Mean | 8.3% | 4.8% |
| Median | 6.6% | 4.7% |
| Interquartile 25% (IQ1) | 5.1% | 3.6% |
| Interquartile 75% (IQ3) | 10.1% | 6.0% |
| Interquartile Range (IQR) | 5.1% | 2.3% |
| Standard Deviation (Sample) | 5.3% | 1.7% |
| Standard Deviation (Population) | 5.2% | 1.7% |
Similar Demographics by 4 or more Vehicles in Household
Demographics Similar to Taiwanese by 4 or more Vehicles in Household
In terms of 4 or more vehicles in household, the demographic groups most similar to Taiwanese are Pakistani (7.0%, a difference of 0.070%), Seminole (7.0%, a difference of 0.080%), Asian (7.0%, a difference of 0.14%), Blackfeet (7.0%, a difference of 0.15%), and Irish (7.1%, a difference of 0.52%).
| Demographics | Rating | Rank | 4 or more Vehicles in Household |
| Immigrants | Afghanistan | 99.3 /100 | #93 | Exceptional 7.1% |
| Dutch West Indians | 99.3 /100 | #94 | Exceptional 7.1% |
| Czechoslovakians | 99.3 /100 | #95 | Exceptional 7.1% |
| Central Americans | 99.3 /100 | #96 | Exceptional 7.1% |
| Celtics | 99.1 /100 | #97 | Exceptional 7.1% |
| Irish | 99.0 /100 | #98 | Exceptional 7.1% |
| Seminole | 98.8 /100 | #99 | Exceptional 7.0% |
| Taiwanese | 98.7 /100 | #100 | Exceptional 7.0% |
| Pakistanis | 98.7 /100 | #101 | Exceptional 7.0% |
| Asians | 98.6 /100 | #102 | Exceptional 7.0% |
| Blackfeet | 98.6 /100 | #103 | Exceptional 7.0% |
| Hmong | 98.3 /100 | #104 | Exceptional 7.0% |
| German Russians | 98.3 /100 | #105 | Exceptional 7.0% |
| Guatemalans | 98.1 /100 | #106 | Exceptional 7.0% |
| Nicaraguans | 98.0 /100 | #107 | Exceptional 7.0% |
Demographics Similar to Immigrants from Senegal by 4 or more Vehicles in Household
In terms of 4 or more vehicles in household, the demographic groups most similar to Immigrants from Senegal are Immigrants from Ecuador (4.2%, a difference of 0.20%), Trinidadian and Tobagonian (4.3%, a difference of 0.27%), West Indian (4.2%, a difference of 0.46%), Immigrants from Dominica (4.2%, a difference of 1.4%), and Senegalese (4.3%, a difference of 1.9%).
| Demographics | Rating | Rank | 4 or more Vehicles in Household |
| Immigrants | Yemen | 0.0 /100 | #322 | Tragic 4.5% |
| Immigrants | Caribbean | 0.0 /100 | #323 | Tragic 4.4% |
| Soviet Union | 0.0 /100 | #324 | Tragic 4.4% |
| Immigrants | Jamaica | 0.0 /100 | #325 | Tragic 4.4% |
| Cape Verdeans | 0.0 /100 | #326 | Tragic 4.4% |
| Senegalese | 0.0 /100 | #327 | Tragic 4.3% |
| Trinidadians and Tobagonians | 0.0 /100 | #328 | Tragic 4.3% |
| Immigrants | Senegal | 0.0 /100 | #329 | Tragic 4.2% |
| Immigrants | Ecuador | 0.0 /100 | #330 | Tragic 4.2% |
| West Indians | 0.0 /100 | #331 | Tragic 4.2% |
| Immigrants | Dominica | 0.0 /100 | #332 | Tragic 4.2% |
| Immigrants | Albania | 0.0 /100 | #333 | Tragic 4.1% |
| Immigrants | Trinidad and Tobago | 0.0 /100 | #334 | Tragic 4.1% |
| Barbadians | 0.0 /100 | #335 | Tragic 3.9% |
| Immigrants | Bangladesh | 0.0 /100 | #336 | Tragic 3.9% |