Taiwanese vs Spanish American Indian 4th Grade
COMPARE
Taiwanese
Spanish American Indian
4th Grade
4th Grade Comparison
Taiwanese
Spanish American Indians
97.0%
4TH GRADE
0.3/ 100
METRIC RATING
264th/ 347
METRIC RANK
94.6%
4TH GRADE
0.0/ 100
METRIC RATING
347th/ 347
METRIC RANK
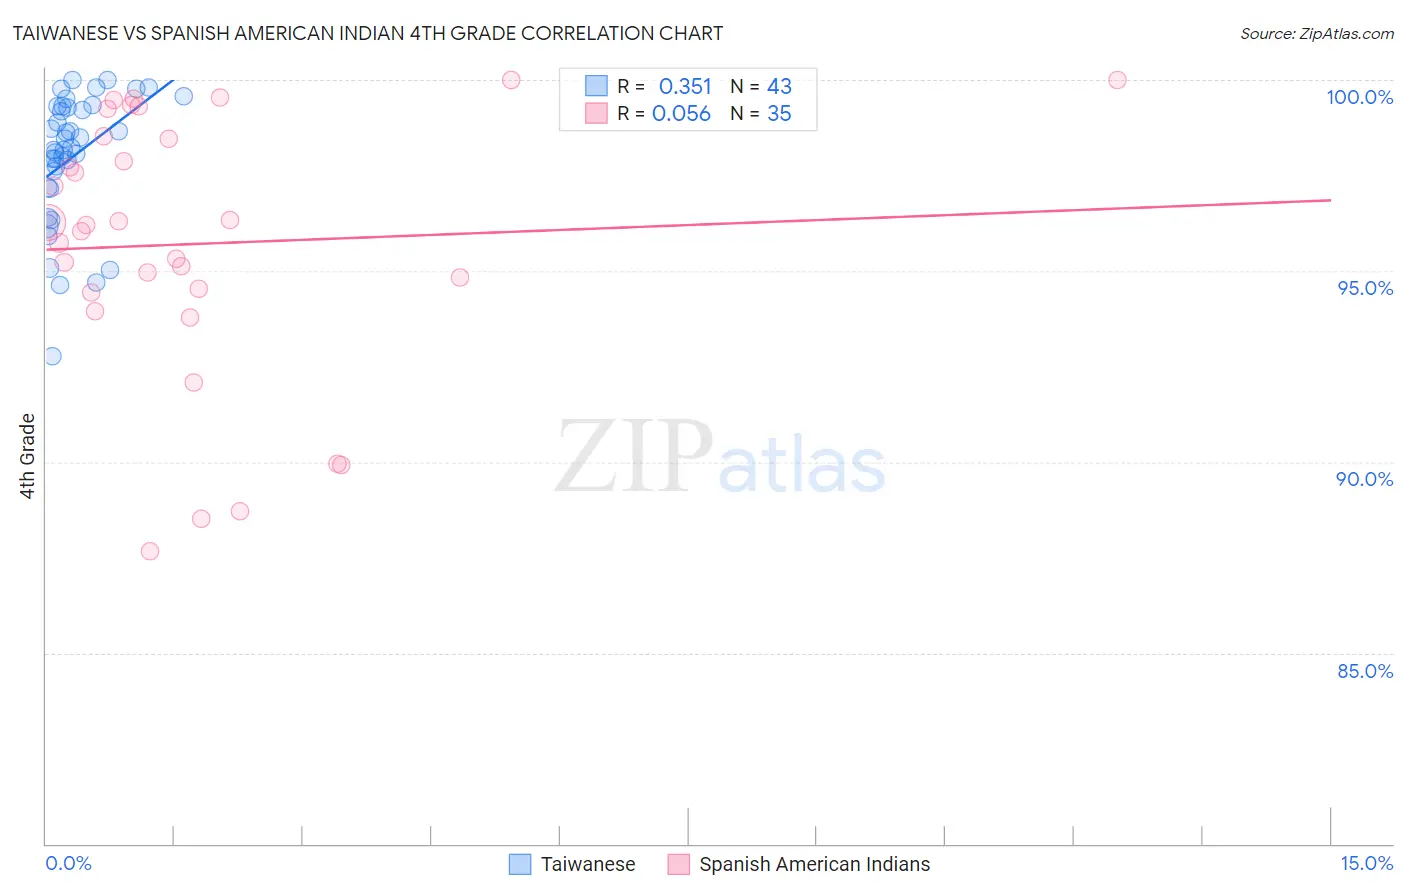
Taiwanese vs Spanish American Indian 4th Grade Correlation Chart
The statistical analysis conducted on geographies consisting of 31,677,387 people shows a mild positive correlation between the proportion of Taiwanese and percentage of population with at least 4th grade education in the United States with a correlation coefficient (R) of 0.351 and weighted average of 97.0%. Similarly, the statistical analysis conducted on geographies consisting of 73,150,359 people shows a slight positive correlation between the proportion of Spanish American Indians and percentage of population with at least 4th grade education in the United States with a correlation coefficient (R) of 0.056 and weighted average of 94.6%, a difference of 2.5%.
4th Grade Correlation Summary
| Measurement | Taiwanese | Spanish American Indian |
| Minimum | 92.8% | 87.7% |
| Maximum | 100.0% | 100.0% |
| Range | 7.2% | 12.3% |
| Mean | 98.0% | 95.7% |
| Median | 98.2% | 96.2% |
| Interquartile 25% (IQ1) | 97.2% | 94.4% |
| Interquartile 75% (IQ3) | 99.3% | 98.5% |
| Interquartile Range (IQR) | 2.1% | 4.1% |
| Standard Deviation (Sample) | 1.7% | 3.5% |
| Standard Deviation (Population) | 1.7% | 3.4% |
Similar Demographics by 4th Grade
Demographics Similar to Taiwanese by 4th Grade
In terms of 4th grade, the demographic groups most similar to Taiwanese are Armenian (97.0%, a difference of 0.0%), West Indian (97.0%, a difference of 0.010%), Immigrants from Jamaica (97.0%, a difference of 0.010%), Immigrants from China (97.0%, a difference of 0.010%), and Immigrants from Nigeria (97.0%, a difference of 0.010%).
| Demographics | Rating | Rank | 4th Grade |
| Immigrants | Congo | 0.5 /100 | #257 | Tragic 97.0% |
| Immigrants | Colombia | 0.5 /100 | #258 | Tragic 97.0% |
| Immigrants | Ethiopia | 0.4 /100 | #259 | Tragic 97.0% |
| Immigrants | Sierra Leone | 0.4 /100 | #260 | Tragic 97.0% |
| Immigrants | South America | 0.4 /100 | #261 | Tragic 97.0% |
| West Indians | 0.4 /100 | #262 | Tragic 97.0% |
| Immigrants | Jamaica | 0.3 /100 | #263 | Tragic 97.0% |
| Taiwanese | 0.3 /100 | #264 | Tragic 97.0% |
| Armenians | 0.3 /100 | #265 | Tragic 97.0% |
| Immigrants | China | 0.3 /100 | #266 | Tragic 97.0% |
| Immigrants | Nigeria | 0.3 /100 | #267 | Tragic 97.0% |
| Ghanaians | 0.2 /100 | #268 | Tragic 97.0% |
| Immigrants | Uzbekistan | 0.2 /100 | #269 | Tragic 96.9% |
| Cubans | 0.2 /100 | #270 | Tragic 96.9% |
| Immigrants | Peru | 0.1 /100 | #271 | Tragic 96.9% |
Demographics Similar to Spanish American Indians by 4th Grade
In terms of 4th grade, the demographic groups most similar to Spanish American Indians are Immigrants from El Salvador (94.8%, a difference of 0.18%), Salvadoran (95.0%, a difference of 0.46%), Immigrants from Mexico (95.1%, a difference of 0.47%), Immigrants from Guatemala (95.1%, a difference of 0.50%), and Immigrants from Central America (95.1%, a difference of 0.53%).
| Demographics | Rating | Rank | 4th Grade |
| Immigrants | Dominican Republic | 0.0 /100 | #333 | Tragic 95.7% |
| Immigrants | Cabo Verde | 0.0 /100 | #334 | Tragic 95.7% |
| Immigrants | Latin America | 0.0 /100 | #335 | Tragic 95.7% |
| Mexicans | 0.0 /100 | #336 | Tragic 95.6% |
| Central Americans | 0.0 /100 | #337 | Tragic 95.5% |
| Nepalese | 0.0 /100 | #338 | Tragic 95.5% |
| Guatemalans | 0.0 /100 | #339 | Tragic 95.3% |
| Yakama | 0.0 /100 | #340 | Tragic 95.2% |
| Immigrants | Yemen | 0.0 /100 | #341 | Tragic 95.2% |
| Immigrants | Central America | 0.0 /100 | #342 | Tragic 95.1% |
| Immigrants | Guatemala | 0.0 /100 | #343 | Tragic 95.1% |
| Immigrants | Mexico | 0.0 /100 | #344 | Tragic 95.1% |
| Salvadorans | 0.0 /100 | #345 | Tragic 95.0% |
| Immigrants | El Salvador | 0.0 /100 | #346 | Tragic 94.8% |
| Spanish American Indians | 0.0 /100 | #347 | Tragic 94.6% |